HAL Id: hal-01678527
https://hal.archives-ouvertes.fr/hal-01678527
Submitted on 15 May 2018
HAL is a multi-disciplinary open access
archive for the deposit and dissemination of
sci-entific research documents, whether they are
pub-lished or not. The documents may come from
teaching and research institutions in France or
abroad, or from public or private research centers.
L’archive ouverte pluridisciplinaire HAL, est
destinée au dépôt et à la diffusion de documents
scientifiques de niveau recherche, publiés ou non,
émanant des établissements d’enseignement et de
recherche français ou étrangers, des laboratoires
publics ou privés.
A Second Case of Variable Na I D Lines in a
Highly-reddened Type Ia Supernova (vol 693, pg 207,
2009)
Stephane Blondin, Jose L. Prieto, Ferdinando Patat, Peter Challis, Malcolm
Hicken, Robert P. Kirshner, Thomas Matheson, Maryam Modjaz
To cite this version:
Stephane Blondin, Jose L. Prieto, Ferdinando Patat, Peter Challis, Malcolm Hicken, et al.. A Second
Case of Variable Na I D Lines in a Highly-reddened Type Ia Supernova (vol 693, pg 207, 2009).
The Astrophysical Journal, American Astronomical Society, 2017, 844 (1), pp.88 - 88.
�10.3847/1538-4357/aa7e25�. �hal-01678527�
1. No Variable Na I D Lines in SN
1999cl
The large variation in the Na I D equivalent width
(EW) observed in the Type Ia SN1999cl (Blondin et al.
2009
),
EW
1.66
0.21
D
=
Å, results in fact from a measurement error. The origin of this error was traced back to the observed
wavelength shifts of the Na I D pro
file with respect to its expected rest-frame location (5889.95 and 5895.92 Å for the D
2and D
1lines, respectively
), which were not properly taken into account in a revised implementation of our EW computation (albeit they were
correctly displayed on the graphical interface developed for these measurements; see Figure
1
). We revised all the measurements in
the original paper, and can con
firm that SN1999cl is the only object of our sample affected by this error (see Figure
2
). In particular,
measurements for SN
2006X are not affected when properly taking into account these wavelength shifts (see the open squares in
Figure
2
). Since our measurement routines were validated based on SN2006X, for which high-resolution VLT+UVES data were
available
(Patat et al.
2007
), and for which our own EW determinations on lower-resolution FLWO 1.5 m+FAST data yielded
consistent results, this error went unnoticed.
SN
1999cl displays the largest wavelength shifts of the Na I D profile of all the SNeIa in our sample, with typical shifts of
approximately
−6 Å, corresponding to a ∼300 kms
−1velocity blueshift with respect to its expected rest-frame location. This
velocity shift corresponds to the difference between the recession velocity of the host-galaxy nucleus
(2338 kms
−1for NGC 4501;
Falco et al.
1999
), which we used to de-redshift the SN1999cl spectra, and that derived at the location of SN1999cl from emission
lines in the SN spectrum used for classi
fication purposes by Garnavich et al. (
1999
), namely cz = 2030 kms
−1. The shift results
from the location of SN
1999cl in a spiral arm with a blueshifted velocity along the line of sight, as derived from kinematic maps of
NGC 4501 based on H I emission by Chemin et al.
(
2006
). We note that Garnavich et al. (
1999
) had in fact correctly reported a
Na I D EW of 0.33 nm for their
first spectrum of SN1999cl, consistent with our revised measurement on the same spectrum.
All the other objects in our sample display signi
ficantly lower wavelength shifts of the Na I D profile ( 4
Å in absolute value; see
Figure
2
). We have not investigated the exact nature of the observed wavelength shifts for all the objects in our sample, but simply
note that absolute shifts at the
Å level do not appear to affect our revised EW measurements, with an rms difference compared to
4
our original measurements of only
∼0.13 Å.
Our new measurements show that the EW variation for the Na I D pro
file in SN1999cl is significantly lower than that reported in
our original paper
(0.43±0.14 Å cf. 1.66±0.21 Å). While the EW variation remains statistically significant (3.1σ different from
zero
), it is now below the detection threshold of 0.5 Å derived from the Monte Carlo simulations published in the original paper
(these simulations are unaffected by the aforementioned measurement error). We also note that the S/N cut based on these same MC
simulations
(S N
50
per pixel
) was erroneously applied based on the S/N per Å instead of per dispersion element (typically
∼1.5 Å per pixel), resulting in the exclusion of spectra with 50
S N per pixel
50
´
1.5
=
75
. Our revised measurements thus
typically include more spectra for a given SN than in the original paper
(see Table
1
).
As a result, SN
1999cl should no longer be considered an object displaying variable Na I D lines in our study. The fraction of
SNe
Ia in our sample displaying Na I D lines thus goes from ∼6% (2/31) in the original study to ∼3% (1/31) in the revised analysis,
SN
2006X being the only SNIa in our sample with variable Na I D lines.
The main conclusion of our paper remains unchanged. Quoting from the conclusions section in the original paper:
“We conclude
that either variable Na I D features are not a common property of SNe
Ia, or that the level of the variation is less on average than
observed in SN 2006X.
” However, the title of our paper highlighted the new detection of “variable Na I D lines in a highly-reddened
Type Ia supernova
” (i.e., SN1999cl), which no longer holds.
We are indebted to Lingzhi Wang, who is currently a research scholar at the Chinese Academy of Sciences South America Center
for Astronomy in Santiago, Chile, for having brought this measurement error to our attention during the conference
“Supernovae
through the ages
” held on Easter Island, Chile, during 2016 August.
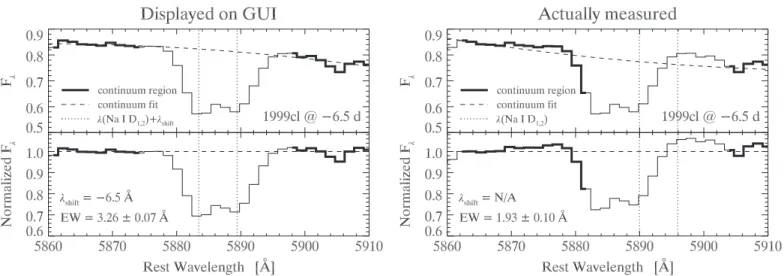
Figure 1.Impact of the observed wavelength shift of the Na I D profile on the EW measurement, illustrated using the SN1999cl spectrum at −6.5 d from maximum light. The left panel reproduces what was displayed on the graphical interface used to determine the continuum-fit regions on either side of the Na I D profile (thick black lines), with the rest-wavelength locations of the D2and D1lines shifted bylshift= -6.5Å (dotted lines) with respect to their true locations (5889.95 and 5895.92Å, respectively). Division by the continuum fit (dashed line) yields a normalized profile (lower panel) appropriate for computing the profile EW, which is here determined to be 3.26±0.07 Å. However, in our revised implementation of the EW computation, the wavelength ranges of the continuum-fit regions were passed to a separate function where the wavelength shift was accidentally ignored(i.e.,lshift= ). Since the continuum wavelength ranges were determined with respect to the0 rest-wavelength locations of the D2and D1lines, this resulted in an erroneous continuumfit and a subsequent underestimate of the true EW (1.93±0.10 Å instead of
3.26±0.07 Å). SN1999cl is the only object affected by this analysis error, which thus went unnoticed in our various validation tests based on SN2006X.
Figure 2. Left: difference between our revised (EWnew) and original (EWold) Na I D EW measurements vs. our original measurements. Only SN1999cl is systematically and largely affected(open stars), with typical differences in excess of 0.5 Å at the 3σ level. Excluding SN1999cl, the rms of all other residuals is only ∼0.13 Å. The rms residual for SN2006X is even lower, at ∼0.07 Å (open squares). Right: difference between our revised and original Na I D EW measurements vs. the measured wavelength shift of the Na I D profile (lshift), manually adjusted in 0.5 Å steps. Only SN1999cl (open stars) displays absolute shifts at the 5 Å level, while measurements corresponding to∣lshift∣4Å are not significantly affected (including SN2006X, open squares).
1998dm 0.34(0.05) 0.60-+0.120.12 0.23(0.27) 0.9 0.22 5 +5.8 18.9 1998es 0.07(0.02) 1.57-+0.220.15 0.37(0.24) 1.6 0.36 15 −6.0 36.4 1999cl 1.20(0.07) 3.52 0.260.17 -+ 0.43(0.14) 3.1 2.07 9 −7.5 15.8 1999dq 0.12(0.03) 1.19-+0.130.17 0.30(0.22) 1.4 0.45 15 −9.6 39.3 2001V 0.03(0.02) 1.44-+0.280.26 0.54(0.28) 2.0 0.72 14 −9.3 33.4 2001en 0.07(0.04) 1.12 0.110.16 -+ 0.27(0.31) 0.9 0.35 4 +2.7 8.7 2001ep 0.14(0.04) 0.74-+0.210.11 0.32(0.27) 1.2 0.36 10 −2.7 10.8 2002bo 0.47(0.04) 2.61-+0.220.27 0.49(0.20) 2.4 1.09 21 −7.0 36.7 2002cr 0.09(0.04) 0.38 0.150.16 -+ 0.30(0.22) 1.4 0.48 4 −7.4 12.8 2002fk 0.03(0.02) 0.12-+0.130.14 0.28(0.23) 1.2 0.87 7 −0.6 31.6 2003cg 1.06(0.03) 5.54-+0.290.27 0.56(0.26) 2.2 0.97 11 −5.6 15.9 2003du 0.01(0.01) 0.10 0.220.17 -+ 0.39(0.22) 1.8 0.77 12 −9.7 38.8 2003kf 0.04(0.03) 0.52-+0.250.16 0.41(0.20) 2.0 0.38 14 −7.3 48.4 2005am 0.03(0.02) 0.16-+0.220.14 0.37(0.21) 1.7 0.60 7 +0.4 8.9 2005cf 0.10(0.04) 0.17 0.180.35 -+ 0.53(0.28) 1.9 1.03 23 −11.8 41.7 2006N 0.03(0.02) 0.68-+0.310.33 0.65(0.28) 2.3 1.21 7 −2.8 11.8 2006X 1.47(0.04) 1.92-+0.410.36 0.78(0.17) 4.5 3.68 18 +1.7 58.5 2007S 0.41(0.03) 1.92 0.250.34 -+ 0.59(0.25) 2.3 1.20 6 −4.7 29.6 2007af 0.14(0.03) 0.45-+0.190.21 0.40(0.20) 1.9 0.86 24 −4.7 97.2 2007bm 0.52(0.04) 2.28-+0.260.14 0.40(0.16) 2.5 1.34 6 −9.3 29.8 2007ca 0.30(0.04) 1.92 0.100.12 -+ 0.22(0.31) 0.7 0.16 3 +3.4 9.9
Note.Col.(1): SN name; col.(2): host-galaxy color excess determined from fits to multi-band optical light curves using the MLCS2k2 code of Jha et al. (2007);
col.(3): weighted mean EW. The upper and lower limits correspond to the maximum deviations from the weighted mean; col.(4): maximum EW difference. The 1s error appears in between parentheses; col.(5): EWD divided by its1s error; col.(6):c per degree of freedom for a constant EW2 fit; col.(7): number of degrees of freedom(simply the number of data points minus one); col.(8): age (in days from B-band maximum light) of the earliest spectrum; col.(9): age range (in days) of the spectra used in thefit.
Figure 4.[Figure 3 in Blondin et al. (2009)]. Left: time-evolution of the equivalent width of the Na I D doublet for the three most highly-reddened SNeIa in our
sample: SNe2003cg (filled triangles), 1999cl (filled squares), and 2006X (filled circles). Only SN2006X exhibits clear variable Na I D EWs, while those of SN1999cl and SN2003cg remain largely constant over time. The larger filled circles at −2 d and +14 d correspond to EW measurements on high-resolution (FWHM» kms7 −1, or∼0.14 Å, at Na I D) VLT+UVES spectra of SN2006X published by Patat et al. (2007). Right: normalized Na I D profiles for SN2003cg
(top), SN1999cl (middle), and SN2006X (bottom), plotted in rest-frame wavelength corrected for the shift in wavelength of the Na I D doublet,lshift, whose value is indicated for each profile. The black and red lines correspond to the smallest and largest EWs, respectively. Note the difference in ordinate range, decreasing from top to bottom. The vertical dotted lines indicate the wavelength positions of the individual D2and D1lines.
Figure 3.[Figure 2 in Blondin et al. (2009)]. EW measurement error as a function of S/N for three FWHM resolutions. The dashed-dotted curve corresponds to the
resolution of our data set(FWHM»6Å). The ordinate axis on the right indicates the corresponding 3σ error on the difference between EW measurements. The horizontal dashed line corresponds to a minimum detectable EW difference of 0.5Å.
Figure 5.[Figure 4 in Blondin et al. (2009)]. One minus the difference between the normalized Na I D profiles with the smallest and largest EWs, respectively, for
SN1999cl (top) and SN2006X (bottom). The wavelengths have been corrected for the shift in wavelength of the Na I D doublet,lshift(see Figure4). The red line in the lower panel corresponds to the variation for SN2006X inferred by degrading the resolution of the high-resolution spectra published by Patat et al. (2007). The
vertical dotted lines indicate the rest-wavelength positions of the individual D2and D1lines. The horizontal line in the upper panel shows the size of one spectral
resolution element(FWHM»6Å).
Figure 6.[Figure 5 in Blondin et al. (2009)]. Host-galaxy color excess vs. equivalent width of the Na I D doublet for the 31 SNeIa in our sample. The error bar for
EW(Na I D) corresponds to the full range of the observed variation. Also shown are the empirical relations of Barbon et al. (1990) and Turatto et al. (2003), which
References
Barbon, R., Benetti, S., Rosino, L., Cappellaro, E., & Turatto, M. 1990, A&A,
237, 79
Blondin, S., Prieto, J. L., Patat, F., et al. 2009,ApJ,693, 207
Chemin, L., Balkowski, C., Cayatte, V., et al. 2006, MNRAS, 366, 812
Falco, E. E., Kurtz, M. J., Geller, M. J., et al. 1999, PASP, 111, 438
Garnavich, P., Jha, S., Kirshner, R., Challis, P., & Szentgyorgyi, A. 1999, IAU Circ.,7198
Jha, S., Riess, A. G., & Kirshner, R. P. 2007,ApJ,659, 122
Patat, F., Chandra, P., Chevalier, R., et al. 2007,Sci,317, 924
Turatto, M., Benetti, S., & Cappellaro, E. 2003, in Proc. ESO Astrophysics Symp., From Twilight to Highlight: The Physics of Supernovae, ed. W. Hillebrandt & B. Leibundgut(Berlin: Springer),200
![Figure 4. [ Figure 3 in Blondin et al. ( 2009 )] . Left: time-evolution of the equivalent width of the Na I D doublet for the three most highly-reddened SNe Ia in our sample: SNe 2003cg (fi lled triangles ) , 1999cl (fi lled squares ) , and 2006X (fi lled](https://thumb-eu.123doks.com/thumbv2/123doknet/14783614.597746/5.918.243.675.76.370/figure-figure-blondin-evolution-equivalent-doublet-reddened-triangles.webp)
![Figure 6. [ Figure 5 in Blondin et al. ( 2009 )] . Host-galaxy color excess vs. equivalent width of the Na I D doublet for the 31 SNe Ia in our sample](https://thumb-eu.123doks.com/thumbv2/123doknet/14783614.597746/6.918.169.758.503.903/figure-figure-blondin-galaxy-excess-equivalent-doublet-sample.webp)