HAL Id: hal-00301430
https://hal.archives-ouvertes.fr/hal-00301430
Submitted on 17 Sep 2004HAL is a multi-disciplinary open access
archive for the deposit and dissemination of sci-entific research documents, whether they are pub-lished or not. The documents may come from teaching and research institutions in France or abroad, or from public or private research centers.
L’archive ouverte pluridisciplinaire HAL, est destinée au dépôt et à la diffusion de documents scientifiques de niveau recherche, publiés ou non, émanant des établissements d’enseignement et de recherche français ou étrangers, des laboratoires publics ou privés.
Initial steps of aerosol growth
O. Kulmala, L. Laakso, K. E. J. Lehtinen, I. Riipinen, M. Dal Maso, T.
Anttila, V.-M. Kerminen, U. Hõrrak, M. Vana, H. Tammet
To cite this version:
O. Kulmala, L. Laakso, K. E. J. Lehtinen, I. Riipinen, M. Dal Maso, et al.. Initial steps of aerosol growth. Atmospheric Chemistry and Physics Discussions, European Geosciences Union, 2004, 4 (5), pp.5433-5454. �hal-00301430�
ACPD
4, 5433–5454, 2004 Initial steps of aerosol growth M. Kulmala et al. Title Page Abstract Introduction Conclusions References Tables Figures J I J I Back CloseFull Screen / Esc
Print Version Interactive Discussion
© EGU 2004
Atmos. Chem. Phys. Discuss., 4, 5433–5454, 2004 www.atmos-chem-phys.org/acpd/4/5433/
SRef-ID: 1680-7375/acpd/2004-4-5433 © European Geosciences Union 2004
Atmospheric Chemistry and Physics Discussions
Initial steps of aerosol growth
M. Kulmala1, L. Laakso1, K. E. J. Lehtinen1, I. Riipinen1, M. Dal Maso1, T. Anttila1, 2, V.-M. Kerminen2, U. H ˜orrak1, 3, M. Vana1, 3, and H. Tammet3
1
Department of Physical Sciences, Division of Atmospheric Sciences, P.O. Box 64, FIN-00014 University of Helsinki, Finland
2
Finnish Meteorological Institute, Air Quality Research, Sahaajankatu 22E, FIN-00880 Helsinki, Finland
3
Institute of Environmental Physics, University of Tartu, ¨Ulikooli 18, 50090 Tartu, Estonia Received: 25 May 2004 – Accepted: 22 June 2004 – Published: 17 September 2004 Correspondence to: L. Laakso ([email protected])
ACPD
4, 5433–5454, 2004 Initial steps of aerosol growth M. Kulmala et al. Title Page Abstract Introduction Conclusions References Tables Figures J I J I Back CloseFull Screen / Esc
Print Version Interactive Discussion
© EGU 2004
Abstract
The formation and growth of atmospheric aerosols depend on several steps, namely nucleation, initial steps of growth and subsequent – mainly condensational – growth. This work focuses on the initial steps of growth, meaning the growth right after nucle-ation, where the interplay of curvature effects and thermodynamics has a significant
5
role on the growth kinetics. More specifically, we investigate how ion clusters and aerosol particles grow from 1.5 nm to 20 nm in atmospheric conditions using experi-mental data obtained by air ion and aerosol spectrometers. The measurements have been performed at a boreal forest site in Finland. The observed trend that the growth rate seems to increase as a function of size can be used to investigate possible growth
10
mechanisms. Such a growth rate is consistent with a recently suggested nano-K ¨ohler mechanism, in which growth is activated at a certain size with respect to condensation of organic vapors. The results also imply that charge-enhance growth associated with ion-mediated nucleation plays only a minor role in the initial steps of growth, since it would imply a clear decrease of the growth rate with size. Finally, further evidence was
15
obtained on the earlier suggestion that atmospheric nucleation and the subsequent growth of fresh nuclei are likely to be uncoupled phenomena via different participating vapors.
1. Introduction
Formation and subsequent growth of atmospheric aerosol have recently been an active
20
research topic (Kulmala et al., 2004a). Aerosol particles are ubiquitous in the Earth’s atmosphere and influence our quality of life in many different ways. In urban environ-ments, aerosol particles can affect human health through their inhalation (Wichmann and Peters, 2000; Stieb et al., 2002). In the global troposphere aerosol particles are thought to contribute to climate change patterns (Stott et al., 2000; Ramanathan et al.,
25
ACPD
4, 5433–5454, 2004 Initial steps of aerosol growth M. Kulmala et al. Title Page Abstract Introduction Conclusions References Tables Figures J I J I Back CloseFull Screen / Esc
Print Version Interactive Discussion
© EGU 2004
detailed information on how aerosol particles enter the atmosphere and how they are transformed before being removed by dry or wet deposition. Key processes in this re-spect are the formation of new atmospheric particles and their subsequent growth to larger sizes.
Aitken (1897) was the first to report evidence for new particle formation in the
at-5
mosphere. Misaki (1964) observed the process of the evolution of mobility distribu-tion of air ions (in a diameter range of 14–100 nm): a gradual shift of a spectral peak toward larger sizes up to about 40 nm after the nucleation burst in the New Mexico semidesert. However, quantitative measurements of aerosol formation and growth rates have required the recent developments in instrumentation for measuring size
10
distributions down to sizes as small as 3 nm in diameter (McMurry, 2000). On the other hand these sizes are not small enough in order to be able to study nucleation processes, since the phase change between vapour and liquid will occur typically at around 1 nm in diameter. Recently Kulmala et al. (2000a) have suggested that in at-mospheric conditions, nucleation and growth may be de-coupled i.e. different vapours
15
are responsible for nucleation and condensational growth.
In most studies (see e.g. Kulmala et al., 2004a and references therein) the aerosol size distributions as well as formation and subsequent growth of nucleation mode aerosols have been observed using DMPS/SMPS+CPC systems, which have cut off sizes of (at least) 3 nm. Hence these studies are not suitable for detection of
nucle-20
ation and initial steps of the particle growth. On the other hand, using ion spectrom-eters the sizes below 3 nm can be observed (see e.g. H ˜orrak et al., 1998). The ion spectrometers reveal the mobility spectrum, and thus also indirectly the size distribu-tion, of atmospheric ions. In this paper we report the first field experiments where ion spectrometers (two of them) have been used together with DMPS+CPC to study
for-25
mation and growth of aerosol particles focusing particularly on the initial steps of the growth. The observed data has been used to analyze four different hypotheses how atmospheric particles grow after nucleation. Our analysis is based on more than 20 aerosol formation events observed during the QUEST 2 campaign in Hyyti ¨al ¨a, Finland
ACPD
4, 5433–5454, 2004 Initial steps of aerosol growth M. Kulmala et al. Title Page Abstract Introduction Conclusions References Tables Figures J I J I Back CloseFull Screen / Esc
Print Version Interactive Discussion
© EGU 2004
in spring 2003 (15 March–10 April).
2. Growth hypotheses and theoretical background
The formation of aerosol in the atmosphere can be kinetically limited by some of the intermediate steps of its formation processes. The equilibrium state is thus not nec-essarily the aerosol itself but can be, for example, thermodynamically stable clusters
5
(TSC), as was recently proposed by Kulmala et al. (2000a). Although there are strong indications that the water-sulphuric acid-ammonia nucleation mechanism (Korhonen et al., 1999) explains the formation of new atmospheric aerosols (diameter <3 nm) in many circumstances, atmospheric concentrations of these vapours are usually not sufficiently large to explain the observed growth rates of the particles (Kulmala et al.,
10
2004a). Thus, in most atmospheric conditions nucleation and growth are probably de-coupled (Kulmala et al., 2000a), such that other vapors like organic ones are needed (Boy et al., 2003; Kulmala et al., 2004a, b).
It is the competition of growth and scavenging that determines the actual production rate of new observable particles (above 3 nm), regardless of the nucleation mechanism
15
(Kerminen et al., 2004a). Furthermore, the production rate of 3 nm particles is very sensitive to both the growth rate (as a function of size) as well as the size distribution of background aerosol particles (Kerminen et al., submitted, 2004b1). Therefore knowing the mechanism how initial steps of growth will occur is a crucial piece of information in any study of new particle formation.
20
In principle, the initial steps of growth can occur via several ways: 1. Condensation of nucleating vapours
1
Kerminen, V.-M., Anttila, T., Lehtinen, K. E. J., and Kulmala, M.: Parameterization for atmo-spheric new-particle formation: application to a system involving sulfuric acid and condensable water-soluble organic vapors, Aerosol Science & Technology, submitted, 2004b.
ACPD
4, 5433–5454, 2004 Initial steps of aerosol growth M. Kulmala et al. Title Page Abstract Introduction Conclusions References Tables Figures J I J I Back CloseFull Screen / Esc
Print Version Interactive Discussion
© EGU 2004
2. Activation of soluble vapours (Multicomponent Nano-K ¨ohler theory, see Kulmala et al., 2004b)
3. Heterogeneous Nucleation
4. Ion-mediated particle formation (or ion-induced nucleation with charge-enhanced condensation)
5
5. Self-coagulation
6. Multi-phase chemical reactions
The first, fourth and fifth mechanism do not require any help from vapours other than those participating in the nucleation process, whereas the other mechanisms need some additional vapors (or gases) to participate in the growth process.
10
Growth by nucleating vapours
After homogeneous nucleation, the freshly nucleated stable clusters will grow hav-ing the nucleated vapours as the drivhav-ing substances. The condensation of nucleat-ing vapours can be presented usnucleat-ing the Kelvin equation (see e.g. Friedlander, 1977). There the driving force is the difference between vapor pressure at the critical
condi-15
tions of nucleation (corresponding to the vapor pressure at critical cluster size) and at actual size of the growing cluster (which is lower due to the weakening Kelvin effect with size). In this case the growth will increase very rapidly and then stay relatively constant, since the Kelvin effect is very sensitive to cluster (or particle) size. This is the dominating particle formation mechanism in many chamber studies and in nucleation
20
experiments.
Ion-mediated particle formation
The presence of ions – and electric charge on particles – will enhance the growth rates of very small (nanometer size) aerosol particles and air ions (Yu and Turco, 2000;
ACPD
4, 5433–5454, 2004 Initial steps of aerosol growth M. Kulmala et al. Title Page Abstract Introduction Conclusions References Tables Figures J I J I Back CloseFull Screen / Esc
Print Version Interactive Discussion
© EGU 2004
Laakso et al., 2003; Nadykto and Yu, 2003; Lushnikov and Kulmala, 2004). The con-densing vapours may exhibit dipole nature and can thus be electrostatically attracted by charged particles. This effect decreases very rapidly with increasing size. If this mech-anism dominates the initial steps of the growth of freshly nucleated particles, there should be a decreasing trend in growth rate as a function of particle size. Although the
5
enhancement factor is somewhat different according to different theories, all of them exhibit a strong size dependence.
Growth by self-coagulation
Self-coagulation, which means coagulation between particles belonging to a same mode, increases the mean size of this mode in all conditions. We may calculate that
10
for a population of sub-5-nm particles, a total number concentration of around 0.2– 1×106cm−3 is needed to induce a growth rate of 1 nm h−1. This calculation includes Brownian self-coagulation within the particle population as well as various inter-particle forces such as van der Waals interactions and charge-image charge effects. Since the concentrations of sub-5-nm particles/clusters in our boreal forest conditions is typically
15
around or below 105cm−3, we may conclude that self-coagulation gives only a minor contribution to the initial growth of the particle/cluster population.
Growth by other vapours
Besides those vapours that nucleate, some other vapours can also participate in the growth process. In principle, soluble vapors can participate in the growth after
activa-20
tion and insoluble vapors after heterogeneous nucleation. After these initial steps, mul-ticomponent condensation of organic and inorganic vapours will continue the growth.
Also very non-volatile gases might participate in the growth after chemical surface reactions have grown clusters to sufficiently large sizes.
The critical mechanism for soluble organic vapors is the activation of the nucleus
25
ACPD
4, 5433–5454, 2004 Initial steps of aerosol growth M. Kulmala et al. Title Page Abstract Introduction Conclusions References Tables Figures J I J I Back CloseFull Screen / Esc
Print Version Interactive Discussion
© EGU 2004
droplets (K ¨ohler theory; e.g. Kulmala et al., 1997). The nano-K ¨ohler mechanism is a similar phenomenon as K ¨ohler activation for cloud droplet formation, however, then the activating nucleus is a nanometer-size ammonium sulfate cluster instead of a CCN of a much larger size and the vapor is organic instead of water (see Kulmala et al., 2004b; Anttila et al., 2004).
5
If the organic vapor is insoluble into pre-existing clusters, it needs to overcome an energy barrier before the real condensation can occur. This heterogeneous nucleation process is energetically more probable than homogeneous nucleation but less proba-ble than activation (Petersen et al., 2001; Kulmala et al., 2000b). If the particles would be “activated” with the heterogeneous nucleation process, followed by condensational
10
growth, the observed growth rates as a function of size would lie between those cor-responding to condensation of nucleating vapours and those following nano-K ¨ohler theory.
Multi-phase chemical reactions
An increasing piece of evidence have emerged on the important role of various
multi-15
phase reactions in secondary organic aerosol formation (Jang et al., 2002; Inuma et al., 2004; Kalberer et al., 2004; Tolocka et al., 2004). These reactions may occur on aerosol surfaces or inside the aerosol phase and they seem to be favoured by an acidic environment. Zhang and Wexler (2002) suggested that chemical surface reactions might explain a significant part of the very initial growth of new atmospheric nuclei. In
20
lack of a proper mechanistic understanding on this phenomenon, however, we cannot estimate how much multi-phase reactions might contribute to the nuclei growth and what would be the exact size dependency of this growth mechanisms.
In the case of surface reactions the growth would be independent of size (Friedlan-der, 1977). However, this mechanism may grow clusters to sizes in which they activate
25
with respect to water-soluble organic vapour(s), thereby leading to a size-dependent growth.
ACPD
4, 5433–5454, 2004 Initial steps of aerosol growth M. Kulmala et al. Title Page Abstract Introduction Conclusions References Tables Figures J I J I Back CloseFull Screen / Esc
Print Version Interactive Discussion
© EGU 2004
3. Materials and methods
The measurements have been performed at the SMEAR II station in Hyyti ¨al ¨a, south-ern Finland, where typically 50–60 particle formation events are observed annually (Kulmala et al., 2001). The instruments used to measuring the particle size distribution include a differential mobility particle sizer and two different types of ion spectrometers.
5
Submicron particle size distributions are determined using a Differential Mobility Par-ticle Sizer (DMPS)(Aalto et al., 2001). The measurements are continuous, and the smallest detectable particle size is 3 nm. The DMPS consists of a DMA (Differential Mobility Analyser) and a CNC (Condensation Nucleus Counter). It classifies particles into size classes depending on the electrical mobility of the particles. The different
10
classes are separated by changing the voltage difference inside the DMA. The size distribution of the sampled aerosol population is then determined in the CNC, which counts the number concentration of every size class. Two DMPS systems are located in the cottage: the first one classifies particles from 3 to 10 nm and the second from 10 nm to 500 nm. Both systems use a Hauke-type DMA (Winklmayr et al., 1991) and
15
a closed loop sheath flow arrangement (Jokinen and M ¨akel ¨a, 1997). The height of the DMA in the first system is 10.9 cm and that of the DMA in the second 28 cm. Before the size characterisation, the incoming aerosol is neutralised with a 2 mCi Krypton-85 beta source. The CNC:s used are TSI Model 3025 and TSI Model 3010 in the first and second systems, respectively. The DMPS measurement period is ten minutes.
20
The Balanced Scanning Mobility Analyzer (BSMA) manufactured by Airel Ltd., Esto-nia, consists of two plain aspiration-type differential mobility analyzers, one for positive and the other for negative ions. The two aspiration condensers are connected as a balanced bridge circuit that allows a continuous variation of the driving voltage and scanning of the mobility distribution of charged clusters and nanoparticles called air
25
ions. A large-air flow rate of 44 liters per second helps to suppress the loss of air ions in the inlet of the instrument. The inlet can be closed or opened for ions using a controlled electrostatic filter and the background signal is eliminated making every
ACPD
4, 5433–5454, 2004 Initial steps of aerosol growth M. Kulmala et al. Title Page Abstract Introduction Conclusions References Tables Figures J I J I Back CloseFull Screen / Esc
Print Version Interactive Discussion
© EGU 2004
second scan with closed inlet. A mobility distribution is calculated according to the results of nine scans performed during three minutes. The electric mobility range of 0.032–3.2 cm2V−1cm−1is divided into 16 logarithmically uniform fractions. The mobil-ity distribution is converted into the size distribution using a specific algorithm (Tammet, 1995). The size distribution is presented by 12 fractions that are distributed
logarithmi-5
cally uniformly over the diameter range 0.4–6.3 nm.
The Air Ion Spectrometer (AIS, manufactured by AIREL Ltd, Estonia) is measuring the mobility distribution of air ions (naturally charged clusters and aerosol particles) in the range of 0.00075–2.4 cm2V−1s−1. The spectrometer consists of two identical cylin-drical aspiration-type differential mobility analyzers, one for measuring positive ions and
10
the other second for measuring negative ions. Each mobility analyzer has 21 collec-tor electrodes provided with individual electrometrical amplifiers for the measuring of electrical current carried by ions of different mobilities. The simultaneous measure-ments enable to record the air ion mobility distribution, which is showing considerable variation in ion concentration and evolution in time.
15
In AIS the air sample containing ions (flow rate is 500 cm3s−1) is sucked into the mo-bility analyzer through the electronically controlled electrostatic filter (switched on/off). The measurements with closed inlet for ions are used for the verification of the offset level and noise of electrometrical amplifiers. Both the mobility analyzers have a closed loop of clean sheath air. The unipolar charging of aerosol particles in corona
charg-20
ers and subsequent removal of charged particles by electrostatic filtration is used to create clean sheath airflow of 1000 cm3s−1. The mean mobility distributions of pos-itive and negative air ions and distribution uncertainties are calculated averaging the results of 20 measurements recorded during 5-min period. The mobility distribution of ions is presented by 28 logarithmically uniformly distributed fractions: 12 fractions in
25
the mobility range of 0.075–2.4 cm2V−1s−1 and 16 fractions (two fractions per elec-trometrical channel) in the range of 0.00075–0.075 cm2V−1s−1. The corresponding diameter ranges of single charged particles calculated according to the algorithm by Tammet (1995) are 0.46–4.6 and 4.6–55 nm, respectively.
ACPD
4, 5433–5454, 2004 Initial steps of aerosol growth M. Kulmala et al. Title Page Abstract Introduction Conclusions References Tables Figures J I J I Back CloseFull Screen / Esc
Print Version Interactive Discussion
© EGU 2004
3.1. Results and discussions
In Fig. 1 aerosol and air ion spectra (naturally charged cluster ions and aerosol par-ticles) measured with DMPS and AIS, respectively, are presented. No corresponding air ion spectrum from the BSMA measurements have been included because they are similar to the AIS spectra, except the size-range is different (0.34–7.4 nm). One of the
5
most important features revealed by the ion instruments is that cluster ions (below the size of 1.5 nm) appears always to be present. This seems to be the case both during event and also on non-event days. Therefore we can confidently say that there are always ion clusters present in boreal forests.
In the continuously ionized atmosphere the mobility spectrum of natural small ions
10
presents a mixture of ions of different ages and different chemical composition, evolving via ion-molecule reactions (Mohnen, 1977; Beig and Brasseur, 2000). The composition of cluster ions strongly depends on the age of ions and on the concentration of trace species in the air, as well as on the thermodynamical properties of the clusters and the environment (Bricard et al., 1972; Castleman et al., 1978; Eisele and Tanner, 1990;
15
Nagato and Ogawa, 1998; Parts and Luts, 2004).
One other important observation is that after new particle formation, ion measure-ments exhibit growth patterns (“banana-shaped”) similar to the DMPS measuremeasure-ments. According to a recent overview (Kulmala et al., 2004a), the measured growth rate of nu-cleation mode particles is typically remarkably constant above the size of about 5–8 nm
20
in particle diameter. These measurements, however, have not allowed us to probe the important size regime of around 1 nm, i.e. the regime of the initial steps of growth after nucleation. Thus, it is important to perform the same analysis, if possible, for the ion measurement data to see if this constant growth rate regime extends to even smaller sizes and therefore get hints on the prevailing growth mechanisms.
25
In order to be able to test which hypothesis for the initial step of particle growth is valid, a total of 15 days of particle formation data measured using the three instruments were analyzed. Data for both polarities were used from the ion instruments. The
ACPD
4, 5433–5454, 2004 Initial steps of aerosol growth M. Kulmala et al. Title Page Abstract Introduction Conclusions References Tables Figures J I J I Back CloseFull Screen / Esc
Print Version Interactive Discussion
© EGU 2004
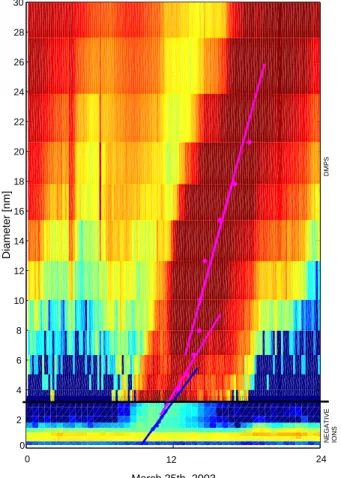
growth rates were estimated by following the evolution of the nucleation mode peak (Lehtinen and Kulmala, 2003). The time evolution of each channel of each device was investigated, and the time when the peak passed the channel was recorded. An example of the results is shown in Fig. 2 for 25 March 2003 in Hyyti ¨al ¨a, Finland. The dots represent the nucleation mode peak location as a function of time, the lines are
5
drawn to ‘guide the eye’ for growth rate determination. For making the comparison with the full size distribution data more convenient, the size spectrum from the BSMA has been combined together with the corresponding spectrum from the DMPS in the same figure. From this figure it is easy to see that the growth of nucleation mode particles observed from the BSMA measurements nicely fits with that from the DMPS
10
measurements. Furthermore, there seems to be a trend of an increasing growth rate as a function of size below about 5 nm in diameter.
However, a comparison between the ion counters and DMPS is not straight forward, since the DMPS assumes an equilibrium charge distribution whereas ion counters measure the natural charging state of the ion clusters. Thus, if the clusters are
over-15
charged due to a contribution of e.g. ion-induced nucleation, the decreasing overcharge as a function of particle size skew the estimated growth rates. In our observations, an excess of charge on negative particles between 3–5 nm was observed (Laakso et al., 2004). However, because the behavior of negative and positive ions were different, this allows us to investigate the effect of that phenomenon on growth rate of particles.
20
The estimated maximum uncertainty used to ion/charging dynamics is the factor of 1.1–1.6. As a summary, the effect of ion-induced nucleation was assumed to decrease the effect of the size dependence of growth rates. However, there was still a clearly increasing trend in growth rates as a function of size. We should note that the effect of overcharging is negligible for sizes bigger than 5–6 nm.
25
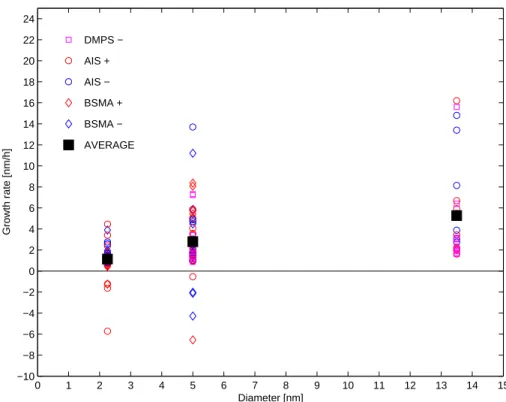
The overall results of the peak evolution analysis are presented in Fig. 3, in which the mean growth rates are highlighted with large black squares. Despite some scatter in the data, the observations suggest that the cluster/particle growth rates increase with an increasing particle size. At least, with confidence, we can claim that the growth
ACPD
4, 5433–5454, 2004 Initial steps of aerosol growth M. Kulmala et al. Title Page Abstract Introduction Conclusions References Tables Figures J I J I Back CloseFull Screen / Esc
Print Version Interactive Discussion
© EGU 2004
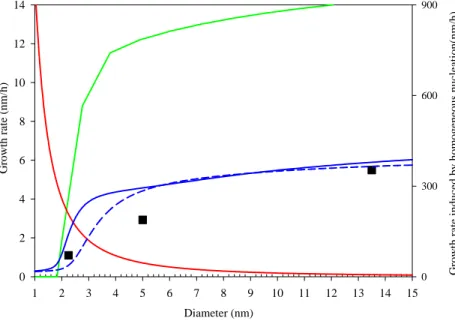
rate does not decrease strongly with size. The exact size dependence of the clus-ter/particle growth rate varies with the dominating growth mechanism, as can be seen from Fig. 4. The curves in this figure have been obtained by detailed aerosol dynamic simulations using the model of Anttila et al. (2004). In addition to the growth by clas-sical sulfuric acid condensation (which has been subtracted from both measured and
5
theoretical growth rates in Fig. 4), the growth of clusters/particles has been assumed to take place by i) condensation of a nucleating organic vapor, ii) multi-component acti-vation of originally inorganic (sulfuric acid, ammonia water) clusters by a water-soluble organic compound, or iii) charge-enhanced sulfuric acid condensation associated with ion-mediated nucleation. Two separate curves for the multi-component activation has
10
been shown, one assuming that the ammonium bisulfate/water/organic mixture be-haves ideally and the other one applying the thermodynamic model developed by Kul-mala et al. (2004b).
Figures 3 and 4 imply strongly that the initial steps of cluster/particle growth can-not be dominated by charge-enhanced condensation of sulfuric acid. This mechanism
15
would induce a rapidly decreasing cluster/particle growth rate as a function of size, being unable to explain the observations. The growth driven by the nucleating va-por would result in the growth rates that are almost two orders of magnitude higher than those observed. In contrast to these, the multi-component activation mechanism predicts growth rates that are in a good agreement with our observations. Taken
to-20
gether, our results suggest strongly that vapors driving the cluster/particle growth in boreal forests are different from those involved in nucleation. Whether these drivers are restricted to low-volatile, water-soluble organic vapors assumed here, or whether a similar growth behavior would be obtained by assuming heterogeneous nucleation or multi-phase chemical reactions involving some other organic vapors, remains an open
25
question.
One noteworthy issue that we have not touched so far in the present investigation is the diurnal cycle of condensing vapor concentrations. Many condensable vapors in the boundary layer are expected to follow the diurnal cycle due to solar radiation.
ACPD
4, 5433–5454, 2004 Initial steps of aerosol growth M. Kulmala et al. Title Page Abstract Introduction Conclusions References Tables Figures J I J I Back CloseFull Screen / Esc
Print Version Interactive Discussion
© EGU 2004
If we assume that the nucleation starts before the concentration of the condensing vapor reaches its maximum, we might experience a similar time-dependent growth rate as revealed in our studies. This time dependence should then also affect the evening and night-time growth of the particles. Previous studies have, however, shown strikingly constant diameter growth rates above ca. 5–8 nm (Kulmala et al., 2004a).
5
In addition, our preliminary analysis on the behavior of oxidation products of terpenes does not support this possibility. Another possible explanation for the observed time (or size) dependence of growth rate is the accumulation of some of the condensable vapours in air, caused by photochemical source dominating over depletion via various sink mechanisms. In any case the Kelvin type behavior causing size dependence on
10
growth rate should be taken into account.
4. Conclusions
We have presented a method how to test different hypotheses for the initial steps of aerosol formation and growth, based on analyzing particle size distributions measured simultaneously by the DMPS and ion mobility techniques. The ion measurements allow
15
us to reach sizes down to 0.5 nm in diameter. This allowed for a study of size ranges in which both ion mediated growth as well as curvature effects (Kelvin effect) may be important.
According to our first results based on analysing the evolution of the particle and air ion size distributions over the course of 15 nucleation event days, the growth rate of
20
clusters/particles appears to increase as a function of their size. This is consistent with the recent hypothesis that organic substances soluble into thermodynamically stable clusters (either ion clusters or neutral clusters) are mainly responsible for the growth of clusters and nanometer-size aerosol particles (Kulmala et al., 2004b; Anttila et al., 2004). A dominance of charge-enhanced particle growth associated with ion-mediated
25
nucleation would result in a sharply decreasing growth rate as a function of the size, which is in a clear contrast to our observations.
ACPD
4, 5433–5454, 2004 Initial steps of aerosol growth M. Kulmala et al. Title Page Abstract Introduction Conclusions References Tables Figures J I J I Back CloseFull Screen / Esc
Print Version Interactive Discussion
© EGU 2004
Another important finding from the measurements was a remarkably steady ion dis-tribution between about 0.5 and 1.5 nm that appears to be present all the time during both event and non-event days. Typically, the concentration of cluster ions is in good correlation with the ion sink caused by aerosol particles. The finding of steady ion clus-ter concentration supports the hypothesis of Kulmala et al. (2000a), according to which
5
there frequently are nanometer-size thermodynamically stable neutral clusters which, at the occurrence of sufficiently large amounts of condensable vapors, may grow into the size range observable by the DMPS and produce the well-reported particle forma-tion and growth event.
Our observations indicate strongly that vapors responsible for the main growth of
10
small clusters/particles are different from those driving the nucleation, at least in the boreal forest conditions. This means the two processes, nucleation and subsequent growth of nucleated clusters, are likely to be uncoupled from each other (see also Kulmala et al., 2000a). The seemingly abundant presence of nanometer-size clus-ters, combined with the less frequent occurrence of new-particle formation and growth
15
events, suggests further that atmospheric new-particle formation may be limited by the initial steps of growth rather than by nucleation. If this turns out to be the case in other environments as well, the processes associated with the initial growth of nucleated clusters need to be included in any large-scale atmospheric model simulating aerosol dynamics.
20
References
Aalto, P., H ¨ameri, K., Becker, E., Weber, R., Salm, J., M ¨akel ¨a, J. M., Hoell, C., O’Dowd, C. D., Karlsson, H., Hansson, H.-C., V ¨akev ¨a, M., Koponen, I. K., Buzorius, G., and Kulmala, M.: Physical characterization of aerosol particles during nucleation events, Tellus, 53 B, 344– 358, 2001.
25
Aitken, J. A.: On some nuclei of cloudy condensation, Trans. Roy. Soc., XXXIX., 1897.
for-ACPD
4, 5433–5454, 2004 Initial steps of aerosol growth M. Kulmala et al. Title Page Abstract Introduction Conclusions References Tables Figures J I J I Back CloseFull Screen / Esc
Print Version Interactive Discussion
© EGU 2004
mation of organic particles in the atmosphere, Atmos. Chem. Phys. Discuss., 3, 6147–6178, 2003.
Beig, G. and Brasseur, G. P.: Model of tropospheric ion composition: A first attempt, J. Geo-phys. Res., 105, 22 671–22 684, 2000.
Boy, M., Rannik, ¨U., Lehtinen, K. E. J., Tavainen, V., Hakola, H., and Kulmala, M.: Nucleation
5
events in the continental boundary layer: Long term statistical analyses of aerosol relevant characteristics, J. Geophys. Res., 108, 4667, doi:10.1029/2003JD003838, 2003.
Bricard, J., Cabane, M., Madelaine, G., and Vigla, D.: Formation and properties of neutral ultrafine particles and small ions conditioned by gaseous impurities of the air, J. Colloid Interface Sci., 39, 42–58, 1972.
10
Castleman Jr., A. W., Holland, P. M., and Keesee, R. G.: The properties of ion clusters and their relationship to heteromolecular nucleation, J. Chem. Phys., 68, 1760–1767, 1978. Eisele, F. L. and Tanner, D. J.: Identification of ions in continental air, J. Geophys. Res., 95,
20 539–20 550, 1990.
Friedlander, S. K.: Smoke, dust and haze – fundamentals of aerosol dynamics, John Wiley and
15
Sons, New York, 1977.
H ˜orrak, U., Salm, J., and Tammet, H.: Bursts of intermediate ions in atmospheric air, J. Geo-phys. Res., 103, 13 909–13 915, 1998.
H ˜orrak, U., Salm, J., and Tammet, H.: Statistical characterisation of air ion mobility spectra at Tahkuse observatory: Classification of air ions, J. Geophys. Res., 105, 9291–9302, 2000.
20
Jang, M., Czoschke, N. M., Lee, S., and Kamens, R. M.: Heterogeneous atmospheric aerosol production by acid-catalysed particle-phase reactions, Science, 298, 814–817, 2002. Jokinen, V. and M ¨akel ¨a, J. M.: Closed loop arrangement with critical orifice for DMA
sheath/excess flow system, J. Aerosol Sci., 28, 643–648, 1997.
Inyma, Y., B ¨oge, O., Gnauk, T., and Hermann, H.: Aerosol-chamber study of the α-pinene/O3
25
reaction: influence of particle acidity on aerosol yields and products, Atmos. Environ., 38, 761–773, 2004.
Kalberer, M., Paulsen, D., Sax, M., Steinbacher, M., Dommen, J., Prevot, A. S. H., Fisseha, R., Weingartner, E., Frankevich, V., Zenobi, R., and Baltensperger, U.: Identification of polymers as major components of atmospheric organic aerosols, Science, 303, 1659–1662, 2004.
30
Kerminen, V.-M., Lehtinen, K. E. J., Anttila, T., and Kulmala, M.: Dynamics of atmospheric nucleation mode particles: a time scale analysis, Tellus, 56B, 135–146, 2004a.
ACPD
4, 5433–5454, 2004 Initial steps of aerosol growth M. Kulmala et al. Title Page Abstract Introduction Conclusions References Tables Figures J I J I Back CloseFull Screen / Esc
Print Version Interactive Discussion
© EGU 2004
Ternary nucleation of H2SO4, NH3 and H2O in the atmosphere, J. Geophys. Res., 104, 26 349–26 353, 1999.
Kulmala, M., Laaksonen, A., Charlson, R. J., and Korhonen, P.: Clouds without supersaturation, Nature, 388, 336–337, 1997.
Kulmala, M., Pirjola, L., and M ¨akel ¨a, J. M.: Stable sulphate clusters as a source of new
atmo-5
spheric particles, Nature, 404, 66–69, 2000a.
Kulmala, M., Vesala, T., and Laaksonen, A.: Physical Chemistry of Aerosol Formation, edited by Spurny, K. R., Aerosol Chemical Processes in the Environment, Lewis Publishers, Boca Raton, 23–46, 2000b.
Kulmala, M., H ¨ameri, K., Aalto, P. P., M ¨akela, J. M., Pirjola, L., Nilsson, E. D., Buzorius, G.,
10
Rannik, ¨U., Dal Maso, M., Seidl, W., Hoffman, T., Janson, R., Hansson, H.-C., Viisanen, Y., Laaksonen, A., and O’Dowd, C. D.: Overview of the international project on biogenic aerosol formation in the boreal forest (BIOFOR), Tellus, 53B, 324–343, 2001.
Kulmala, M.: How Particles Nucleate and Grow, Science, 302, 1000–1001, 2003.
Kulmala, M., Vehkam ¨aki, H., Pet ¨aj ¨a, T., Dal Maso, M., Lauri, A., Kerminen, V.-M., Birmili, W.,
15
and McMurry, P. H.: Formation and growth rates of ultrafine atmospheric particles: A review of observations, J. Aerosol Sci., 35, 143–176, 2004a.
Kulmala, M., Kerminen, V.-M., Anttila, T., Laaksonen, A., and O’Dowd C. D.: Or-ganic aerosol formation via sulphate cluster activation, J. Geophys. Res., 109, D04205, doi:10.1029/2003JD003961, 2004b.
20
Laakso, L., Anttila, T., Lehtinen, K. E. J., Kerminen V.-M., Horrak, U., Paatero, J., Arnold, F., and Kulmala, M.: Kinetic nucleation and ions in boreal particle formation events, Atmos. Chem. Phys. Discuss., 4, 3911–3945, 2004.
Laakso, L., Kulmala, M., and Lehtinen, K. E. J.: The effect of condensation rate enhancement factor on 3-nm particle formation in binary ion-induced and homogeneous nucleation, J.
25
Geophys. Res., 108, doi:10.1029/2003JD003432, 2003.
Lehtinen, K. E. J. and Kulmala, M.: A model for particle formation and growth in the atmosphere with molecular resolution in size, Atmos. Chem. Phys., 3, 251–258, 2003.
Lushnikov, A. and Kulmala, M.: A new flux-matching theory of particle charging, Europhysical journal D, 29, 345–355, doi:10.1140/epjd/e2004-00047-9, 2004.
30
McMurry, P. H.: A review of atmospheric aerosol measurements, Atmos. Environ., 34, 1959– 1999, 2000.
ACPD
4, 5433–5454, 2004 Initial steps of aerosol growth M. Kulmala et al. Title Page Abstract Introduction Conclusions References Tables Figures J I J I Back CloseFull Screen / Esc
Print Version Interactive Discussion
© EGU 2004
indirect effect: Sensitivity to cloud parameterization and aerosol burden, J. Atmos. Sci., 59, 692–713, 2002.
Misaki, M.: Mobility spectrums of large ions in the New Mexico semidesert, J. Geophys. Res., 69, 3309–3318, 1964.
Mohnen, V. A.: Formation, nature and mobility of ions of atmospheric importance, In Electrical
5
Processes in Atmospheres, edited by Dolezalek, H. and Reiter, R., Dr. Dietrich Steinkopff Verlag, Darmstadt, Germany, 1–17, 1977.
Nadytko, A. and Yu, F.: Uptake of neutral polar vapour molecules by charged particles, Enhanc-ment due to dipole-charge interaction, J. Geophys. Res., 108, doi:10.1029/2003JD003664, 2003.
10
Nagato, K. and Ogawa, T.: Evolution of tropospheric ions observed by an ion mobility spec-trometer with a drift tube, J. Geophys. Res., 103, 13 917–13 925, 1998.
Parts, T.-E. and Luts, A.: Observed and simulated effects of certain pollutants on small air ion spectra: I. Positive ions, Atmos. Environ., 38, 1283–1289, 2004.
Petersen, D., Ortner, R., Vrtala, A., Wagner, P. E., Kulmala, M., and Laaksonen, A.:
Soluble-15
insoluble transition in binary heterogeneous nucleation, Phys. Rev. Lett., 87, 225 703, 2001. Ramanathan, V., Crutzen, P. J., Kiehl, J. T., and Rosenfeld, D.: Aerosol, climate, and the
hydrological cycle, Science, 294, 2119–2124, 2001.
Sekiguchi, M., Nakajima, T., Suzuki, K., Kawamoto, K., Higurashi, A., Rosenfeld, D., Sano, I., and Sonoyo, M.: A study of the direct and indirect effects of aerosols
us-20
ing global satellite data sets of aerosol and cloud properties, J. Geophys. Res., 108, doi:10.1029/2002JD003359, 2003.
Stieb, D. M., Judek, S., and Burnett, R. T.: Meta-analysis of time-series studies of air pollution and mortality: Effects of gases and particles and their influence of cause of death, age and season, J. Air & Manag. Assoc., 52, 470–484, 2002.
25
Stott, P. A., Tett, S. F. B., Jones, G. S., Allen, M. R., Mitchell, J. F. B., and Jenkins, G. J.: External control of 20th century temperature by natural and anthropogenic forcings, Science, 290, 2133–2137, 2000.
Tammet, H.: Size and mobility of nanometer particles, clusters and ions, J. Aerosol Sci., 26, 459–475, 1995.
30
Tolocka, M. P., Jang, M., Ginter, J. M., Cox, F. J., Kamens, R. M., and Johnston, M. V.: For-mation of oligomers in secondary organic aerosol, Environ. Sci. Technol., 38, 1428–1434, 2004.
ACPD
4, 5433–5454, 2004 Initial steps of aerosol growth M. Kulmala et al. Title Page Abstract Introduction Conclusions References Tables Figures J I J I Back CloseFull Screen / Esc
Print Version Interactive Discussion
© EGU 2004
Wichmann, H.-H. and Peters, A.: Epidemiological evidence of the effects of ultrafine particle exposure, Phil. Trans. R. Soc. Lond. A., 358, 2751–2769, 2000.
Winklmayr, W., Reischl, G. P., Lindner, A. O., and Berner, A.: A new electromobility spectrome-ter for the measurement of aerosol size distributions in the size range from 1 to 1000 nm, J. Aerosol Sci., 22, 289–296, 1991.
5
Yu, F. and Turco, R. P.: Ultrafine aerosol formation via ion-mediated nucleation, Geophys. Res. Lett., 27, 883–886, 2000.
Yu, S., Saxena, V. K., and Zhao, Z.: A comparison of signals of regional aerosol-induced forcing in eastern China and southeastern United States, Geophys. Res. Lett., 28, 713–716, 2001. Zhang, K. M. and Wexler, A. S.: A hypoteheis for growth of fresh atmospheric nuclei, J.
Geo-10
ACPD
4, 5433–5454, 2004 Initial steps of aerosol growth M. Kulmala et al. Title Page Abstract Introduction Conclusions References Tables Figures J I J I Back CloseFull Screen / Esc
Print Version Interactive Discussion © EGU 2004 91 91.25 91.5 91.75 92 10−10 10−9 10−8 10−7 10−6 Diameter [m] 91 91.25 91.5 91.75 92 10−10 10−9 10−8 10−7 10−6 Diameter [m] dN/dlogDp [1/cm3] 91 91.25 91.5 91.75 92 10−10 10−9 10−8 10−7 10−6 Diameter [m] 10 100 1000 10000
Time [Day of year]
DMPS
AIS (−)
AIS (+)
Fig. 1. Ion and aerosol size distribution spectra for day no. 91 of 2003 in Hyyti ¨al ¨a, Finland. The
topmost figure shows DMPS spectra, two lower figures negative and positive ions measured by AIS, respectively. Note that DMPS detection limit is 3 nm whereas AIS detection limit is 0.5 nm.
ACPD
4, 5433–5454, 2004 Initial steps of aerosol growth M. Kulmala et al. Title Page Abstract Introduction Conclusions References Tables Figures J I J I Back CloseFull Screen / Esc
Print Version Interactive Discussion © EGU 2004 2 4 6 8 10 12 14 16 18 20 22 24 26 28 Diameter [nm] March 25th, 2003 NEGATIVE IONS DMPS 0 30 0 12 24
Fig. 2. An example of growth rates calculated using nucleation mode peak evolution analysis
(Lehtinen and Kulmala, 2003) on 25 March 2003. The ion (measured by BSMA) and aerosol particle size distribution evolution (measured by DMPS) is combined in the figure. The dots represent peak location as a function of time, the lines represent growth rates for different size ranges.
ACPD
4, 5433–5454, 2004 Initial steps of aerosol growth M. Kulmala et al. Title Page Abstract Introduction Conclusions References Tables Figures J I J I Back CloseFull Screen / Esc
Print Version Interactive Discussion © EGU 2004 0 1 2 3 4 5 6 7 8 9 10 11 12 13 14 15 −10 −8 −6 −4 −2 0 2 4 6 8 10 12 14 16 18 20 22 24 AVERAGE BSMA − BSMA + AIS − AIS + DMPS − Diameter [nm] Growth rate [nm/h]
Fig. 3. Growth rates as a function of the cluster/particle size. Separate data points represent
growth rate fittings for different size ranges (1.3–3 nm, 3–7 nm and 7–20 nm), instruments and days. Black squares show the mean value in each size interval. Negative values are due to fluctuations in size distribution because of e.g. advection and changes in charging state of the particles.
ACPD
4, 5433–5454, 2004 Initial steps of aerosol growth M. Kulmala et al. Title Page Abstract Introduction Conclusions References Tables Figures J I J I Back CloseFull Screen / Esc
Print Version Interactive Discussion © EGU 2004 1 2 3 4 5 6 7 8 9 10 11 12 13 14 15 G row th rate induced by h o m o g eneous nucleation(n m /h) 0 300 600 900 0 2 4 6 8 10 12 14 G row th ra te (nm /h) Diameter (nm)
Fig. 4. Growth rates as a function of the cluster/particle size. Symbols indicate the
es-timated mean values of observations shown in Fig. 3. The contribution of the condensing organic vapor to the growth rate was calculated on the basis of detailed thermodynamic cal-culations (blue solid line) and ideal solution assumption (blue dashed line), respectively. In these cases, the organic vapor concentration was set equal to 5×10⁷molecules cm−3 which is close to the estimated average concentration over the considered period (Laakso et al., 2004). Shown are also the calculated growth rate in a case of homogenous nucleation (green line) and charge-enhanced condensational growth (red line). In the latter case, condens-ing vapor was sulfuric acid and the charge enhancement factor was calculated accordcondens-ing to Lushnikov and Kulmala (2004). In all cases, the sulfuric acid concentration was set equal to 5×10⁶molecules cm−3 in agreement with the observations (Laakso et al., 2004). The sat-uration vapor concentration of the condensing organic vapour was assumed to be equal to 1×10⁶molecules cm−3in all cases. Finally, all except the green line belong to the left-hand side axis.