HAL Id: hal-00304872
https://hal.archives-ouvertes.fr/hal-00304872
Submitted on 31 Dec 2005HAL is a multi-disciplinary open access archive for the deposit and dissemination of sci-entific research documents, whether they are pub-lished or not. The documents may come from teaching and research institutions in France or abroad, or from public or private research centers.
L’archive ouverte pluridisciplinaire HAL, est destinée au dépôt et à la diffusion de documents scientifiques de niveau recherche, publiés ou non, émanant des établissements d’enseignement et de recherche français ou étrangers, des laboratoires publics ou privés.
in lowland UK: I. Soil water changes below beech
woodland and grass on chalk sites in Hampshire
J. Roberts, P. Rosier
To cite this version:
J. Roberts, P. Rosier. The impact of broadleaved woodland on water resources in lowland UK: I. Soil water changes below beech woodland and grass on chalk sites in Hampshire. Hydrology and Earth System Sciences Discussions, European Geosciences Union, 2005, 9 (6), pp.596-606. �hal-00304872�
The impact of broadleaved woodland on water resources in
lowland UK:
I. Soil water changes below beech woodland and grass on chalk
sites in Hampshire
John Roberts and Paul Rosier
Centre for Ecology and Hydrology, Wallingford, OX10 8BB, UK Email for corresponding author: jro@ceh.ac.uk
Abstract
The possible effects of broadleaved woodland on recharge to the UK Chalk aquifer have led to a study of evaporation and transpiration from beech woodland (Black Wood) and pasture (Bridgets Farm), growing in shallow soils above chalk in Hampshire. Eddy correlation measurements of energy balance components above both the forest and the grassland enabled calculation of latent heat flux (evaporation and transpiration) as a residual. Comparative measurements of soil water content and soil water potential in 9 m profiles under both forest and grassland found changes in soil water content down to 6 m at both sites; however, the soil water potential measurements showed upward movement of water only above a depth of about 2 m. Below this depth, water continued to drain and the soil water potential measurements showed downward movement of water at both sites, notwithstanding significant negative soil water potentials in the chalk and soil above. Seasonal differences occur in the soil water content profiles under broadleaved woodland and grass. Before the woodland foliage emerges, greater drying beneath the grassland is offset in late spring and early summer by increased drying under the forest. Yet, when the change in soil water profiles is at a maximum, in late summer, the profiles below woodland and grass are very similar. A comparison of soil water balances for Black Wood and Bridgets Farm using changes in soil water contents, local rainfall and evaporation measured by the energy balance approach allowed drainage to be calculated at each site. Although seasonal differences occurred, the difference in cumulative drainage below broadleaved woodland and grass was small.
Keywords: land use, water resources, broadleaved woodland, grass, soil moisture
Introduction
The increase in the area of broadleaved woodland in lowland UK (e.g. Forestry Commission, 2001), in response to a variety of incentives, has brought with it concerns about the effects of broadleaved woodland on water resources (e.g. HMSO, 1996). One area of concern is the Chalk aquifer in southern England; this accounts for nearly 40% of the public water supply from groundwater and provides about 15% of all potable supplies in the country. Any difference in evaporation and/or transpiration between different vegetative covers can have a fundamental impact on direct recharge to both rivers and aquifers.
However, predicting the likely impact of woodland planting on water resources is not straightforward; experimental outputs from comparative water use studies
of broadleaved woodland versus grass have shown conflicting results. Some studies have demonstrated a substantially greater water use by woodland, whilst at least one has shown that little difference occurs.
Harding et al. (1992) examined various aspects of the water use and hydrochemistry of beech and ash woodland growing on chalk at Black Wood in Hampshire. A key conclusion of this work was that the annual water use by the broadleaved woodland was 15% lower than grassland. This result, from a water use model for woodland calibrated with measurements from Black Wood, was surprising given that large differences in evaporation have been observed between coniferous woodland and short vegetation in both high (Newson, 1979) and low (Cooper, 1980) rainfall regions. In addition, other comparisons have shown water
use by broadleaved woodland to be higher than grassland (e.g. Bending and Moffat, 1997; Calder et al., 2000; Finch, 2000; McGowan and Williams, 1980; Williams et al., 1995), although all of these studies were conducted in rather small woodlands or at woodland edges as compared to the Black Wood study site.
A scoping study, commissioned by the Department of Environment (Calder et al., 1997), offered an alternative interpretation of the Black Wood results that led to the conclusion that broadleaved afforestation of grassland at the Black Wood site may well reduce recharge by 38%. This interpretation assumed drainage does not occur from chalk soils when the soil moisture deficit exceeds more than 25 mm. It also required that the water ascribed to drainage (and occurring at significant soil moisture deficits) by Harding et al. (1992) must have been lost as additional rainfall interception and transpiration. This would mean that the annual evaporation loss from Black Wood would have to be substantially increased, i.e. by at least 150 mm in 1989, to account for water not identified as drainage. Furthermore, the alternative interpretation would mean that forest evaporation would exceed that from the grass very substantially which is in complete contrast to the conclusion of Harding et al. (1992).
The Department of the Environment, Transport and the Regions (DETR) commissioned further research from the Institute of Hydrology in August 1998 to resolve the uncertainty about the effect of trees on recharge to the chalk. The principal objective of the work was to establish, beyond any reasonable doubt, the impacts of broadleaved afforestation on recharge to chalk.
A shortcoming of the original Harding et al. (1992) study at Black Wood was the lack of determinations of vertical gradients of soil water potential beneath the forest from which evidence of drainage could be inferred. In addition, there were no other direct measurements of forest or grass evaporation and there were no comparative measurements of soil moisture changes below grass.
In this first of a series of three papers describing a range of approaches to compare water use by broadleaved woodland and grassland, the changes in soil water content and soil water potential measured in deep profiles beneath woodland and grassland are examined. In the second paper, direct measurements of evaporation made using an eddy correlation approach from woodland and grassland are compared. In the final paper, the soil moisture results obtained in the present studies are contrasted with those from other recent studies in lowland UK in which soil water content changes beneath broadleaf woodland and grass have been compared.
Methods
SITES
Two chalk sites were instrumented; a beech (Fagus sylvatica) woodland site in Black Wood, Micheldever, Hampshire (SU542432) and a grassland (perennial ryegrass, Lolium perenne) site, 7 km to the southwest at Bridgets Farm, Martyr Worthy, Winchester, Hampshire (SU519343). Black Wood
The soils at Black Wood are of the Andover series (Jarvis, 1973) and consist of about 5060 cm of silty clay above Upper Chalk. At the interface with the silty clay the chalk is rubbly but, within a few tens of centimetres, it grades into blocky chalk. Observations of the vertical distribution of roots were made in a 4.5 m deep pit excavated in the forest and from soil cores. Tree roots were profuse in the silty clay horizon but entered only a few centimetres into the chalk rubble where they were finely divided. The stand of almost pure beech where the measurements were made was planted in 1950. A large part of the forest compartment (35 ha) is on level ground, at an altitude of 100 m, and has a substantial extent of forest, of similar structure, surrounding it in all directions. The covering on the woodland floor is patchy with about 50% of the area having only leaf litter and the remainder having bluebells (Hyacinthoides non-scripta) in the spring or occasional patches of dogs mercury (Mercurialis perennis).
Bridgets Farm
At the time of the studies reported here, Bridgets Farm was an experimental (arable and dairy) farm tenanted by the Agricultural and Development Advisory Service (ADAS). The field chosen to locate the soil moisture measurements is known, on the farm, as Delaware and it had been in pasture for several years. It is approximately 11 ha in area and has an altitudinal range of 90 to 105 m above sea level. The soils are again of the Andover series (Jarvis, 1973; Moffat, 1985) with the silty clay layer above the Upper Chalk being somewhat shallower (3040 cm deep) than at Black Wood. The uppermost layers of chalk consist predominantly of small chalk nodules and extend to a depth of around 1.5 m where the chalk then becomes consolidated. Grass roots extend only a few centimetres into the loose chalk.
MEASUREMENTS
Rainfall
A 28.5 m high instrument tower was installed in the forest at Black Wood and extended about 6 m above the tallest surrounding trees. An automatic weather station (AWS) was
mounted on the tower and there was also a rain gauge funnel (308 cm2) connected by a polythene tube to a 0.5 mm tip1
rain gauge located at the base of the tower. Data from the AWS and rain gauge were recorded hourly (as averages or totals) on a datalogger (Model CR10, Campbell Scientific Ltd., Shepshed, UK). To augment the above-canopy rainfall measurements, a 0.2 mm tip1 tipping bucket rain gauge was
installed in a large clearing some 500 m away from the tower site. Data from this rain gauge was recorded hourly on a miniature solid state datalogger (Model Tiny Tag Plus, Gemini Dataloggers, Chichester, UK). An AWS had been installed at Bridgets Farm in an enclosure, within a hedgerow, some 500 m from the soil moisture measurement plot for several years and hourly meteorological data including rainfall were available. To augment the farm AWS rainfall measurements, a 0.5 mm tip1 tipping bucket rain
gauge, installed within the soil moisture measurement plot, recorded hourly on a miniature solid state datalogger (Model Tiny Tag Plus, Gemini Dataloggers, Chichester, UK).
In addition to the rainfall measurements available from the two experimental sites data were also available from a rain gauge (reported to the Meteorological Office and the Environment Agency) located between the two sites at East Stratton (SU543396).
Soil water content
Measurements of changes in the soil water content of deep profiles were made with a neutron probe (Model IHII, Didcot Instrument Company, Didcot, Abingdon, UK). The same neutron probe was used on all occasions and readings were always made at Black Wood and Bridgets Farm on the same day. Neutron probe access tubes consisted of thin-walled 45 mm o.d. aluminium tubing inserted as a close fit into vertical holes drilled using a hydraulic rotary drilling rig with air-flush. Readings were taken in each neutron probe access tube every 10 cm from the soil surface down to 120 cm and then every 30 cm to the lowest reading depth in the tube. Measurements were usually made weekly. At Black Wood, data were collected from five access tubes whose depths ranged from 7.8 m to 8.7 m whilst at Bridgets Farm data were collected from six access tubes whose depths ranged from 8.4 m to 9.0 m. At Bridgets Farm, the six neutron probe access tubes were installed in a 7 × 7 m fenced enclosure at the southern edge of Delaware field. During the measurement period the field was grazed periodically by dairy cattle and the height of the grass in the enclosure was maintained at the same height as the grass outside by a battery-powered strimmer. As Delaware field had occasional applications of slurry (which was not applied to the experi-mental enclosure), grass fertiliser was broadcast evenly, at the appropriate application rate, after the grass had been cut.
In March 2000 the depth profile of soil bulk density for all the access tubes at Black Wood and Bridgets Farm was measured with a gamma (137Cs) probe (Model 362A/363A,
Nuclear Enterprises, Reading, UK). These measurements were made immediately after the soil water content was measured with the neutron probe. The bulk density values of the soil, around the access tubes, showed very few places where low soil water content and low bulk density values coincided; this would have indicated the possible presence of an air void in the soil caused by the access tube installation procedure, so it was concluded that all the access tubes had been installed with minimal disturbance.
Soil water potential
The soil/chalk water potential gradients and hence the direction of water fluxes can be determined from the total water potential profiles at any given time. The total water potential profile, therefore, provides a clear indication of when and where upward movement (i.e. evaporation) and downward movement (i.e. drainage) is occurring from the soil/chalk profile. The location in the soil profile of the zero gradient of total water potential defines the zero flux plane (ZFP). Knowledge of the movement of the ZFP in the profile over time enables changes in soil moisture storage to be partitioned into evaporation and drainage which allows the quantification of the annual water balance.
Previous work by Harding et al. (1992) at Black Wood and by Wellings and Bell (1980) at Bridgets Farm had indicated that the potentials to be measured were likely to be well beyond the range of conventional water-filled tensiometers. Therefore, Equitensiometers (Model EQ2, Delta-T Devices, Burwell, Cambs., UK) were chosen to measure soil matric potential over the range of 01 MPa. Profiles of eight equitensiometers were installed at Black Wood and Bridgets Farm in 80 mm diameter vertical holes drilled at 1 m depth intervals from 2 m down to 9 m. The holes were drilled with the drilling rig used to install the neutron probe access tubes. Each hole had all but the bottom metre lined with plastic drainage pipe and chalk slurry was poured down the hole to a depth of approximately 40 to 50 cm from the bottom. Each equitensiometer unit was fitted on to the end of an appropriate length of extension tube and was lowered down its hole and pushed into the slurry. A short length of extension tube remained above ground level and spacers were used to locate the extension tube centrally in the plastic liner of the drilled hole. The open tops of the extension tube and plastic liner were then sealed with silicone compound to prevent moisture entry. Additional equitensiometers were installed at both sites, at depths of 0.8 and 1.6 m in May 1999 and at 0.4 and 1.2 m, in March 2000. These units were placed in inclined holes, which were
only slightly greater in diameter than the equitensiometer and were installed directly into contact with the soil at the bottom of the hole without any chalk slurry being used. The equitensiometers at each site were read manually with a meter at weekly intervals until November 1999 when a 12-channel CR10 datalogger (Campbell Scientific Ltd., Shepshed, UK) was installed at each site to record the hourly data. However, at each site, the equitensiometers at 8 and 9 m depth continued to be measured weekly with the meter. Energy balance measurements at Black Wood and Bridgets Farm
Estimates of evaporation are available from the energy balance measurements made at both Black Wood and Bridgets Farm and a full treatment of the Solent/energy balance approach is given in Roberts et al. (2005). The energy balance measurements made at both Black Wood and Bridgets Farm provide estimates of evaporation from both vegetation types under all conditions. The evaporation losses include transpiration and interception losses from the canopies and also any evaporation contributed by the litter layers and soil of the woodland and pasture respectively.
Results
REGIONAL RAINFALL
The hydrological summaries published by the Centre of Ecology and Hydrology and the British Geological Survey (1998, 1999 and 2000) provide a picture of the regional patterns of rainfall throughout the measurement period (October 1998 to December 2000). In well over half of the months the rainfall exceeded the long-term average and in some months, particularly in the spring and autumn of 2000, considerably so. It is also relevant to note that months with above average rainfall are interspersed evenly with months having below average rainfall. In neither the summer of 1999 nor 2000 was there a sequence of more than two months with below average rainfall.
LOCAL RAINFALL
The monthly rainfall totals for the two sites and for East Stratton are given in Table 1. Most of the measurements from Black Wood came from the tower-mounted rain gauge and any gaps were filled with data from the rain gauge in the clearing nearby. At Bridgets Farm, rainfall data were available from the rain gauge in the soil moisture measurement enclosure and any gaps in this record were filled by data from a rain gauge maintained by ADAS Bridgets. There is a close similarity in the monthly rainfall totals
for Black Wood, Bridgets Farm and East Stratton. The lowest rainfall recorded at all three sites was in June 2000. Differences between sites occurred in May 1999, when there was more rainfall at Bridgets Farm than at Black Wood and East Stratton and in July 1999 when there was more rain recorded at Black Wood than at Bridgets Farm. Both the experimental sites and the East Stratton records show large and similar monthly rainfall totals for October, November and December 2000. The annual totals for East Stratton are consistently lower than those at the experimental sites although this systematic difference is not obvious in individual monthly totals.
Table 1. Monthly rainfall at Black Wood, Bridgets Farm and East Stratton from 25 October 1998 to 31 December 2000
Black Wood Bridgets Farm East Stratton 1998 November 61.5 69.5 59.2 December 86.5 86.7 86.2 Total 148.0 156.2 145.4 1999 January 110.0 121.1 115.2 February 27.5 26.7 29.8 March 37.5 38.5 32.5 April 58.0 60.6 56.9 May 34.0 54.2 27.7 June 85.5 79.7 70.8 July 65.0 23.7 39.4 August 105.5 108.4 116.6 September 123.0 145.6 130.7 October 72.0 67.6 68.9 November 43.0 43.9 41.5 December 120.0 128.1 130.2 Total 881.0 898.3 860.2 2000 January 27.0 27.824.3 February 94.5 85.6 86.6 March 20.5 13.4 18.4 April 174.7 170.7 170.0 May 105.0 92.3 118.1 June 25.5 22.0 24.7 July 54.6 61.854.6 August 45.1 37.2 36.2 September 96.0 96.890.7 October 169.4 146.0 152.4 November 156.0 156.8150.7 December 151.0 163.1 129.1 Total 1119.3 1073.4 1055.8
SOIL MOISTURE TIME SERIES
The comparison of soil moisture changes is made over the maximum recording depth of all five access tubes at Black Wood and six access tubes at Bridgets Farm. Figure 1 shows the fluctuations in the soil profile storage down to 7.8 m from the start of the measurements in October 1998 until December 2000. All changes are referenced to 29 January 1999, the date during the first winter of measurements when the soils at both sites reached their wettest point. Neither this point nor any of the other wet points in subsequent winters is considered as being equivalent to the term field
capacity that is normally applied to non-chalk soils. Additionally, the negative profile water content should not be regarded as being equivalent to soil moisture deficits defined for other soils as reductions in soil water content from the field capacity value.
In each of the three years, the driest point reached below the beech and grass was quite similar but there are some small differences. In 1998 slightly more drying was observed below the grass whilst in 2000 the soil below Black Wood was drier. In 1999 the profiles had dried to the same amount. There are also differences in the rate at which drying occurred under the two land covers. In both 1999 and 2000 the changes in the soil water content were more rapid below the grass in the spring when the trees were leafless. In both summers, by the time the driest soil condition had been reached, the forest had made up for the earlier start by the grass. The rates at which the soils wetted up were also consistent. Initially, in the autumns of both 1999 and 2000, the soils beneath the grass at Bridgets Farm wetted up more rapidly than below the forest. In the winter of 1999/2000 the forest soil then became wetter but, in the following winter, the soils beneath the grass became wetter. Substantially more water was stored in the soil in the late spring and early summer of 1999 and 2000 compared to the winter of 1998/1999, especially so in the forest. In the latter months of the study, the soil water storage at each site exceeded that measured in either of the previous two winters as a result of the high rainfall; on this occasion, the soil beneath the grass at Bridgets Farm held the larger amount of water.
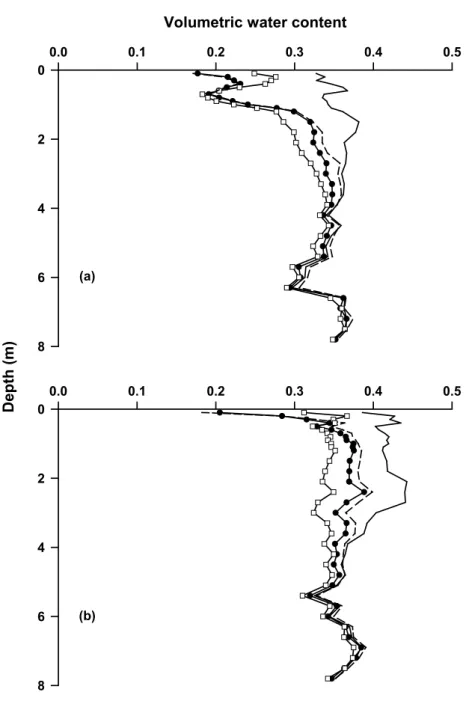
SOIL MOISTURE PROFILES
Figure 2a and b shows, for Black Wood and Bridgets Farm respectively, the profile of soil water content down to 7.8 m measured on 29 January 1999 compared with the driest profiles observed in each subsequent year. The first profile in October 1998, near the beginning of the project, shows some wetting up in the surface horizons but otherwise this is the driest profile observed at either site. Although throughout the profile there is less drying in 1999 and even less in 2000, the depth to which drying occurs is similar. The changes below 56 m are small and not significant.
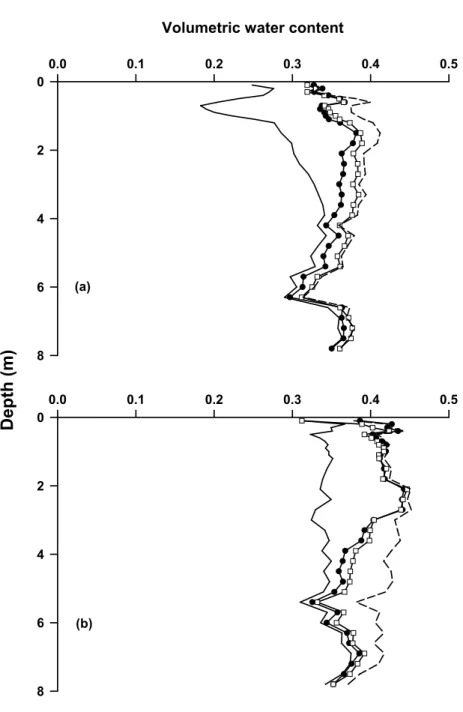
Figure 3a and b shows, for Black Wood and Bridgets Farm respectively, the profile of soil water content down to 7.8 m recorded on 16 October 1998 (the driest profile observed) compared with the three wettest profiles observed in each of the winter periods. In the upper profile at Black Wood, there appears to be additional storage in the two wetter winters (1999/2000 and 2000/2001) than at Bridgets Farm. However, in the wet winter of 2000/2001, substantial
1/10/98 1/2/99 1/6/99 1/10/99 1/2/00 1/6/00 1/10/00 0 20 40 60 80 100 1/10/98 1/2/99 1/6/99 1/10/99 1/2/00 1/6/00 1/10/00 We ekly ra infall ( m m) 0 20 40 60 80 100 1/10/98 1/2/99 1/6/99 1/10/99 1/2/00 1/6/00 1/10/00 Ch ange in profile w a te r content (mm) -400 -300 -200 -100 0 100 200 300 (a) (b) (c)
Fig. 1. (a) Fluctuations in profile soil water contents from 9 October
1998 to 22 December 2000 for the upper 7.8 m of soil at Black Wood ( ) and Bridgets Farm (----). Profile soil water content values are calculated relative to the values observed on 29 January 1999 at both sites. The weekly rainfall from the Black Wood instrument tower automatic weather station and the soil moisture plot rain gauge at Bridgets Farm are shown in (b) and (c) respectively.
additional storage occurred between 3 and 8 m depth at Bridgets Farm. Later in the period, and beyond the scope of this paper, similarly large amounts of storage were observed at a comparable depth in the profile at Black Wood; these persisted until the latest measurements were made in April 2004. In each case, the peak zone of storage moves slowly down through the profile.
Volumetric water content
0.0 0.1 0.2 0.3 0.4 0.5 0 2 4 6 8 0.0 0.1 0.2 0.3 0.4 0.5 0 2 4 6 8 Depth (m) (a) (b)
Fig. 2. Changes in the profile water content at (a) Black Wood and (b) Bridgets Farm on an occasion in winter ( , 29 January 1999) and
when the soil is driest in 1998 (16 October, q ), 1999 ( 17 September, l) and 2000 (15 September,---- ).
SOIL WATER POTENTIAL PROFILES
The manufacturers calibrations, for individual equitensiometers, were used to convert the meter/logger output to a matric potential (cm H2O). The total hydraulic
potential was then obtained by adding a gravitational component based on the depth of the equitensiometer relative to the ground surface.
Analysis of the equitensiometer data was restricted to midday values recorded by the dataloggers for consistency with the manual meter readings obtained at noon, on a
Farm (Fig. 4c and d) there is upward movement in the upper 1 m of the profile, because the grass was growing vigorously then and significant soil water abstraction had already occurred by 30 April (Fig. 1).
At both Black Wood and Bridgets Farm all the total soil water potential profiles indicate downward gradients (i.e. drainage) below a depth of around 12 m even though there are substantial negative soil water potentials in the soil above. The clearest example for Black Wood is for 25 August 2000 (Fig. 4b) where the Zero Flux Plane (ZFP) has
Volumetric water content
0.0 0.1 0.2 0.3 0.4 0.5 0 2 4 6 8 0.0 0.1 0.2 0.3 0.4 0.5 0 2 4 6 8
Dep
th (m)
(b) (a)Fig. 3. Changes in the profile water content at (a) Black Wood and (b) Bridgets Farm on the occasion when the soil is driest ( , 16 October,
1998) and when the soil was at its wettest in the winter of 1998/1999 (l, 29 January 1999); 1999/2000 (m, 5 May 2000) and 2000/2001 (----, 15 December 2000).
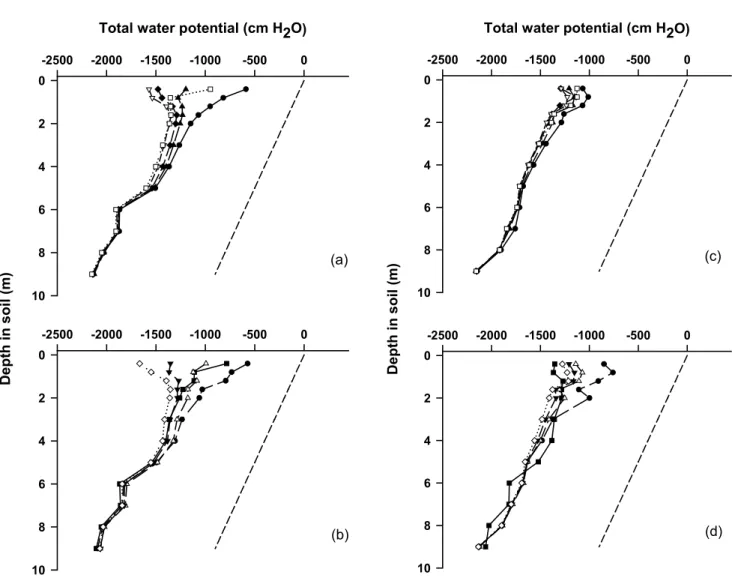
weekly basis. Figure 4 shows vertical profiles of total soil water potential at both Black Wood and Bridgets Farm in 1999 and 2000. In both years, data were selected from five dates chosen as the end dates of periods of at least seven days with little or no rainfall recorded and were distributed to include the growing seasons of the grass and the woodland. At Black Wood in 1999 and 2000, prior to the leaves emerging, the profiles of 30 April, (Fig. 4a) and 31 March (Fig. 4b), still show downward movement of water throughout the whole profile; on the same dates at Bridgets
descended to below 2 m but there is still a negative potential gradient, indicating drainage, below that depth. At Bridgets Farm on the same day, the total water potential gradient also indicates upward movement but the gradient is less marked than at Black Wood. At Bridgets Farm in 2000, the strongest upward gradient occurs in spring.
Unfortunately the soil water potential datasets in Black Wood and Bridgets Farm in 1999 and 2000 are not ideal to define a ZFP continuously because of the frequent input of rainfall. The approach is also difficult to apply in the winter months when, for extended periods, a ZFP is not apparent. However, the equitensiometers provide clear evidence of downward potential gradients, below a zone of upward movement; this, therefore, confirms the existence of a ZFP at both Black Wood and Bridgets Farm. However, because
Total water potential (cm H2O)
-2500 -2000 -1500 -1000 -500 0 0 2 4 6 8 10 -2500 -2000 -1500 -1000 -500 0 D e pt h i n soil ( m ) 0 2 4 6 8 10 (a) (b)
Fig. 4. Depth profiles of total soil water potential below deciduous woodland at Black Wood in 1999. (a) filled circle, 30 April; filled, upright
triangle, 25 June, filled lozenge, 30 July, open, inverted triangle, 10 September and open square 15 October) and 2000. (b) filled square 31 March, filled circle 5 May, open upright triangle 18 June, filled inverted triangle, 22 July and open lozenge, 24 August) and under pasture at Bridgets Farm 1999. (c) filled circle, 30 April, filled, upright triangle, 25 June, filled lozenge, 30 July, open, inverted triangle, 10 September and open square, 15 October) and 2000. (d) filled square, 31 March, filled circle, 5 May, open upright triangle, 18 June, filled, inverted triangle, 22 July and open lozenge, 24 August). The line of equal potential () is also shown.
a continuous ZFP is difficult to define, it cannot readily be used to partition soil moisture changes into upward movement (evaporation) and downward movement (drainage).
DRAINAGE ESTIMATED FROM THE WATER BALANCE EQUATION
In the absence of surface runoff, for any period when all values are available, the components of the water balance (in mm), rainfall (P), evaporation (E) and changes in soil moisture (DS) are related to drainage (D) by the equation;
P - E - DS - D = 0
Total water potential (cm H2O)
-2500 -2000 -1500 -1000 -500 0 0 2 4 6 8 10 -2500 -2000 -1500 -1000 -500 0 Depth in soil (m ) 0 2 4 6 8 10 (c) (d)
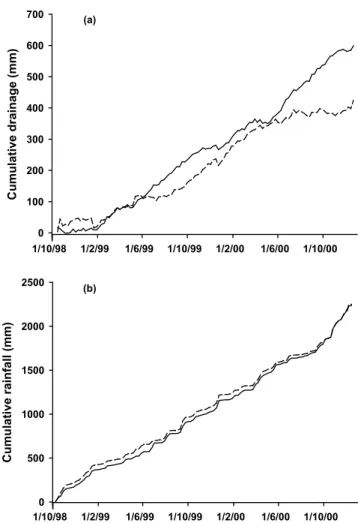
difference in the cumulative drainage between the two sites diverged again, with the drainage rate from Black Wood being very similar to that already observed in previous periods. However, at Bridgets Farm the cumulative drainage from the start of August 2000 is very negligible. It is not until the end of the measurement period that the cumulative drainage from Bridgets Farm starts to increase again. Given that this is the end of the measurement period, no firm conclusions can be drawn.
Discussion
A comprehensive dataset of soil moisture content and soil water potentials in 9 m deep profiles beneath woodland and grassland has been studied. Although there are seasonal differences in the amount of soil drying and the development of negative soil water potentials below the two different Values of rainfall and soil moisture were available from
both sites for the whole of the project. For calculating a water balance, the daily rainfall record from East Stratton was used as this record was complete and agreed well with the data from Black Wood and Bridgets Farm. Directly-measured evaporation data were available only for the period when energy balance information was available for Black Wood and Bridgets Farm. The evaporation measured at Bridgets Farm agreed closely with evaporation calculated using the Penman (1948) formula, so when, in winter, energy balance data were not available, evaporation at Bridgets Farm could be calculated using this formulation adjusted by a factor of 0.25. This factor was derived by correlating Penman estimates with energy balance measurements made in leafless periods in the spring of 1999, the autumn and winter of 1999 and the following spring of 2000. The shortest time interval over which drainage could be calculated was weekly because the soil water content was measured only weekly. In practice, the main interest centred on a comparison of drainage between Black Wood and Bridgets Farm on either a seasonal or an annual basis.
ESTIMATION OF DRAINAGE FROM SOIL WATER BALANCES
To estimate drainage beneath Black Wood and Bridgets Farm, a water balance approach was used in which calculations were made over time intervals between consecutive soil profile water content measurements made with a neutron probe giving the changes in soil water content. The rainfall input is known from the daily rainfall record from East Stratton and the evaporation from the energy balance measurements.
Figure 5a shows the cumulative drainage calculated below Black Wood and Bridgets Farm from 10 March 1999 to 7 September 2000. Figure 5b shows the cumulative rainfall over the same period. At the start of the measurement period, up to the end of January 1999, the cumulative drainage from both sites was negligible although that from Black Wood was about 30 mm higher than that from Bridgets Farm. In the spring of 1999, the cumulative drainage from both sites progressed at the same rate. However, from the beginning of July 1999, cumulative drainage from Black Wood increased faster than that from Bridgets Farm and the drainage behaviour of the two sites diverged. From the beginning of August 1999, the drainage rate from both sites was very similar and remained so until 2000 when the cumulative drainage from Bridgets Farm started to increase at a higher rate than that from Black Wood. From the beginning of April 2000, the cumulative difference between the two sites fell to around 10 mm. From June 2000, the
1/10/98 1/2/99 1/6/99 1/10/99 1/2/00 1/6/00 1/10/00 Cu m u lative rainfall (m m) 0 500 1000 1500 2000 2500 1/10/98 1/2/99 1/6/99 1/10/99 1/2/00 1/6/00 1/10/00 Cumulative drainage (mm ) 0 100 200 300 400 500 600 700 (a) (b)
Fig. 5. (a). Cumulative drainage calculated from a water balance
below woodland at Black Wood ( ) and pasture at Bridgets Farm (----) from October 1998 up to December 2000. (b) Cumulative rainfall at Black Wood ( ) and Bridgets Farm (----) over the same period.
land uses, on an annual basis differences in the overall change in soil water stored are small. The soil water potential profiles suggested no large difference in drainage beneath woodland and grass so that the similarity in the changes in soil water storage was not indicative of the balancing of high abstraction under one land use type by greater drainage under the other.
An important aspect of this investigation was the making of deep measurements of soil moisture content and soil water potential. During the study there were no extended periods without rain and, therefore, deep abstraction of water to support evaporation did not occur. While observations throughout the study revealed that soil moisture changes below about 5 m depth were very small, many previous studies of water use, especially by woodlands, may not have sampled the depth of soil adequately over which drying can occur.
A central issue in the alternative interpretation by Calder et al. (1997, 2000) of earlier results reported by Harding et al. (1992) was that drainage did not occur in the chalk below a soil in which a significant soil water deficit existed. This interpretation meant that Calder and his colleagues had to enhance their modelled evaporation estimate from Black Wood to eliminate drainage when there was a soil water deficit in the surface soil. The present measurements provide categorical evidence that drainage does occur in the chalk profile despite soil moisture deficits in the soil above. Clearly, therefore, the alternative interpretation of the Harding et al. (1992) results by Calder et al. (1997, 2000) is mistaken and the conclusion that broadleaf woodland evaporated more than grassland, the Black Wood anomaly is ill-founded.
The accepted view of the behaviour of many soils, without chalk subsoils, is that field capacity is achieved when the soil is fully wetted in the winter months and drainage has ceased. In the ensuing months when evaporation exceeds rainfall, a soil moisture deficit develops; coinciding with this development there will be no drainage. It is odd that Calder et al. (1997) adopted this concept for soils above chalk given that various publications show that the field capacity concept does not apply to soils in this situation. Wellings and Bell (1980) and Wellings (1984), also working at Bridgets Farm, used soil water content and soil water potential determinations to show (as has been done here) that a ZFP can develop in the chalk matrix below the mineral soil in which there are plant roots. Above the ZFP, water moves upwards to support evaporation and below the ZFP water is draining. Wellings and Bell (1980) found that over 40% of the drainage at Bridgets Farm occurred after a ZFP had developed and concluded that the traditional field capacity concept was not applicable to chalk soils. Other
authors (Gardner et al., 1990; Gregory, 1989) have presented data from other sites with shallow soils above chalk; these are also clear examples of drainage occurring in chalk below drying soils above.
Although the data presented in this paper came from a period of significant rainfall, there were still occasions when evidence from the Equitensiometers showed upward movement of water in the chalk matrix to support the evaporative demand of the vegetation. This movement occurred without the direct involvement of the roots of the beech trees at Black Wood or of the grass at Bridgets Farm. The existence in the near-surface chalk of such a large water resource at the disposal of vegetation has important implications for drought mitigation for shallow-rooted tree species such as beech. In recent years, based on modelling scenarios (Harrison et al., 2001), a contention has developed that supposes that some tree species commonly growing in southern Britain, beech in particular, will be threatened by the droughts that are likely to become more frequent and intense as a consequence of climate change. These contentions might influence current and future tree planting and replacement configurations and their associated ecosystems. However, the demise of beech rooted in shallow soils above chalk may well have been overstated simply because the particular properties of chalk have been misunderstood.
One other aspect of chalk subsoils, in relation to long-term climate conditions and soil water supply, was revealed during the wet winter of 2000/2001 and the subsequent behaviour of soil moisture. The layers from the soil surface down to around 0.8 m depth returned to previous winter conditions. However, deeper layers, which consist wholly of chalk, remained at a higher water content and even three years later there were still layers of the chalk where the high water content reflected the 2000/2001 rainfall events. Wellings and Bell (1980) concluded that water moves down through the chalk matrix at around 0.9 m per year. Downward flow through the fissure/ macropore component of the chalk occurs much more rapidly. Notwithstanding the very rapid downward movement of water in fissures and macropores, extended rainfall such as that recorded during the 2000/2001 winter added very substantially to the water stored in the chalk matrix. Previous studies in dry conditions have provided convincing evidence from the position of the ZFP of upward movement of water over several metres from the chalk (e.g. Wellings and Bell, 1980). Therefore, the occurrence of an occasional very wet winter may rewet the upper part of the chalk profile and facilitate upward movement of water in subsequent dry summers.
Acknowledgements
The work described in this paper was funded partly from a contract (CWO 827) from the UK Department of the Environment, Transport and the Regions (DETR) with additional financial support from the UK Environment Agency. Acknowledgement is made of the assistance with installation and maintenance of the two sites by colleagues at the Centre for Ecology and Hydrology, Wallingford, Andy Dixon, Ivor Standbridge and the late Sam Boyle. The authors are grateful to the Forestry Commission and ADAS Bridgets for access and use of the experimental sites and to Alison Matthews of the Environment Agency, Winchester, for providing the rainfall data from East Stratton.
References
Bending, N.A.D. and Moffat, A.J., 1997. Tree establishment on landfill sites: Research and updated guidance. Dept. of the Environment, Transport and the Regions (DETR), London, UK. 53pp.
Calder, I.R., Reid, I., Nisbet, T.R., Robinson, M. and Walker, D., 1997. TADPOLE, Trees and drought project on lowland England. Scoping Study Report to the Department of the Environment, March 1997.
Calder, I.R., Reid, I., Nisbet, T.R., Brainard, J., Green, J. and Walker, D., 2000. Impact of lowland community forests on groundwater resources. Proc. British Hydrological Society, 7th
National Hydrology Symposium, Newcastle, UK. 2.832.88. Cooper, J.D., 1980. Measurement of moisture fluxes in unsaturated
soil in Thetford Forest. Report No. 66, Institute of Hydrology, Wallingford, UK.
Finch, J.W., 2000. Modelling the soil moisture deficits developed under grass and deciduous woodland: the implications for water resources. J. Chart. Inst. Water Eng. Manage., 14, 371376. Forestry Commission, 2001. National Inventory of woodland and
trees England. Forestry Commission, Edinburgh, UK. 58pp. Gardner, C.M.K., Cooper, J.D., Wellings, S.R., Bell, J.P., Hodnett, M.G., Boyle, S.A. and Howard, M.J., 1990. Hydrology of the unsaturated zone of the Chalk of south east England. In: Chalk, J.B. Burland, B.O. Corbett, D.C. Jones, R.N. Motimore and T.S. Roberts (Eds.). Thomas Telford, London, UK. 611618.
Gregory, P.J., 1989. Depletion and movement of water beneath cereal crops grown on a shallow soil overlying chalk. J. Soil Sci., 40, 513523.
Harding, R.J., Hall, R.L., Neal, C., Roberts, J.M., Rosier, P.T.W. and Kinniburgh, D.G., 1992. Hydrological impacts of broadleaf woodlands: Implications for water use and water quality. Project Report 115/03/ST, National Rivers Authority, Bristol, UK. Harrison, P.A., Berry, P.M. and Dawson, T.P. (Eds.), 2001. Climate
change and nature conservation in Britain and Ireland: MONARCH modelling natural resource responses to climatic change. UK Climate Impacts Programme, Oxford, UK. HMSO, 1996. House of Commons, Environment Committee. First
Report. Water Conservation and Supply. HMSO, London. Jarvis, M.G., 1973. Soils of the Abingdon and Wantage District.
Memoirs of the Soil Survey of Great Britain, England and Wales, Harpenden, UK. 200pp.
McGowan, M. and Williams, J.B., 1980. The water balance of an agricultural catchment. II. Crop evaporation: Seasonal and soil factors. J. Soil Sci., 31, 231244.
Moffat, A.J., 1985. Soils of Bridgets Experimental Husbandry Farm, Martyr Worthy, Winchester. Soil Survey of England and Wales, Rothamsted Experimental Station, Harpenden, Herts., UK.
Newson, M.D., 1979. The results of ten years experimental study on Plynlimon Mid Wales and their importance to the water industry. J. Inst. Water Eng. Sci., 33, 321333.
Penman, H.L., 1948. Natural evaporation from open water, bare soil and grass. Proc. Roy. Soc. A, 193, 120146.
Roberts, J., Rosier, P. and Smith, D.M., 2005. The impact of broadleaved woodland on water resources in lowland UK: II. Evaporation estimates from sensible heat flux measurements over beech woodland and grass on chalk sites in Hampshire. Hydrol. Earth Syst. Sci., 9, 597603.
Wellings, S.R., 1984. Recharge of the upper chalk aquifer at a site in Hampshire, England. J. Hydrol., 69, 259273.
Wellings, S.R. and Bell, J.P., 1980. Movement of water and nitrate in the unsaturated zone of upper chalk near Winchester, Hants., UK. J. Hydrol., 48, 119136.
Williams, J.R., Rose, S.C. and Harris, G.L., 1995. The impact on hydrology and water quality of woodland and set-aside establishment on lowland clay soils. Agr. Ecosyst. Environ., 54, 215222.