HAL Id: hal-00330887
https://hal.archives-ouvertes.fr/hal-00330887
Submitted on 1 Jan 2002
HAL is a multi-disciplinary open access
archive for the deposit and dissemination of
sci-entific research documents, whether they are
pub-lished or not. The documents may come from
teaching and research institutions in France or
abroad, or from public or private research centers.
L’archive ouverte pluridisciplinaire HAL, est
destinée au dépôt et à la diffusion de documents
scientifiques de niveau recherche, publiés ou non,
émanant des établissements d’enseignement et de
recherche français ou étrangers, des laboratoires
publics ou privés.
Physical modelling of the interaction between powder
avalanches and defence structures
F. Naaim-Bouvet, M. Naaim, M. Bacher, L. Heiligenstein
To cite this version:
F. Naaim-Bouvet, M. Naaim, M. Bacher, L. Heiligenstein. Physical modelling of the interaction
between powder avalanches and defence structures. Natural Hazards and Earth System Science,
Copernicus Publications on behalf of the European Geosciences Union, 2002, 2 (3/4), pp.193-202.
�hal-00330887�
Natural Hazards and Earth System Sciences (2002) 2: 193–202 c
European Geosciences Union 2002
Natural Hazards
and Earth
System Sciences
Physical modelling of the interaction between powder avalanches
and defence structures
F. Naaim-Bouvet1, M. Naaim1, M. Bacher1, 2, and L. Heiligenstein1
1Cemagref, Torrent and Avalanche Research Unit, 2 rue de la Papeterie, BP 76, F-38402 Saint-Martin-d’H`eres, France 2WLS-BOKU, Institute of Torrent and Avalanche Control, Universit¨at f¨ur Bodenkultur, Peter-Jordanstrasse, A-1190 Vienna, Austria
Received: 20 September 2001 – Accepted: 5 February 2002
Abstract. In order to better understand the interaction
be-tween powder snow avalanches and defence structures, we carried out physical experiments on small-scale models. The powder snow avalanche was simulated by a heavy salt so-lution in a water tank. Quasi two-dimensional and three-dimensional experiments were carried out with different catching dam heights. For the reference avalanche, the veloc-ity just behind the nose in the head was greater than the front velocity. For the 2-D configuration, the ratio Umax/Ufront was as high as 1.6, but it depends on the height. For the 3-D configuration, this ratio differed slightly and was even greater (up to 1.8). The vertical velocity rose to 106% of the front ve-locity for the 3-D simulation and 74% for the 2-D simulation. The reduction in front velocity due to the presence of dams was an increasing function of the dam height. But this re-duction depended on topography: dams were more effective on an open slope avalanche (3-D configuration). The ratio
Umax/Ufront was an increasing function of the dam’s height and reached a value of 1.9. The obstacle led to a reduction in vertical velocity downstream of the vortex zone.
1 Introduction and objectives of the studies
Depending on their flow behaviour, avalanches can be classi-fied as dense-flow avalanches or powder snow avalanches. In the latter case, avalanches consist of ice particle suspended in air. They occur as a dust cloud at the top of flowing avalanches under certain conditions, i.e. when the snow is cold, dry and of low cohesion. An avalanche is considered a pure powder snow avalanche when there is no dense core on the bottom of the flow (MacClung and Schaerer, 1993). The transition from a dense flow avalanche to a powder snow avalanche is not fully understood. Under certain conditions, this suspension may reach extensions of 1000 m in length, 500 m in width and over 100 m in height, with a density of 2–
Correspondence to: F. Naaim-Bouvet ([email protected])
5 kg/m3(Nishimura et al., 1995). A powder snow avalanche may reach flow velocities of up to 100 m/s and exert pressure loads on obstacles amounting to 10–50 kPa (Nishimura et al., 1995).
In spite of significant efforts, the dynamics of powder snow avalanches is not well known due to the lack of field experiments with valid measurements. Nonetheless, teams in Norway, Japan and Switzerland have made systematic in-vestigations and have succeeded in obtaining sets of valuable data. But these studies did not take the interaction with the defense structures into account. Improving the knowledge of avalanche behaviour near the obstacle would be useful for end-users. For this reason, a part of the European project CADZIE (Catastrophic Avalanches Defence Structures and Zoning in Europe) is dedicated to the study of the interaction between powder avalanches and obstacles.
It is obvious that it is preferable to obtain data from the process itself. But if this is not possible, as seen previously, laboratory experiments remain a good option: there is no limit to the number of experiments that can be conducted and initial and boundary conditions can be systematically varied. There are two advantages to performing laboratory experi-ments:
– it is possible to extract results from small-scale to
field-scale even if it remains difficult to find an appropriate simulation;
– it is possible to validate numerical simulations with a
set of valuable data.
In this paper, we will introduce the experiments and the main results obtained on the interaction of 2-D and 3-D pow-der avalanches with catching dams simulated in a water tank. The comparison with numerical simulations will be the sub-ject of a further communication.
194 F. Naaim-Bouvet et al.: Physical modelling of the interaction
Fig. 1. A general view of the water tank with the submerged
chan-nel.
2 Previous studies
2.1 Physical modelling: Different approaches and simili-tude requirements
In the past, several attempts have been made to simulate a powder avalanche. It is possible to distinguish three different approaches: heavy fluid in water, two-phase simulation in water, two-phase simulation in air.
2.1.1 Heavy fluid in water
Hopfinger and Tochon-Danguy (1977) and later Beghin (1991) employed a density, gravity or turbidity current con-cept. The avalanche consists of a heavy fluid that is dispers-ing in a lighter one. In water-tank experiments, the injection could either be continuous or of short duration, as in our ex-periments. In the case of a short duration injection, called “inclined thermal” (Hopfinger and Tochon-Danguy, 1977) or “buoyant cloud” (Beghin, 1991), only a head (without a quasi-steady layer) is established, representing a “short” avalanche. In the continuous injection, an inclined grav-ity current representing a long avalanche is observed, in which the body flow determines the front velocity. When the Reynolds number is sufficiently high, similarity is respected if the densimetric Froude numberq U
9H1ρρ and the density ra-tio of the current to the ambient fluid1ρρ are respected (where
U is the down slope velocity, H is the flow height, and 1ρρ is the relative density difference). Fulfilling both numbers in the laboratory means that a very high velocity is necessary, which calls for considerable channel dimensions. As a result, a distortion in the density ratio is taken into account. In the laboratory, salt suspensions or solid particles in water with a density ratio ranging up to 1.2 are used, whereas for powder avalanches, this ratio is on the order of 10. In the laboratory,
Fig. 2. Two-dimensional channel.
Fig. 3. Schematic drawing of the water tank with the submerged
channel.
the flow satisfies the Boussinesq approximation (i.e. density ratio close to 1), while this is not the case in real avalanches.
2.1.2 Two-phase simulation in water
The previous models, based on a density current, can only be used if particle settling is of marginal importance. In order to investigate the run-out zone of a powder avalanche, where phase separation is of great importance, Hermann and Hutter (1991) developed a two-phase physical model. In this case, powder snow was simulated by a turbulent suspension flow of polystyrene particles in water. The similarity was pre-served by the conservation of the densimetric Froude
num-F. Naaim-Bouvet et al.: Physical modelling of the interaction 195
Fig. 4. Two-dimensional avalanche upstream of the obstacles.
ber and the ratio of downstream velocity to free-fall velocity
U
Ufall (where Ufallis the free-fall velocity of the particles). A
strong distortion of the density ratio was also unavoidable in this type of experiment.
2.1.3 Two-phase simulation in air
In the experiments carried out by Bozhinskiy and Sukhanov (1998), the dense avalanche was modelled with dry powder materials. The authors considered the simplest mathematical model of a snow avalanche as a material point and obtained the adimensional parameters from this equation. Thus, they started from dense flow and also observed the formation of the powder cloud. In fact, the determined criteria do not al-low the description of the propagation of the aerosol cloud, but the authors considered that they could estimate the effects connected with the genesis of the cloud when an avalanche body enters a deceleration zone using this set of parameters.
2.2 Interaction between powder avalanches and dams
Research dealing with the interaction between a gravity cur-rent and obstacles is scare. A first attempt was made by
Fig. 5. Transducer with apex angle of the acoustic field.
Fig. 6. Notation.
Hopfinger and Tochon-Danguy (1977) in the 1970s. Later, a series of experiments studying unsteady gravity current flow over deflecting and catching dams was conducted at Cema-gref by Beghin and Closet (1990) and Aug´e et al. (1995) for 2-D and 3-D configurations. Similar experiments as those done by Beghin and Closet (1990) were carried out by Keller and Issler (1996) with two-phase flow, using ultrasonic trans-ducers and the Doppler effect for measuring particle veloc-ities and concentrations inside the flow and near the dam. More recently, Lane-Serff et al. (2000) studied the effect of a steady gravity current on an obstacle (a ridge covering the full width of the tank, 2-D configuration). Beghin and Closet (1990) and Lane-Serff et al. (2000) only had access to the front velocity and could not investigate the velocity inside the gravity current.
3 Experimental set-up and measurement devices
3.1 Water tank and operating procedure
The experimental set-up consisted of a 4-m×2-m×4.5-m wa-ter tank with glass walls (Figs. 1–3). Buoyant clouds flow along an inclined plane from a small immersed tank (length 20 cm, width 15 cm, capacity 4 l) with a release gate. Powder avalanches were simulated by a heavy fluid (salt water plus kaolin) which was dispersing into a lighter one. The density of salt water was 1.185, but the density of heavy fluid was 1.2. By adding kaolin, the gravity current in the water tank could be made visible. Kaolin was also necessary because ultrasonic methods can only measure the particles within the suspension. In fact, the simulated avalanche was more a puff of non-continuous injected density than a current of heavy fluid: a finite volume of heavy fluid was released instanta-neously from the small immersed tank. Contrary to what
oc-196 F. Naaim-Bouvet et al.: Physical modelling of the interaction
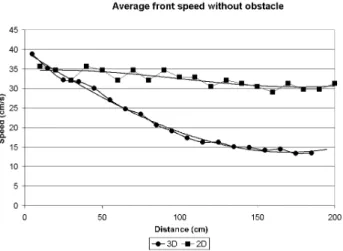
Fig. 7. Reference avalanche front speed for 2-D and 3-D
configura-tions.
curs in nature, the avalanches in laboratory simulation started as powder avalanches. Furthermore, the entrainment of par-ticles was not simulated. 3-D and 2-D simulations were per-formed. In the 2-D configuration, the avalanche track was confined to a channel (length 285 cm, width 15 cm, height 50 cm). In the 3-D configuration, the avalanche track was first confined to a small channel (length 47 cm, width 15 cm, height 30 cm) before flowing down the inclined plane (length 300 cm, width 190 cm), in order to represent the effect of an avalanche path upstream of the run-out zone. The experi-ments were carried out with an obstacle representing a model of a defense structure called a dam, which was mounted on the floor and placed perpendicular to the obstacle and to the flow, and set up 97 cm from the gate perpendicular to the plane and perpendicular to the channel axis, which is the flow. This obstacle, with a height up to 8 cm was 50 cm wide in the 3-D configuration. In the 2-D simulation, however, it obstructed the channel. Runs were made along a constant slope of 10◦. The initial volume in the release tank was 2 l for every trial. We determined experimentally that the highly turbulent nature of the avalanches required the ensemble av-eraging over five identical experiments (see Fig. 7). We have to mention that our experiments did not contain the so-called saltation layer. Among practitioners and specialists there is considerable uncertainty concerning the effect of a dam on the potentially very destructive saltation layer.
3.2 Measurement techniques
Two cameras were used (top and side views) to obtain the height, length, width and the shape of flow, together with the front velocity. The Doppler ultrasonic velocimetry measured the component of the particle velocity vector in the direction of the transducer. The principle of this sensor is based on the change in frequency of an acoustic wave resulting from the movement of particles present in the heavy fluid.
In the zone between the head of the transducer and a dis-tance of 16.7 mm, the acoustic field is basically cylindrical,
Fig. 8. Average values of horizontal velocity of five single
experi-ments in 2-D configuration.
with a diameter of 5 mm. In the far field zone, the inten-sity of the acoustic field varies as the inverse of the square of the distance from the transducer and oscillates in the plane perpendicular to the axis of propagation (see Fig. 5). Con-trary to transducers used by Hermann and Hutter (1991) and Keller (1995), it was not possible in our case (transducers and expanded ultrasonic unit were manufactured by another company) to determine the particle concentration.
An array of two transducers coupled with the expanded ul-trasonic unit was used in the experiments. We plan to buy five other transducers in the future (second phase of the CADZIE project), in order to complete the measurements of speed pro-files of the flow. Measurements with only two transducers forced the number of experiments to increase, as it was only possible to record two measurement points simultaneously.
We have to keep in mind that the ultrasonic unit allows to measure the component of the particle velocity vector only in the direction of the transducer. This is why two procedures were followed:
– in the first, profiles are taken along a line perpendicular
to the inclined plane (α=0◦, β=0◦) at three different po-sitions: x = 46 cm, x = 96 cm and x = 146 cm from point 0 (end of the first channel, see Fig. 6), in order to determine the change in horizontal velocity at different heights in the avalanche. Along the y-axis, we estab-lished three positions for our measurements according to the lower transducer: y = 0.7 cm, y = 2.7 cm and
y = 8.7 cm. As two transducers are mounted at the same supporter, measurements are taken simultaneously both for the lower and the upper transducer. Positions for the upper one are given by the fixed distance of 4 cm between the two transducers (y = 4.7 cm, y = 6.7 cm and y = 12.7 cm);
– in the second, only one transducer was vertically set
up (α = 90◦, β = 0◦) to the inclined plane. This al-lowed one to determine the change in vertical velocity
F. Naaim-Bouvet et al.: Physical modelling of the interaction 197
Table 1. Dimensionless numbers in nature and in laboratory
exper-iments (Hermann and Hutter, 1991)
Nature Laboratory Relative density difference1ρρ 4 0.2 Reynolds number Re 108 104 Densimetric Froude numberq U
gH1ρρ
5 5
at three different positions (x = 50 cm, x = 96 cm and
x =146 cm from the origin) at different heights in the avalanche.
A specific distance between the sampling volume and the transducer can be selected; it was chosen as a compromise between a small sampling volume (short distance) and a small influence of the transducer on the measured flow (long distance). We have fixed this distance to 4 cm in the first pro-cedure. Thus, the sampling volume has the shape of a disk 9 mm in diameter and 0.75 mm in height. The temporal res-olution was of 21.4 ms.
3.3 Similitude requirements
In our experiments, the following dimensionless numbers compared with those from nature were used (see Table 1).
As said previously, the similarity between the real powder snow avalanche and the simulated powder snow avalanche is achieved by the conservation of the densimetric Froude num-ber. The Reynolds number is very high for both processes in nature and in the laboratory. Since the flow is fully turbu-lent, it does not depend on the Reynolds number. But the relative density difference differs by orders of magnitude in natural and laboratory avalanches. In fact, mercury is suf-ficiently dense with respect to the density ratio of powder snow avalanche (even at small scale, it would run pretty fast in water, but was not suitable for the users).
Nevertheless, according to Hopfinger and Tochon-Danguy (1977), the air entrainment rate depends primarily on the in-ternal Froude Number and the large density variation in an avalanche only reduces the drag resulting from the air en-trainment. In order for this drag to dominate over the wall shear stress, the slope angle must be greater than a certain minimum value, which is approximately 5◦for a low density
flow.
4 Main results
Before dealing with the effect of dams, it is first of all nec-essary to treat the avalanche without a dam. This kind of avalanche will be called the reference avalanche.
(a)
(b)
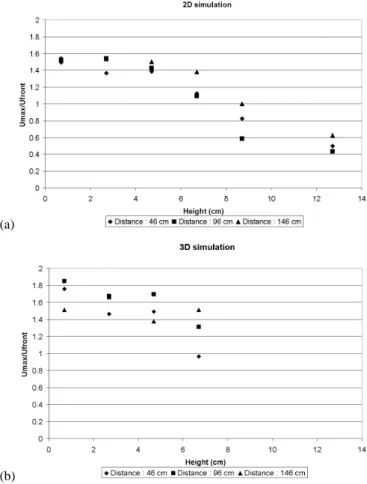
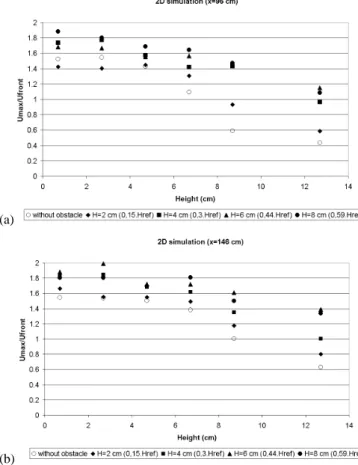
Fig. 9. (a) Values of Umax/Ufrontas a function of height for
dif-ferent distances for 2-D simulation. (b)Values of Umax/Ufrontas a
function of height for different distances for 2-D simulation.
4.1 Reference avalanche
Figure 7 shows that in the front velocity Uf ront, there was
an initial acceleration phase from the release gate (where
Uf ront = 0) followed by a deceleration phase. The
veloc-ity is weakly dependent on the initial conditions (slope, ini-tial volume and density ratio) (Beghin and Olagne, 1991). The greater deceleration observed in the 3-D configuration is explained by the lateral growth of the avalanche. Fig-ure 8 shows average values for a velocity time series. Since measurements were not automatically initiated but released manually, there was a random component in their position relative to the avalanche head. Since the maximum veloc-ity is relevant for determining the maximum pressure, we have chosen to shift the maximum peaks of each run in or-der to have all the maxima at the same position, i.e. at the same time. The velocity just behind the nose in the head was greater than the front velocity. We observed the same struc-ture in the 3-D configuration with a time lag due to the lower front speed.
In the 2-D simulation, the velocity maximum was about 1.5 times the front velocity, which is in accordance with Hopfinger’s results. In both cases the slope was 10◦, but Hopfinger and Tochon-Danguy (1977) suggest that there is a
198 F. Naaim-Bouvet et al.: Physical modelling of the interaction
Fig. 10. Vertical velocity as function of time (3-D simulation).
Fig. 11. Ratio between the maximum positive vertical speed
(aver-age over 5 runs) and the front velocity as a function of distance for 2-D and 3-D simulations.
slope-angle-dependence. But Keller’s measurements (1995) in a 3-D configuration at angles from 30◦to 45◦did not re-veal any slope dependence of this ratio: its values were 1.5– 1.6 and remained so even on a horizontal run-out. According to the velocity profiles, this ratio fell with height (see Figs. 9a and b). However, there was no distance dependence: the dis-tance corresponds to the disdis-tance covered by the avalanche. For the 3-D configuration (see Figs. 9a and b), the ratio dif-fered slightly from those previously measured: it was even greater (up to 1.8 near the ground).
The frontal large eddy circulated in a counterclockwise di-rection (for a gravity current moving from left to right); this is the feature of the gravity currents or thermals with dominant air drag. It is translated in the following graph by a negative vertical velocity coming after a positive vertical velocity (see Fig. 10). At a given distance from the release tank, the pos-itive vertical velocity was observed during a very short pe-riod. It is quite interesting to observe that the value (even for negative speed) of this vertical velocity rose to 106% (91%) of the front velocity for 3-D simulation and 74% (70%) for 2-D simulation (see Figs. 11 and 12). This might explain why powder avalanches can lift small obstacles (trees, elec-tric poles, cable-car pillars, even roofs).
Fig. 12. Ratio between the maximum negative vertical speed
(aver-age over 5 runs) and the front velocity as a function of distance for 2-D and 3-D simulations.
(a)
(b)
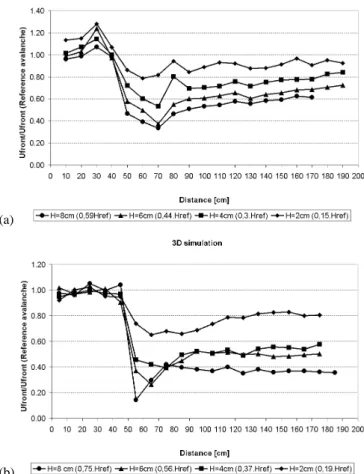
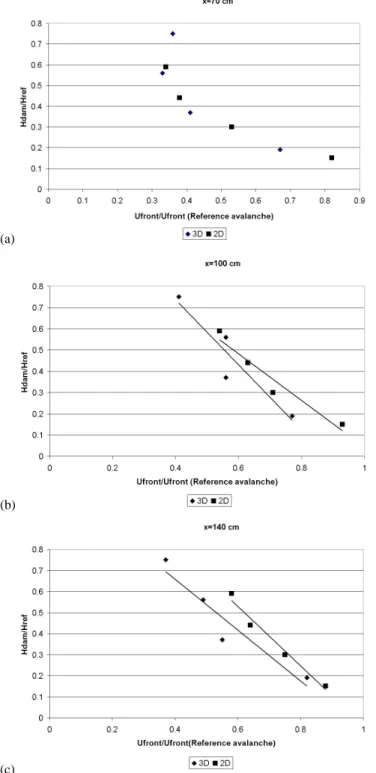
Fig. 13. (a) Values of Ufront/Ufront, ref as a function of
dis-tance for different dam heights (2-D simulation). (b) Values of
Ufront/Ufront, refas a function of distance for different dam heights (3-D simulation).
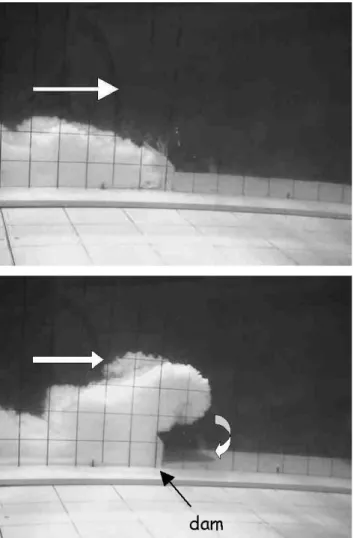
4.2 Effect of the dam
In contrast to dense snow avalanches, powder avalanches be-have like a turbulent Newtonian fluid. The flow overruns obstacles: the dam causes an acceleration of flow above it and then a vortex appears. This vortex acquires its circula-tion from the impulse due to the acceleracircula-tion above the dam
F. Naaim-Bouvet et al.: Physical modelling of the interaction 199
(a)
(b)
(c)
Fig. 14. (a) Values of Ufront/Ufront, ref as a function of
adimen-sional dam height at x = 70 cm. (b) Values of Ufront/Ufront, ref
as a function of adimensional dam height at x = 100 cm. (c) Val-ues of Ufront/Ufront, refas a function of adimensional dam height at
x =140 cm.
(Hopfinger and Tochon-Danguy, 1977). In our experiment, the reduction in the front velocity was an increasing function of the dam height. Furthermore, the larger the distance is from the dam, the smaller the reduction (see Figs. 13a and 13b). The dams are significantly more effective in the
open-Fig. 15. Loss of kinetic energy as a function of dam height for
different distances.
(a)
(b)
Fig. 16. (a) Ratio between the maximum horizontal speed with
dam and without dam as a function of height for 2-D simulation.
(b) Ratio between the maximum horizontal speed with dam and
without dam as a function of height for 3-D simulation.
slope (3-D) configuration than in the channelled case. In the case of a channelled avalanche (2-D configuration), the adi-mensional front velocity was higher (see Figs. 14a–c). The lateral diffusion upstream of the dam on an open slope may explain this effect.
200 F. Naaim-Bouvet et al.: Physical modelling of the interaction
(a)
(b)
Fig. 17. (a) Ratio between the maximum horizontal speed (average
over five runs) and the front velocity as a function of height for 2-D simulation at x = 96 cm. (b) Ratio between the maximum horizontal speed (average over five runs) and the front velocity as a function of height for 2-D simulation at x = 146 cm.
a dam in terms of the loss of kinetic energy due to the dam. This loss of energy was roughly estimated in the following formula:
Uref2 −Udam2
Uref2 , (1)
where Udamis the average front velocity over a distance of 30 cm just beneath the dam and Urefis the average front ve-locity over the same distance for the reference avalanche.
Figure 15 shows that our results for the 3-D configuration are in good agreement with Beghin and Closet’s results (the only difference between both experiments is the density ra-tio: 1.3 for Beghin and Closet experiments, 1.2 for ours). As stated before, the dams were less efficient in the case of a channelled avalanche: the loss of kinetic energy was approx-imately 10% less than for unchannelled flows.
But caution is needed when using the simple Eq. (1) above. Powder avalanches behave like Newtonian fluids. The dy-namic pressure is given by p = ρu22. The maximum pressure is expected to occur for the maximum values in velocity and density. As mentioned by Hopfinger (1983), laboratory ex-periments show that the velocity inside the avalanche can be
(a)
(b)
Fig. 18. (a) Ratio between the maximum horizontal speed (average
over five runs) and the front velocity as a function of height for 3-D simulation at x = 96 cm. (b) Ratio between the maximum horizontal speed (average over five runs) and the front velocity as a function of height for 3-D simulation at x = 146 cm.
1.5–2.5 times the front velocity, and close to the ground the effective density is larger than the average density, by a fac-tor 2 to 4, in real powder snow avalanches. Therefore, the measured peak pressure can be larger, by a factor of 10, than the pressure calculated from the front velocity and the aver-age velocity. Therefore, in the following paragraphs, we will deal with the maximum velocities (in fact the mean maxi-mum velocity over five runs).
The reduction in velocity near the ground was about 50% in the 2-D configuration and 60% in the 3-D configuration. In fact, the velocities appear to be redistributed rather than reduced. Figures 16a and b show that there was an accel-eration of speed in the higher part of the profile, when the distance from the ground was of the same order as the refer-ence height. In the lower part of the profile, even if there was no acceleration, one can see that the velocity reduction was an increasing function of its height. This trend was not so dominant in the 3-D configuration (Fig. 16b). However, one must bear in mind that the higher part of the speed profile was not studied due to the low value of speed in the experiments. The previous studies of Beghin and Closet (1990) and Aug´e et al. (1995) refer to the front velocity. Considering
F. Naaim-Bouvet et al.: Physical modelling of the interaction 201
(a)
(b)
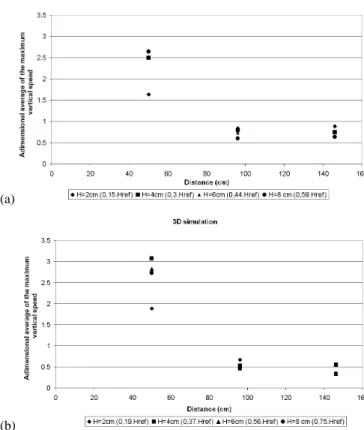
Fig. 19. (a) Ratio between the maximum positive vertical speeds
(average over five runs) with and without dam as a function of dis-tance for 2-D simulation. Four different dam heights were tested.
(b) Ratio between the maximum positive vertical speeds (average
over five runs) with and without dam as a function of distance for 3-D simulation. Four different dam heights were tested.
that the velocity just behind the nose in the head was greater than the front velocity, we studied the modification of the ra-tio between maximum velocity and front velocity as a func-tion of dam height. For the 2-D configurafunc-tion, this ratio was an increasing function of dam height and reached a value of 1.9; this means that the use of the front velocity led to an overestimation of a dam’s effectiveness that became worse as the dam height was increased. This trend was not so pro-nounced in the 3-D configuration. Instead, we must keep in mind that the deviations from the mean were greater for the 3-D experiments: the averaging should probably have been made over seven or ten runs. Figures 17a, b and 18a, b re-port the results. The height of the undisturbed flow at the location of the dam was 13.5 cm (10.7 cm) for the 2-D (3-D) configuration. The dam caused an increase in the vertical velocity component just above it. The maximum vertical ve-locity above the obstacle was an increasing function of dam height in the range of the tested configurations. This velocity was about three times larger than the reference vertical ve-locity. This effect was more pronounced in 3-D simulations (see Fig. 19b). On the contrary, one can see that the positive and negative velocities decreased downstream of the obstacle (see Figs. 19a, b and 20a, b). This reduction was an
increas-(a)
(b)
Fig. 20. (a) Ratio between the maximum negative vertical speeds
(average over five runs) with and without dam as a function of dis-tance for 2-D simulation. Four different dam heights were tested.
(b) Ratio between the maximum negative vertical speeds (average
over five runs) with and without dam as a function of distance for 3-D simulation. Four different dam heights were tested.
ing function of the dam height and was more pronounced for the 3-D configuration. Nevertheless, it is rather difficult to interpret the results plotted in Figs. 18a, b and 19a, b, be-cause the maximum positive (or negative) vertical speeds are not observed at the same heights for the reference avalanche and the avalanche with dams.
5 Conclusions and further developments
For the reference avalanche, the velocity just behind the nose in the head is greater than the front velocity. For the 2-D configuration, the ratio Umax/Ufront can be 1.6, but it de-pends on the height. For the 3-D configuration, this ratio differs slightly and it was even greater (up to 1.8). The ver-tical velocity is up to 87% of the front velocity for the 3-D simulation and 66% for the 2-D simulation.
The reduction in front velocity due to the presence of a dam is an increasing function of the dam height. But this re-duction depends on the topography: dams are more effective on an open-slope avalanche (3-D configuration). The ratio
Umax/Ufrontis an increasing function of the dam height and can reach a value of 1.9. Consequently, the front velocity is, therefore, not relevant in determining the effectiveness of
202 F. Naaim-Bouvet et al.: Physical modelling of the interaction
dams. The obstacle leads to a reduction in vertical velocity downstream of the vortex zone.
In water-tank experiments, the injection can either be con-tinuous or of short duration, as in our experiments. In this case, only a head (without a quasi-steady layer) is estab-lished. On a slope of 10◦, the velocity maximum just be-hind the nose of the reference avalanche is about 1.5 times the front velocity. But in a steady density current, this veloc-ity maximum is about 2.5 times the front velocveloc-ity. For this reason, we intend to test the effect of a continuous injection in the near future.
Another important point is the density ratio. The applica-bility of our results to real powder snow avalanches is still an open question, mainly because the density ratio is not respected. This effect will be studied in a later part of the CADZIE project by means of numerical simulations. More-over, the density distributions must be taken into considera-tion when calculating avalanche loads. In our experimental set-up, we did not have access to this data, but numerical simulations will yield information on this important point.
Acknowledgements. This research was supported by European
Union (EVG1-1999-00009) in the framework of the CADZIE project (Catastrophic Avalanches Defence Structures and Zoning in Europe). The authors gratefully acknowledge the assistance of F. Ousset (Cemagref) and Ch. Eymond-Gris (Cemagref) for preparing experiments.
References
Aug´e, A., Ousset, F., and Marco, O.: “Effet d’une digue sur l’´ecoulement d’un aerosol”, Proceedings of Chamonix
Sympo-sium “The contribution of scientific research to safety with snow, ice and avalance”, 235–240. 1995.
Beghin, P. and Closet, J.-F.: Effet d’une digue sur l’´ecoulement e l’avalanche poudreuse, Note technique du Cemagref, no. 77, Grenoble, 1990.
Beghin P. and Olagne X.: Experimental and theoretical study of the dynamics of powder snow avalanches, Cold Regions and Tech-nology, 19, 317–326, 1991.
Bozhinskiy A. N. and Sukhanov, L. A.: Physical modeling of avalanches using an aerosol cloud of powder materials, Annals of Glaciology, 26, 242–246, 1998.
Hermann, F. and Hutter, K.: Laboratory experiments on the dynam-ics of powder-snow avalanches in the run-out zone, J. of Glaciol-ogy, 37, 126, 281–295, 1991.
Hopfinger, E. J. and Tochon-Danguy, J.-C.: A model of powder-snow avalanches, J. of Glaciology, 19, 81, 343–356, 1977. Hopfinger, E. J.: Snow avalanche motion and related phenomena,
Ann Rev. Fluid Mech., 15, 47–76, 1983.
Keller, S.: Measurements of powder snow avalanches: Laboratory, Surveys in Geophysics, 16, 661–670, 1995.
Keller, S. and Issler, D.: Staublawinen ¨uber D¨amme und Mauern im Labor; Zusammenstellung aller Resultate und Auswertung, Internal report of the Swiss Federal Institute for Snow and Avalanche, Research no. 697, Davos (Switzerland), April, 1996. Lane-Serff, B. L. M. and Hadfield, T. D.: Gravity current over
ob-stacles, J. of Fluid Mechanics, 292, 39–53, 2000.
McClung, D. and Schaerer, P.: The Avalanche Handbook, The Mountaineers, Seattle, 1993.
Nishimura, K., Sandersen, F., Kristensen, K., and Lied, K.: Mea-surements of powder snow avalanche – Nature, Surveys in Geo-physics, 16 649–660, 1995.