HAL Id: hal-00300825
https://hal.archives-ouvertes.fr/hal-00300825
Submitted on 7 Mar 2002HAL is a multi-disciplinary open access
archive for the deposit and dissemination of sci-entific research documents, whether they are pub-lished or not. The documents may come from teaching and research institutions in France or abroad, or from public or private research centers.
L’archive ouverte pluridisciplinaire HAL, est destinée au dépôt et à la diffusion de documents scientifiques de niveau recherche, publiés ou non, émanant des établissements d’enseignement et de recherche français ou étrangers, des laboratoires publics ou privés.
Using 14C, 13C, 18O and 17O isotopic variations to
provide insights into the high northern latitude surface
CO inventory
T. Röckmann, P. Jöckel, Valérie Gros, M. Bräunlich, G. Possnert, C. A. M.
Brenninkmeijer
To cite this version:
T. Röckmann, P. Jöckel, Valérie Gros, M. Bräunlich, G. Possnert, et al.. Using 14C, 13C, 18O and 17O isotopic variations to provide insights into the high northern latitude surface CO inventory. Atmospheric Chemistry and Physics Discussions, European Geosciences Union, 2002, 2 (2), pp.213-248. �hal-00300825�
ACPD
2, 213–248, 2002Isotope variations of high northern latitude
surface CO T. R ¨ockmann et al. Title Page Abstract Introduction Conclusions References Tables Figures J I J I Back Close
Full Screen / Esc
Print Version Interactive Discussion
©EGS 2002
Atmos. Chem. Phys. Discuss., 2, 213–248, 2002 www.atmos-chem-phys.org/acpd/2/213/
© European Geophysical Society 2002
Atmospheric Chemistry and Physics Discussions
Using
14
C
,
13
C
,
18
O
and
17
O
isotopic
variations to provide insights into the high
northern latitude surface CO inventory
T. R ¨ockmann1,2, P. J ¨ockel2, V. Gros2, M. Br ¨aunlich2, G. Possnert3, and
C. A. M. Brenninkmeijer2
1Max-Planck-Institut f ¨ur Kernphysik, Bereich Atmosph ¨arenphysik, Heidelberg, Germany 2Max-Planck-Institut f ¨ur Chemie, Abteilung Luftchemie, Mainz, Germany
3Uppsala University, Angdtr ¨omlaboratoriet, Uppsala, Sweden
Received: 28 January 2001 – Accepted: 20 February 2002 – Published: 7 March 2002 Correspondence to: T. R ¨ockmann ([email protected])
ACPD
2, 213–248, 2002Isotope variations of high northern latitude
surface CO T. R ¨ockmann et al. Title Page Abstract Introduction Conclusions References Tables Figures J I J I Back Close
Full Screen / Esc
Print Version Interactive Discussion
©EGS 2002
Abstract
Measurements of the complete isotopic composition of atmosphericCO(13CO,14CO, C17O, C18O) have been carried out at the high northern latitude stations
Spitsber-gen, Norway, and Alert, Canada. The annual changes of the isotope signatures re-flect the seasonally varying contributions from the individualCOsources and the OH 5
sink. Short-term variability is small at the remote sampling locations. Nevertheless, the interannual variability is considerable, in particular for the summer minimum. The most prominent event was a strong increase inCO in 1998 that persisted for several months. Using the isotope signatures it is possible to clearly identify extraordinar-ily strong biomass burning during that season as the cause for this large-scale CO 10
anomaly. In 1997, on the other hand, biomass burning emissions were very low, lead-ing to an unusually low summer minimum and correspondlead-ing isotope signatures. The results underscore that monitoring ofCOand its isotopic composition at remote high latitude stations is a valuable tool to better understand long-term variations ofCOthat are representative for the whole high northern latitude region.
15
1. Introduction
Carbon monoxide is of considerable importance to the chemistry of the global atmo-sphere for several reasons: Foremost, it is the main reaction partner of the hydroxyl radical (OH), which is responsible for the removal of many natural and anthropogenic contaminants from the troposphere. Because the reaction withCO is responsible for
20
more than half of the total turnover ofOH(Crutzen and Zimmermann, 1991), changes inCOcan considerably affect mixing ratios of a host of atmospheric constituents that are oxidized byOH, including the greenhouse gas methane. In fact, although not be-ing an effective greenhouse gas itself, it has been shown that the emission of fiveCO
molecules is equivalent to the emission of oneCH4 molecule as regards greenhouse 25
ACPD
2, 213–248, 2002Isotope variations of high northern latitude
surface CO T. R ¨ockmann et al. Title Page Abstract Introduction Conclusions References Tables Figures J I J I Back Close
Full Screen / Esc
Print Version Interactive Discussion
©EGS 2002
In addition to its significance for OH, the reaction CO+ OH leads to the formation ofHO2 which, depending onNOx-levels, can lead either to the production (highNOx)
or destruction (lowNOx) of ozone. Under highNOxconditions this pathway is a major
contributor to ground level photochemical smog.
Through its active role in atmospheric chemistry, CO is also a major player in the
5
global carbon cycle. Most organic compounds – natural or anthropogenic – that are oxidized in the atmosphere are processed via CO to the stable CO2 molecule. This
results in a global turnover of about 2 to 3 Pg/y.
A global increase ofCO over the past 200 years has been derived from measure-ments of COin air bubbles trapped in polar ice (Haan et al., 1996), changes in the
10
solar absorption spectra from the 1920s to the 1970s (Rinsland and Levine, 1985) and in situ observations at various atmospheric monitoring stations over the last two decades (Khalil and Rasmussen, 1988, 1990, 1994; Novelli et al., 1994a, 1998, 1992). The increase in globalCOmay have been halted (Khalil and Rasmussen, 1994; Novelli et al., 1994a, 1998), and at present the atmosphericCObudget is being examined in
15
considerable detail using various techniques: In situ measurements are carried out on a global scale and impressive observations from satellites are becoming available (see e.g. MOPITT homepage at
http://www.atmosp.physics.utoronto.ca/MOPITT/home.html). Computer models are used to refine source scenarios based on the observed CO distribution,
20
using all available information about atmospheric chemistry and physics (Bergamaschi et al., 2000a, 2000b; Granier et al., 1999). An additional method is isotope analysis. The different isotopic signatures provide independent variables that can help to resolve the contributions of the individual sources and thus to better understand the globalCO
budget. The majorCO sources and their isotopic source signatures are presented in
25
Table 1.
Due to the strongCOsources at the surface and its short chemical lifetime of weeks to months, the mixing ratio and all isotope signatures of troposphericCOexhibit pro-nounced temporal and spatial gradients. In this paper, theCO,δ13C, δ18O,∆17O and
ACPD
2, 213–248, 2002Isotope variations of high northern latitude
surface CO T. R ¨ockmann et al. Title Page Abstract Introduction Conclusions References Tables Figures J I J I Back Close
Full Screen / Esc
Print Version Interactive Discussion
©EGS 2002
14COtime series from Spitsbergen (79◦N) and Alert (82◦N) are presented, which are
our longest CO isotope records for the northern hemisphere. CO mixing ratios are reported in parts per billion (ppb), i.e. 10−9 or nmole/mole. Variations in the stable isotope composition are usually reported inδ- notation as the relative deviation of the ratio of the minor isotope to the abundant isotope, e.g. 13C/12C ≡ 13R in a sample
5
(SA) from an international standard (ST) ratio, i.e.δ13C = (13RSA/12RST−1)∗1000‰. In
the case of13C, the standard is Vienna PeeDeeBelemnite (V-PDB), in the case of the
oxygen isotopes Vienna Standard Mean Ocean Water (V-SMOW). For17O, it is useful to introduce the variable∆17O≡ δ17O−0.52 × δ18O, which is a measure
(mathemat-ical approximation) for the excess of17O above what is expected based on theδ18O 10
value. 14COvalues are reported in molecules per cm3 of air at standard temperature and pressure (Brenninkmeijer, 1993). The activity of the variousCOsource materials is usually reported in percent Modern Carbon (pMC) (Stuiver and Polach, 1977), and contemporary biomass and organic sources usually have an activity of 120 pMC.
2. Experimental 15
The air sampling and subsequentCOextraction, conversion and analytical procedures have been extensively described in the literature (Brenninkmeijer, 1993; Brenninkmei-jer et al., 2001; BrenninkmeiBrenninkmei-jer and R ¨ockmann, 1997, 1998b; Mak and BrenninkmeiBrenninkmei-jer, 1994; R ¨ockmann, 1998; Rom et al., 2000). At the sampling stations, 1 m3air samples
are compressed into 10 L aluminum cylinders (Scott Marrin, Riverside, CA) using
mod-20
ified oil-free three-stage piston compressors (RIX industries, Mak and Brenninkmeijer, 1994). The sampling procedure includes low-pressure and high-pressure drying with DrieriteTM to prevent condensation of water in the sample cylinders. Zero tests show that the compressors produce less than 0.6 ppb of CO in the compression process, andCOlevels in the cylinders are stable over months, i.e. change for most cylinders
25
less than 1 ppb. CO is separated from the large air samples using a laboratory ex-traction system. First, the air is cleaned from condensable components, in particular
ACPD
2, 213–248, 2002Isotope variations of high northern latitude
surface CO T. R ¨ockmann et al. Title Page Abstract Introduction Conclusions References Tables Figures J I J I Back Close
Full Screen / Esc
Print Version Interactive Discussion
©EGS 2002
CO2,N2O and higher hydrocarbons, using high-efficiency, high-capacity Russian-Doll
cryogenic traps (Brenninkmeijer, 1991). Subsequently,COin the clean air matrix is ox-idized toCO2 on Sch ¨utze reagent (Brenninkmeijer and R ¨ockmann, 1997; R ¨ockmann,
1998; Sch ¨utze, 1949; Smiley, 1965) and theCO-derivedCO2 is collected in an all-glass
Russian Doll cryogenic trap (Brenninkmeijer and R ¨ockmann, 1996). The overall yield is
5
then determined in a calibrated manometer and theCO2 sample transferred to the
iso-tope ratio mass spectrometer (Finnigan MAT 252) for isoiso-tope analysis (δ13C andδ18O). After stable isotope determination, the remainder of the sample (> 90%) is recovered for14COand/or∆17O analysis.
This technique is a laborious but absolute method to determine the COmixing
ra-10
tio in air at ambient levels, i.e. it does not intrinsically require the use of a reference gas (Brenninkmeijer et al., 2001). Note that a recent intercomparison exercise has revealed a discrepancy between our absoluteCOconcentrations measurements and the NOAA/CMDL scale in the low concentration range (< 100ppb). Thorough tests have established the linearity of our system (Brenninkmeijer et al., 2001), and the
15
NOAA/CMDL scale is presently being examined in detail (P. Novelli, personal com-munication). Above 100 ppb the scales agree well. The reproducibility of our system is better than 1% routine operation, and the absolute precision is better than 2%. The isotopic composition is determined with a standard deviation of±0.2‰ and±0.3‰ for
δ13C andδ18O, respectively, including sampling, preparation and mass spectrometry.
20
The 14C/12C ratio of the sample is determined by Accelerator Mass Spectrometry (AMS) after dilution of the small samples with nearly14C-freeCO
2 and preparation of
a target for AMS from the diluted sample by graphitization (Rom et al., 2000). The overall precision of the experimental procedure including sampling, extraction of CO
as CO2, dilution, preparation of a sample for AMS, and AMS measurement amounts 25
to 0.27 molec.cm−3 of air at standard temperature and pressure. An additional error arises due to production of 14CO in the sample cylinders during storage, as recog-nized recently (Lowe and al, 2002). For storage times of the order of months, the neutron capture reaction14N(n,p)14C, followed by oxidation of14Cto14COleads to
non-ACPD
2, 213–248, 2002Isotope variations of high northern latitude
surface CO T. R ¨ockmann et al. Title Page Abstract Introduction Conclusions References Tables Figures J I J I Back Close
Full Screen / Esc
Print Version Interactive Discussion
©EGS 2002
negligible production of14COin high pressure cylinders even at ground level (Lowe and
al, 2002; Mak et al., 1999). The production depends not only on the storage time, but also on altitude, latitude and on the actual storage location. To correct for this effect, the global average14Cproduction rate from (Lingenfelter, 1963) was normalized to the
measured14COproduction rate from a cylinder exposure experiment in Antarctica (Mak
5
et al., 1999). The correction amounts to approximately 0.44 molec.cm−3 per month of storage at ground level at 80◦N. For our sample cylinders, which are shipped approxi-mately every 2 to 5 months from the sampling stations and then analyzed within about two weeks when they arrive at the lab, the average correction is 1.1 molec.cm−3.
The 17O content of a CO-derived CO
2 sample cannot be determined on the CO2 10
molecule directly, because both,13C-substituted and17O-substitutedCO2 have
molec-ular mass 45 and cannot be resolved on a conventional isotope ratio mass spectrome-ter. Therefore, an aliquot of the sample is converted toO2 using a recently developed
two-step conversion system (Brenninkmeijer and R ¨ockmann, 1998a). After conversion,
δ17O andδ18O can be determined independently by monitoring theO+2 ions (mass 32,
15
33 and 34) in the mass spectrometer. Due to a small mass-dependent fractionation during the conversion, the individual δ17O and δ18O values have a reproducibility of only 1 and 2‰, respectively, but as these variations are correlated,∆17O can be de-termined with a standard deviation better than 0.2‰.
3. Data presentation and analysis 20
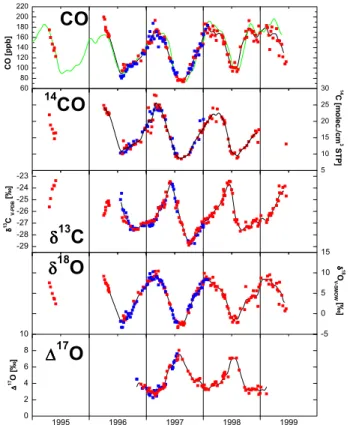
TheCO concentration and isotope records for the two high northern latitude stations Spitsbergen (Norway, 78.5◦N, 11.5◦W, 475 msl) and Alert (Canada, 81.3◦N, 62.3◦W, 210 msl) are shown in Fig. 1. Sampling at the Zeppelinfjellet mountain in Ny ˚Alesund, Spitsbergen, started during the spring 1995 and 1996 ARCTOC campaigns (Barrie and Platt, 1997), at that time specifically in search for 13CO variations during tropo-25
spheric ozone depletion events (R ¨ockmann and Brenninkmeijer, 1997; R ¨ockmann et al., 1999a) caused by production of extremely depletedCOvia the reactionCH4 +Cl
ACPD
2, 213–248, 2002Isotope variations of high northern latitude
surface CO T. R ¨ockmann et al. Title Page Abstract Introduction Conclusions References Tables Figures J I J I Back Close
Full Screen / Esc
Print Version Interactive Discussion
©EGS 2002
(see Sect. 3.2). From July 1996 to June 1999, weekly samples were taken on a regular basis by the Norwegian Polar Institute at the Zeppelinfjellet station. In Alert, sampling started in July 1996 and samples were taken approximately weekly until January 1998. 3.1. Seasonal variation
3.1.1. COmixing ratio
5
COmixing ratios at Spitsbergen and Alert are very similar and exhibit a pronounced seasonal cycle with high values in late winter (≈180 ppb) and a minimum in summer (≈80 ppb). This strong seasonal cycle is the result of the relatively short lifetime of
COof the order of weeks to months. On the one hand this is short enough to produce a strong peak to peak amplitude, on the other hand it is long enough to be only little
10
influenced by short time fluctuations at these remote stations, which results in a rather smooth seasonality. The similarity between the Spitsbergen and Alert record shows that the remote high northern latitudes are well-mixed with respect toCO; several Arc-tic stations show similar COmixing ratios throughout the year (Novelli et al., 1994b, 1998). Figure 1a also shows theCOtime series from Spitsbergen and Alert from the
15
NOAA/CMDL air-sampling network. The data from the two groups show a good agree-ment. However, the data at the very beginning of our continuous record for Spitsbergen (summer 1996) do not quite capture the seasonal minimum as seen in the record for Alert.
The CO seasonal cycle is to a large degree driven by its main sink, i.e. reaction
20
withOH. WhenOHlevels are low throughout the fall and winter period, CObuilds up in the high northern latitude boundary layer, and mixing ratios of about 180 ppb are reached in early spring (Fig. 1a). ThisCOmust originate from the industrial regions at mid-northern latitudes, because there are no in situ COsources at the high latitudes in winter. Due to reduced convection in the absence of surface heating, mixing with
25
the free troposphere is limited, which results in vertically decreasingCOmixing ratios, as has been established by Conway et al. (1993). Recently, Yurganov et al. (1998)
ACPD
2, 213–248, 2002Isotope variations of high northern latitude
surface CO T. R ¨ockmann et al. Title Page Abstract Introduction Conclusions References Tables Figures J I J I Back Close
Full Screen / Esc
Print Version Interactive Discussion
©EGS 2002
published correlated surface and total columnCOmixing ratio measurements revealing that surface values are about 50 ppb higher than average total column values during Arctic winter and spring.
WhenOHformation starts again after polar sunrise, the mainCOsink regains mo-mentum andCOmixing ratios rapidly decline towards the late summer minimum near
5
80 ppb (Fig. 1a). However, it has already been argued (R ¨ockmann and Brenninkmeijer, 1997) that the in situ destruction of COat OHlevels below 105molec.cm−3 in March and April at 80◦N (Spivakovsky et al., 2000) is insufficient to cause this rapid CO
destruction. Even in a closed box without any sources, OH levels between 2 and
3 × 10⁵molec.cm−3 would be required to produce the observed CO decrease. This
10
confirms that in spring not only chemical destruction causes the fast observedCO de-crease. AsCOis lower and decreases earlier at lower latitudes, mixing with and import of these air masses leads to a dilution of the high northern latitudeCOinventory. Thus,
COthat was temporarily stored at the high northern latitudes over winter is transported in spring to lower latitudes again where it is eventually removed. Also mixing with the
15
free troposphere leads to a reduction of the wintertime verticalCO gradient over the Arctic, and by the end of May this gradient has disappeared and the troposphere is vertically well mixed again as regardsCOlevels (Yurganov et al., 1998).
During spring and summer, not only the dominantCOsink process gains importance, but alsoCOemissions from natural sources both direct (e.g. biomass burning) and
indi-20
rect, via oxidation of hydrocarbons andCH4, increase. The seasonality of these natural COsources also affects the level of the COseasonal minimum, which is determined by the competition between theCO+OHsink process and the combined contributions from all sources.
3.1.2. 14CO 25
As with the COrecord, the 14COtime series from Alert and Spitsbergen agree fairly
well (Fig. 1b). 14CO values peak at about 25 molec./cm3 in late winter and bottom out in summer at values around 9 molec./cm3. The seasonal variations of 14COand CO
ACPD
2, 213–248, 2002Isotope variations of high northern latitude
surface CO T. R ¨ockmann et al. Title Page Abstract Introduction Conclusions References Tables Figures J I J I Back Close
Full Screen / Esc
Print Version Interactive Discussion
©EGS 2002
generally follow a very similar pattern, asOHis their primary sink. However, the simi-larity of the two seasonal cycles cannot be assumed a priori, because both molecules have a very different source distribution, and it is useful to recall the principle factors that influence14COabundance before examining the data in detail.
14COis primarily produced from cosmic radiation in the lower stratosphere and upper 5
troposphere. This14COproduction has no seasonal component, but it is modulated by
the 11-year solar cycle, because the solar wind reduces the ability of galactic cosmic ray particles to penetrate the Earth’s magnetic field. Consequently the production of
14COis high during a solar minimum and low during a solar maximum. This inverse
modulation of 14CO production by variable solar activity amounts to ±15% (J ¨ockel, 10
2000). On short time scales, however, primary14COproduction can be regarded as constant and seasonal variations in cosmogenic14COat ground level can only result
from variations in transport orOHlevels. An additional14COsource in the troposphere
is biogenicCO, which chiefly stems from oxidation of biogenicCH4and VOCs, and from
biomass burning. This14Chas been circulated through the atmosphere, soils and the 15
terrestrial and marine biosphere as part of the global carbon cycle, and can therefore be regarded as “recycled”14C. When assigning a modern14C content of 120 pMC to these biogenic sources, 10 ppb of recycledCOcorresponds to 0.38 molec./cm3 14CO
(Brenninkmeijer, 1993). Note thatCOhas a higher specific activity than all other atmo-spheric carbonaceous trace compounds; the14C level ranges from 400 to 1000 pMC.
20
Therefore, an addition of biogenic, i.e. recycledCOto the atmosphericCOcontent pri-marily increasesCOmixing ratios, whereas the effect on14COis much less. Finally,CO
from fossil fuel combustion processes contains no14CO, and thus contamination of a givenCOreservoir withCOfrom that source can significantly changeCOlevels without direct effect on the14COconcentration, as has been shown repeatedly (Brenninkmeijer, 25
1993; Gros et al., 2001).
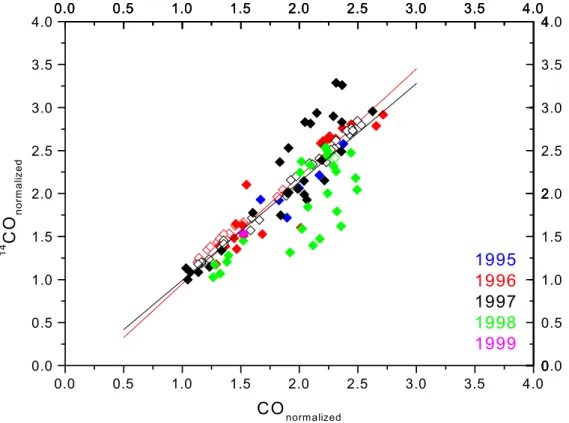
To examine relative differences betweenCOand14COin the records, we have nor-malized the14CO andCOvalues by dividing each measured value by the lowest
ACPD
2, 213–248, 2002Isotope variations of high northern latitude
surface CO T. R ¨ockmann et al. Title Page Abstract Introduction Conclusions References Tables Figures J I J I Back Close
Full Screen / Esc
Print Version Interactive Discussion
©EGS 2002
shown in Fig. 2. Apart from the generally good correlation, clear deviations are dis-cernible. In particular the extraordinarily high CO values in the second half of 1998 (see Sect. 3.3.1) show up below the linear fit line. To eliminate the influence of the strong 1998COanomaly as well as several high 14COvalues that occurred in 1997,
a separate fit has been applied to the 1996 data only, which show relatively little
vari-5
ability. The linear fit through all data has a slope of1.14 ± 0.05, the slope of the 1996 fit is1.25 ± 0.10, i.e. the relative annual variation of14COis significantly larger (15 to
25%) than that ofCOitself. Both molecules share the same sink, therefore the differ-ence must be due to differdiffer-ences in the sources. In summer, the important biogenic
COsources (CH4and VOC oxidation) have a much smaller effect on14COthan onCO. 10
This addition of biogenicCOoccurs during the annual minimum ofCOand14CO, and consequently it diminishes the range of annual variation ofCOrelative to that of14CO,
which can result in the observed slope> 1. Thus, the relationship between14COand CO contains interesting information about these difficult to quantify sources, but 3D modeling is needed to investigate this issue in detail.
15
3.1.3. δ13C
Due to the kinetic isotope effect in the reactionCO+OH, theOHsink induces a varia-tion inδ13C:OHpreferentially removes12COover13CO, and the remainingCObecomes enriched in 13C. The kinetic fractionation is strongly pressure dependent and has an
average strength of 4 to 5‰ in the lower troposphere (R ¨ockmann et al., 1998b; Smit et
20
al., 1982; Stevens et al., 1980). Consequently in spring, whenCOlevels decrease after the seasonal maximum,δ13C rapidly rises from values of around−27‰ up to−23‰
within three months (Fig. 1c). In contrast to all other signals, however, the springtime trend does not persist throughout the summer but reverses already in early June. This reversal of the trend forδ13C must be a due to a source effect. Clearly, this source must
25
be strongly depleted in13Crelative to ambient COso that it can effectively counteract
the kinetic fractionation, and it must gain relative importance in summer.
ACPD
2, 213–248, 2002Isotope variations of high northern latitude
surface CO T. R ¨ockmann et al. Title Page Abstract Introduction Conclusions References Tables Figures J I J I Back Close
Full Screen / Esc
Print Version Interactive Discussion
©EGS 2002
products has a source value of about−52‰, a very low value compared the other major
COsources withδ13C signatures near −27‰, the typical 13C value of biomass. With atmosphericCH4 levels being nearly constant at about 1700 ppb, the source strength
ofCO from CH4 oxidation depends on OH levels, i.e. at high northern latitudes it is
negligible in winter and peaks in summer. As explained above, the same applies to the
5
sink ofCO. Thus, although much moreCO is formed from CH4 oxidation in summer
than in winter, in summer this amount is also quickly removed again. Assuming an atmosphere in whichCH4 oxidation is the onlyCOsource, theCO cycle can be simply
described in a box model by
CH4
kCH4+OH
−→ COkCO+OH−→ CO2 (R1)
10
and theCOmixing ratio is then given as
[CO] [CH4]
= kCH4+OH kCO+OH
(1)
Regarding [CH4] as constant, the equilibrium CO mixing ratio is determined by the
ratio of the rate constants and is not a function of OH levels. The rate constant
kCO+OH= 1.5 × 10−13× (1 + 0.6patm)(DeMore et al., 1997) is dependent on pressure, 15
but shows almost no temperature dependence at atmospheric pressure (Fulle et al., 1996). Therefore,kCO+OHcannot cause notable seasonal variations in [CO]. However, kCH4+OH, is strongly temperature dependent(kCH4+OH= 2.45 × 10⁻¹²× exp(−1775/T),
DeMore et al., 1997). Thus the seasonal atmospheric temperature variations do result in lower equilibriumCO mixing ratios in winter than in summer. As CO contributions
20
from different sources can be treated as independent, Eq. (1) still applies to theCH4
derivedCOfraction in the natural atmosphere. Thus, the absolute amount ofCOfrom in situCH4 oxidation in the troposphere depends on temperature, as indicated in Table 2,
and is higher in summer than in winter at high latitudes.
The degree to which this CH4 derived CO affects the isotopic composition of the 25
ambientCOinventory, however, is determined by the relative, not the absolute contri-bution ofCH4 derived CO. Given the strongCOseasonality at high northern latitudes,
ACPD
2, 213–248, 2002Isotope variations of high northern latitude
surface CO T. R ¨ockmann et al. Title Page Abstract Introduction Conclusions References Tables Figures J I J I Back Close
Full Screen / Esc
Print Version Interactive Discussion
©EGS 2002
the relative contribution ofCH4derivedCOincreases considerably from about 8%
win-ter (14.3 ppb in a total of ≈180 ppb CO at the low winter temperatures, Table 2) to about 29% in summer (23.4 ppb in a total of≈80 ppbCOat moderate summer temper-atures, Table 2).CH4-derivedCOis about 25‰ depleted inδ13C relative to the ambient CO, and the additional 21% of thisCOwill deplete the atmosphericCOpool by≈5‰.
5
This depletion counteracts the kinetic isotope effect in the reaction CO + OH, which itself should lead to an enrichment of≈5‰ forCO decreasing from winter maximum to summer minimum values (ratio of mixing ratios approximately1/e). Thus, in early summer the increasing fraction of strongly depletedCOfromCH4 oxidation eventually
outweighs theδ13C increase due to the kinetic isotope effect in the reactionCO+OH,
10
and considerably drives down ambientδ13C values. Apparently the extent of the de-pletion due to theCH4oxidation source is slightly larger than the enrichment due to the
kinetic isotope effect, as in late summer the overall effect is a moderate depletion of
δ13C relative to the late winter values.
In fall and winter, theOHbased sink loses importance. Hence, changes in the CO 15
isotopic composition are increasingly less influenced by the kinetic fractionation, but rather reflect the input from the sources. During that time, CO sources shift more and more from natural sources towards combustion sources, as witnessed by theδ18O variations (see below). Forδ13C, ambient values in fall are close to the expected source signature from combustion sources of−27‰, except for the very clean year 1997 (see
20
Sect. 3.3.2). Consequently, theδ13C value is relatively constant for the rest of the year until spring, whenCOlevels decrease again.
3.1.4. δ18O
Even more thanδ13C, δ18O is strongly affected by the kinetic isotope fractionation in
CO + OH. This reaction involves an inverse isotope effect of about −10‰ for 18O,
25
i.e. here C18O is removed 10‰ faster by OH than C16O (R ¨ockmann et al., 1998b;
Stevens et al., 1980). Accordingly, after the seasonal maximum near 11‰ in early spring, δ18O declines quickly concomitant with the strong CO decline (Fig. 1d). In
ACPD
2, 213–248, 2002Isotope variations of high northern latitude
surface CO T. R ¨ockmann et al. Title Page Abstract Introduction Conclusions References Tables Figures J I J I Back Close
Full Screen / Esc
Print Version Interactive Discussion
©EGS 2002
contrast to δ13C, this trend persists until the end of July. Here the increasing CH4
-based source has virtually no effect, because the δ18O value of CH4 derived CO is
close to the ambient summer level. Note, however, that the δ18O values of the CH4
and NMHC oxidation sources are not well known yet. Our first attempt to determine this source signature (Brenninkmeijer and R ¨ockmann, 1997) is based on an estimate
5
using southern hemisphere isotope data, from which it is clear thatδ18O(CO) fromCH4
oxidation must be low (around 0‰, cf. Table 1), and a 3-D inverse modeling study (Bergamaschi et al., 2000a) yielded even lower values.
The δ18O seasonal minimum is reached in July/August at values around −3‰. In fall and winter, two processes contribute to the increasingδ18O trend. First, the kinetic 10
fractionation inCOdestruction loses importance asOHlevels decrease. Second,CO
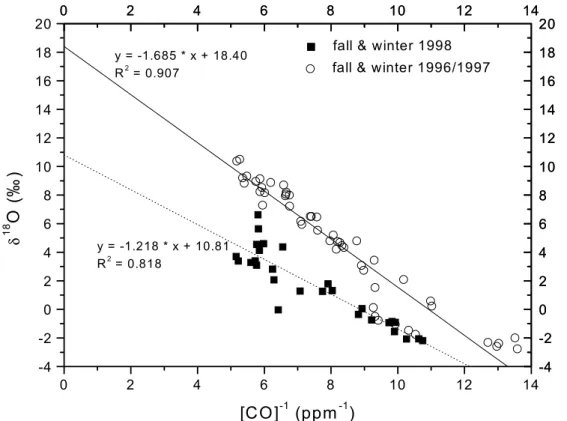
sources shift from isotopically light natural sources towards isotopically heavy combus-tion sources. δ18O is plotted vs. the inverseCOmixing ratios in Figure 3. In a simple
two-component system where a background reservoir withδ-valueδbg and mixing ratio χbgis contaminated by a single source withδ-valueδsand mixing ratioχs, the observed 15
delta value is the weighted mean of the twoδ-values
(χbg+ χs) ∗ δobs= χbg∗ δbg + χs∗ δs. (2)
Thus, whenδobsis plotted versus(χbg+χs)−1the value of they-axis intercept (infinite
contamination, i.e. (χbg+ χs) → ∞) corresponds to the isotopic signature of the
con-taminating sourceδs. Note that kinetic fractionation in the sinks has been neglected in 20
this calculation, although it is clear that also the contaminatingCOwill be fractionated in its reaction withOH. As the kinetic fractionation is negative for18O, the intercept will actually be a lower limit for the actual source signature. The linear fit to the fall and winter data from 1996 and 1997 has an intercept at 18.4 ± 0.7‰, only slightly lower than the source signature for high temperature combustion processes (Table 1). Thus
25
the admixture is with fairly unmodifiedCOfrom combustion origin. The anomalous be-havior in 1998 will be discussed in Sect. 3.3.1. In the atmosphere, the strong winter
ACPD
2, 213–248, 2002Isotope variations of high northern latitude
surface CO T. R ¨ockmann et al. Title Page Abstract Introduction Conclusions References Tables Figures J I J I Back Close
Full Screen / Esc
Print Version Interactive Discussion
©EGS 2002
to theδ13C variations is that in the case of δ18O, the isotopic fractionation caused by the dominant source signature (fossil fuel combustion) and the kinetic isotope effect in
COdestruction are in phase, whereas forδ13C they counteract each other. 3.1.5. ∆17O
It has been discovered recently (Hodder et al., 1994; Huff and Thiemens, 1996, 1998;
5
R ¨ockmann et al., 1998a, b) that atmosphericCO possesses a significant 17O excess
above what is expected based on its18Ocontent. This anomalous fractionation pattern is often referred to as mass-independent fractionation because it deviates from the general mass dependent relationship approximated by δ18O = 0.52 × δ17O, which is expected from the established theories for common isotope fractionation. In the case
10
of several atmospheric trace gases, among themCO, a deviation from this relationship has been observed, and the17Oexcess is quantified in terms of∆17O≡ δ18O−0.52 × δ17O. Figure 1e shows the extent of the17Oexcess of atmosphericCOat high northern latitudes. The strong seasonal signal is clearly anticorrelated to theCO mixing ratio, and ∆17O values vary between 2‰ during the winter minimum and 8‰ during the
15
summer maximum.
It has been shown that the mass independent fractionation in atmosphericCO origi-nates from two processes. One is the production ofCOfrom ozonolysis of unsaturated hydrocarbons (e.g. isoprene) in the atmosphere. The oxygen in theCOproduct is de-rived from the ozone precursor, and possesses the strong17O excess (R ¨ockmann et 20
al., 1998a) that is also found inO3 (Krankowsky et al., 1995). The dominating effect
is however that the fractionation in theCOsink reaction with OHis mass independent (R ¨ockmann et al., 1998b). As mentioned above, the rate constant for reaction with
OHis 10‰ faster for C18O thanC16O. For a strictly mass dependent fractionation, the
rate constant for C17Oshould then be about 5‰ faster, but in fact it is only about 1‰
25
faster, i.e. very close toC16O. Thus, in the reaction withOHthe remainingCO accumu-lates excess17O with a pseudo-fractionation constant for ∆17O of 4–5‰ (R ¨ockmann
ACPD
2, 213–248, 2002Isotope variations of high northern latitude
surface CO T. R ¨ockmann et al. Title Page Abstract Introduction Conclusions References Tables Figures J I J I Back Close
Full Screen / Esc
Print Version Interactive Discussion
©EGS 2002
(Fig. 1e). Also the shape of the ∆17O seasonal cycle supports the thesis that the mass independent fractionation in theOHsink is the dominant factor causing the mass independent anomaly. WhenCOlevels decrease in spring, the remainingCOgets pro-gressively enriched in17O and reaches a seasonal maximum whenCO mixing ratios
are lowest in summer. The total decrease ofCOfrom the winter maximum at 180 ppb
5
to the summer minimum at 80 ppb corresponds to a reduction of CO to about 40%, i.e. leaving a fraction of close to1/e. The concurrent observed isotopic enrichment of about 5‰ is of the right magnitude.
In fall and winter, the reaction with OH loses importance and the atmospheric CO
reservoir is topped up withCOprimarily from combustion sources, which is mass
de-10
pendently fractionated. This causes the observed decrease in ∆17O values. Indeed the correlation of∆17O versus inverseCOmixing ratio reveals that during fall and win-ter the data follow a dilution line that passes through zero, indicative of a dilution byCO
with∆17O = 0‰ (R ¨ockmann et al., 1998a). This is in agreement with our finding that theδ18O value of the winter COsource is close to 23‰, i.e. COreaching the
observa-15
tory in winter is isotopically fairly unmodified, and must originate to a large degree from fossil fuel combustion at mid to high latitudes.
3.2. Short term variability
As mentioned above, short term variability is generally small for the two remote sam-pling locations, but occasionally the data exhibit some short-term deviation from the
20
general seasonal cycle. Five day 3D-back-trajectories have been calculated by the Atmospheric Environment Service, Canada, for the 1997 data. Using these, one can relate someCOand isotopic excursions to air mass origin, and two clear examples will be presented here. The Alert air sample from 20 March 1997 exhibits an extraordinar-ily lowCOmixing ratio. For this data point back trajectory analysis indicates advection
25
of clean northern Atlantic air from lower latitudes (Fig. 4a). Due to the latitudinalCO
gradient in winter and spring, advection of air masses from low latitudes should indeed lead to the observed lowCOmixing ratio. Furthermore, a concomitant slightly lowδ18O
ACPD
2, 213–248, 2002Isotope variations of high northern latitude
surface CO T. R ¨ockmann et al. Title Page Abstract Introduction Conclusions References Tables Figures J I J I Back Close
Full Screen / Esc
Print Version Interactive Discussion
©EGS 2002
value, also typical for lower latitudes, is observed.
A significant short-termCOincrease in the Spitsbergen record occurred on 26 Febru-ary 1997. The five day back trajectory shows that this air parcel was advected over major industrialized areas of western Russia (near the Caspian sea) 5 days prior to its arrival at Spitsbergen (Fig. 4b). This makes anthropogenic contamination a
plausi-5
ble cause of the highCO mixing ratio, and also theδ18O value shows a simultaneous
small elevation inδ18O, indicating contamination from combustion processes. There are several other instances of simultaneousCOandδ18O elevations, for which the ori-gin of the excursion is not as readily identifiable. The Alert samples from 17 January, 24 January and 13 February 1997, for example, show small18Oelevations. Here, the 10
air parcels passed 5 days before over or near the sparsely populated north eastern part of continental Russia. A similar trajectory was also derived for other samples that show no obvious contamination (e.g. on 13 February, 22 February or 5 March 1997 for Spitsbergen). Thus, theCOmixing ratio and isotopic composition can be a much more reliable indicator for anthropogenic contamination than the trajectory calculations.
15
Clearly, strongCOcontaminations can persist for more than five days in an air mass, and furthermore anthropogenicCOsources are often spatially confined to regions that cannot be resolved with trajectory analysis.
On the other hand, the short time variability of the signature that is usually most susceptible to contamination, δ18O, is relatively low in Spitsbergen and Alert for most
20
of the record, apart from the minor deviations as mentioned above. This is in sharp contrast to other sampling stations at lower latitudes (see e.g. Gros et al., 2001), where the18Ocomposition is often a clear indicator for air mass origin. The absence of strong short time δ18O fluctuations just confirm once more that the high northern latitude stations are remote from major anthropogenic sources. In most cases, the
25
observed signatures are not sensitive to the air mass origin. Thus, the data obtained in this study are representative for the entire high northern latitude region.
The short time variability in the14COrecord at Spitsbergen and Alert is particularly
ACPD
2, 213–248, 2002Isotope variations of high northern latitude
surface CO T. R ¨ockmann et al. Title Page Abstract Introduction Conclusions References Tables Figures J I J I Back Close
Full Screen / Esc
Print Version Interactive Discussion
©EGS 2002
We speculate that in particular the two very high values in 1997 may have been caused by stratospheric intrusions (Gros et al., 2001) during that time, because in winter the high northern latitude14CObackground level is already the highest observed near the surface, and even higher values can only originate from higher altitudes.
Generally,δ13C values rarely exhibit large scatter becauseCH4oxidation, the source 5
with the most prominentδ13C source signature, shows a very smooth seasonal evo-lution due to the long CH4 lifetime. The isotopic source values of the other major
sources are close to that of ambientCO, and even large emissions from these sources cannot produce strongδ13C signals, as witnessed during the 1998 COanomaly (see Sect. 3.3.1). Furthermore, theδ13C latitudinal gradient is not very strong in the northern
10
hemisphere, and consequently large scale advection also has little impact onδ13C. Nevertheless, there is one interesting class of short termδ13C variations that occurs during polar spring at the Arctic locations. The particular effect has been discussed in detail in R ¨ockmann et al. (1999a), and here it is summarized only. We detected characteristic small13Cdepletions at Spitsbergen during tropospheric ozone depletion
15
episodes in Arctic spring. During these episodes, surface ozone levels quickly decline from normal levels of about 40 ppb to values below the detection limit for several hours to days (Barrie and Platt, 1997). Concomitant to theseO3 depletions, theδ13C values
ofCO decrease by several tenths of a permil, and return back to background levels when ozone recovers (see Fig. 2 in R ¨ockmann et al., 1999a). These excursions in
20
δ13C are the result of small quantities of CO being formed according to the reaction
CH4+ Cl → . . . → CO+ products during ozone depletion events, which are associated
with elevated halogen radical levels (mostlyBr, but alsoCl). In addition toCH4 being
already depleted in13C relative to CO, the large isotope effect of 70‰ in the reaction
CH4 + Cl (Saueressig et al., 1995) leads to formation of COwith aδ13C value that is 25
almost 100‰ below that of ambientCO. Thus, even a small addition of about 1 ppb
COfrom this source can significantly alter the13Ccontent of the ambientCOcontent. This effect has not only been shown qualitatively, but the degree of the 13C depletion
ACPD
2, 213–248, 2002Isotope variations of high northern latitude
surface CO T. R ¨ockmann et al. Title Page Abstract Introduction Conclusions References Tables Figures J I J I Back Close
Full Screen / Esc
Print Version Interactive Discussion
©EGS 2002
encountered. The results imply thatCl levels must have been3 − 7 × 10⁴molec./cm3
over the typical duration of the halogen elevations of about three days (R ¨ockmann et al., 1999a). Thus, theδ13C excursions are a sensitive measure forCllevels that cannot be measured directly, and the results are in agreement with indirect estimates based on hydrocarbon destruction patterns (Ramacher et al., 1999).
5
3.3. Interannual variation 3.3.1. Summer-fall 1998
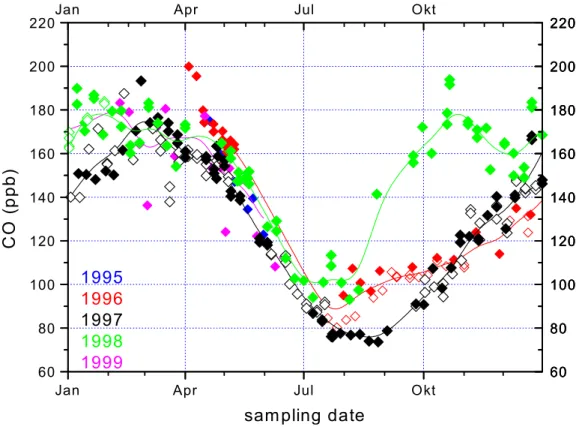
Superimposed on the typical seasonal cycle, interannual variability is evident in the
COdata, especially for the summer minimum, as shown in detail in Fig. 5. The most prominent interannual feature is the elevated and surprisingly narrow CO minimum
10
in 1998. From the beginning of July, COlevels do not fall further, and the common minimum values in August are never reached during that summer. Rather,COalready starts increasing rapidly in August 1998, one to two months earlier than in the other years, and then shows an elevation of 20 to 50 ppb for several months. Recalling that the atmosphere at high northern latitudes is well mixed in summer, such a persistent
15
COexcess cannot be a local phenomenon but rather reflects a large-scaleCOanomaly in the entire high northern latitude region. Five-day back trajectories calculated for the samples during this period do not show a common air mass origin, which further indicates that the observedCOelevation was a large-scale phenomenon. On the other hand, no similar elevations have been detected at our mid-latitude sampling station
20
Mount Sonnblick in the Austrian Alps (Gros et al., 2001); thus the effect appears to be confined to the high northern latitudes.
Interestingly, the strongCOelevation in summer 1998 even leads to a double shoul-der during the 1998/1999 seasonal maximum. This feature is indicative of an additional strongCOsource that is out of phase with theCOseasonal cycle, and it is clearly
dis-25
cernible both in our data and the NOAA/CMDL data. After the quick rise in August, mixing ratios actually decrease again in November, whenCOusually increases due to
ACPD
2, 213–248, 2002Isotope variations of high northern latitude
surface CO T. R ¨ockmann et al. Title Page Abstract Introduction Conclusions References Tables Figures J I J I Back Close
Full Screen / Esc
Print Version Interactive Discussion
©EGS 2002
lowOHlevels. The decrease must be due to dynamics, i.e. dilution of theCOexcess by mixing with air from lower latitudes. The double shoulder in the observations con-fines the duration of the additionalCOsource to a period between July and November 1998, slightly delayed to the typical biomass burning season between May and Octo-ber. During the spring 1999 maximum, values have recovered almost entirely and are
5
only slightly above the maximum in 1998.
Among the majorCOsources, large scale biomass burning is the only one that can be expected to produce such vast quantities ofCOfor extended periods of time. Indeed, 1998 was an extreme fire year throughout the high northern latitude boreal forest re-gion and the extent of biomass burning even reached catastrophic dimensions in some
10
parts. With a total of 4.7 million hectares burnt in Canada, 1998 is among the five worst years regarding forest fires, whereas only 625 000 and 1.9 million hectares were burnt by wildfires in 1997 and 1996, respectively, the two other burning seasons covered by our study (Johnston, 1999). For Russia, only 2.65 million hectares of burnt forest have been officially reported in 1998, but recent satellite imagery has exposed that the actual
15
area burnt in Russia in 1998 may have been as high as 10 million hectares (Kasishke et al., 1999). In the three major regions (Khabarovsk, Amur, Sakhalin Island), 4% of the entire land area burned. Furthermore, the satellite observations revealed that most of these fires were crown fires, which have recently been shown to emit particularly high amounts ofCO(Cofer III et al., 1998). In 1998, boreal forest fire emissions were
20
detected even in the stratosphere: A substantial increase in aerosols stemming from boreal forest fires was detected in the stratosphere during the biomass burning season between May and October at latitudes between 55◦N and 70◦N (Fromm et al., 2000). It has been shown thatCOfrom biomass burning can significantly influence atmospheric
COmixing ratios in Russia on large scales (Bergamaschi et al., 1998; Crutzen et al.,
25
1996; R ¨ockmann et al., 1999b), thatCOfrom Canadian forest fires can affect concen-trations even in the southern United States (Wotawa and Trainer, 2000) and in the free troposphere above northwestern Europe (Forster et al., 2001; Waibel et al., 1999), and that forest fires can increase the entireCOcolumn over Russia (Yurganov et al., 1997).
ACPD
2, 213–248, 2002Isotope variations of high northern latitude
surface CO T. R ¨ockmann et al. Title Page Abstract Introduction Conclusions References Tables Figures J I J I Back Close
Full Screen / Esc
Print Version Interactive Discussion
©EGS 2002
Thus, fire activity in the boreal forests of North America and Asia has far-reaching ef-fects on troposphericCOlevels in the whole high northern latitude region, and a recent evaluation of the NOAA/CMDL data shows a clear correlation of summer COminima and biomass burning (Wotawa et al., 2001). Both the NOAA/CMDL data and our data show that these high COlevels can persist for several months in the entire northern
5
part of the globe.
The18Oisotope data clearly confirm that the 1998COelevation observed in
Spitsber-gen was due to a particularly strongCObiomass burning contamination. At first sight, relatively little interannual variability is observed in theδ18O data (Fig. 1d). The strong COanomaly of 1998 is accompanied by only a minor increase inδ18O. However, the
10
correlation ofδ18O vs. 1/[CO] for 1998 yields a source signature of10.8 ± 0.9‰ (Fig. 3) much lower than in the other years. As discussed above, the intercept is actually a lower limit on the source signature, as the kinetic isotope fractionation in theOHbased sink has been disregarded in Eq. (2), but the value clearly points to biomass burning. The intercept near 11‰ compares well with results from Siberia derived for both strong
15
(Bergamaschi et al., 1998) and lesser contamination (R ¨ockmann et al., 1999b) withCO
from biomass burning. Recent laboratory experiments (Kato et al., 1999) have shown that theδ18O value ofCO emitted during biomass burning depends on the fire condi-tions, and is lower during the smoldering phase whenCOemissions are highest, than the burning phase. Our data can also be compared to results from a recent inverse
20
modeling exercise (Bergamaschi et al., 2000a) where source signatures for biomass burning were generally found to be around 10‰. However, this study predicted even lower values for biomass burning north of 30◦N, in some scenarios even around 0‰, which is not supported by our data.
Note that in Fig. 3 a few of the δ18O data points from the 1996/1997 seasons fall
25
on the line that is defined by the 1998 data. Figure 5 shows that during August and September 1996, CO summer values are higher than the 1997 data. Actually, it is exactly these data which fall on the “biomass burning-influenced” linear regression line of the 1998 data in Fig. 3. Although the effect is much smaller than in 1998, this
ACPD
2, 213–248, 2002Isotope variations of high northern latitude
surface CO T. R ¨ockmann et al. Title Page Abstract Introduction Conclusions References Tables Figures J I J I Back Close
Full Screen / Esc
Print Version Interactive Discussion
©EGS 2002
indicates that also the slightly elevatedCO values in 1996 were caused by biomass burning in the northern boreal forest. Thus, biomass burning has a critical influence on summer minimumCOvalues at high northern latitudes, as has been shown by (Wotawa et al., 2001).δ18O is a good indicator to detect year-to-year variability ofCOemissions from boreal forest burning at high latitudes.
5
From the two complete seasonal cycles now available we can for the first time exam-ine the interannual variability of∆17O. As explained above, the seasonal cycles ofCO
and∆17O are anticorrelated, because the major sink ofCO(reaction with OH) is the major source for∆17O. This behaviour is now even evident in the interannual pattern. The 1998 summer∆17O maximum is both much lower and more narrow than in 1997,
10
the opposite behavior than observed for theCOmixing ratio (Fig. 1). Furthermore, as soon as the strong anomalous increase ofCOstarts in 1998, the∆17O values show a concurrent strong decrease, and the entire winter 1998/1999 minimum is slightly lower than in 1997/1998. This again confirms that the large COelevation observed in the second half of 1998 is caused by mass dependently fractionated CO, in agreement
15
with the above explanation that thisCOoriginates from biomass burning. 3.3.2. Summer 1997
The second most significant interannual phenomenon is the exceptionally low and wide summerCOminimum in 1997, reaching values of merely 75 ppb. This feature also per-sisted for several months, indicating that these levels were characteristic for the entire
20
high northern latitudes in summer 1997. The most likely cause of the low summer minimum is that 1997 was indeed an exceptionally clean year regarding CO source emissions, which is supported by official statistics showing that biomass burning was low throughout the Russian and North American boreal forest in 1997 (Johnston, 1999; Kasishke et al., 1999; Wotawa et al., 2001). The 1997COanomaly has a large effect
25
on theδ13C signature during summer 1997, whenδ13C values reach almost−29‰. As shown above, theδ13C minimum is primarily determined by the relative fraction ofCH4
ACPD
2, 213–248, 2002Isotope variations of high northern latitude
surface CO T. R ¨ockmann et al. Title Page Abstract Introduction Conclusions References Tables Figures J I J I Back Close
Full Screen / Esc
Print Version Interactive Discussion
©EGS 2002
small deviations in this fraction can lead to significant isotopic shifts. The absolute amount ofCH4 derivedCO, however, should not exhibit large interannual variation as it
only depends on temperature (see above). In 1997, concomitant toδ13C alsoCO mix-ing ratios were low (Fig. 5), Thus, the absolute amount ofCOfrom sources other than
CH4 oxidation must have been lower in 1997 than in the other years, and the relative 5
fraction ofCH4 derived COwas consequently higher, causing the observed low δ13C
minimum. More quantitatively, the seasonalCO minimum was about 85 ppb in 1996 and 75 ppb in 1997. Keeping the absolute amount of the CH4 derived CO constant
at 23.4 ppb (Table 2), the relative contribution from this strongly depleted source was about 27.5% in 1996 and 31.2% in 1997, a change of≈4%. As the source signature
10
of the CH4 derived CO is about 25‰ lower than ambient values, this is of the right
magnitude to explain theδ13C depletion of 1–1.5‰ during the 1997 minimum.
For δ18O, the additional isotopic depletion that occurs for δ13C in summer 1997 is hardly recognizable. This does not come as a surprise, because the δ18O value of
CH4 derived CO is close to ambient summer levels. Forδ18O the main effect is not 15
the different relative amount ofCOfrom CH4 oxidation, but the fact thatCOhas been
broken down to slightly lower levels in 1997. However, the difference barely discernible above the experimental error. As regards14CO, the summer minimum in 1997 is low, as observed for theCOdata. Although the signal is too small to be evaluated quantitatively, this qualitatively supports the above interpretation that the excessCOobserved in other
20
years was produced from biogenic sources.
The 1997 summer ∆17O maximum was very high with values reaching up to 8‰ whenCOmixing ratios were extraordinary low. This is in line with the finding that the
OHbased sink is largely responsible for the seasonality in∆17O, i.e. in 1997 theCO
reservoir was reduced byOHto lower values than in 1998, and thus the remainingCO 25
ACPD
2, 213–248, 2002Isotope variations of high northern latitude
surface CO T. R ¨ockmann et al. Title Page Abstract Introduction Conclusions References Tables Figures J I J I Back Close
Full Screen / Esc
Print Version Interactive Discussion
©EGS 2002
4. Conclusions
The time series of CO mixing ratio and isotopic composition from Spitsbergen and Alert are virtually indistinguishable, showing that the high northern latitudes are a well-mixed reservoir as regardsCO. This is confirmed by the relatively smooth seasonality of all signatures with only few occurrences of significant short time variability. Mixing
5
of air between the mid and high northern latitudes plays an important role for the high northern latitudeCOseasonal cycle. In winter, large amounts ofCOfrom combustion processes are transported north from the industrial regions. In spring, the observed rapid decline ofCO cannot be due to in situ chemical destruction alone, but is also affected by transport down to lower latitudes again and/or vertical exchange with the
10
free troposphere.
A particularly strong, persistentCOelevation of 20 to 50 ppb occurred from July to November 1998. The δ18O isotope signature clearly identifies biomass burning as source of the massive source. This independent isotope evidence is in agreement with the reports about unusually strong forest fire activity throughout the boreal forest region
15
in 1998, and it underscores the crucial role of biomass burning for the CO summer minimum at high latitudes (Wotawa et al., 2001). The additional CO from the forest burning leads to strongly elevatedCOmixing ratios in the entire high northern latitude region for several months.
Summer 1997, on the other had, was extremely clean as regardsCOmixing ratios,
20
which also shows up in the isotope signatures. Again, the δ18O data indicate that the difference in theCOseasonal minimum between 1996 and 1997 was also due to biomass burning. Thus, biomass burning has a critical effect on summer minimumCO
values at high northern latitudes, and it can be detected using theδ18O signature. The data presented here show that monitoring of the isotopic composition ofCOat Alert and
25
Spitsbergen provides independent information on the causes of interannual variability ofCOin the northern hemisphere.
ACPD
2, 213–248, 2002Isotope variations of high northern latitude
surface CO T. R ¨ockmann et al. Title Page Abstract Introduction Conclusions References Tables Figures J I J I Back Close
Full Screen / Esc
Print Version Interactive Discussion
©EGS 2002
at the sampling stations in Spitsbergen and Alert, and we thank Torr Ivan Karlsen, Jan H. Wasseng, Chris R. Lunder and Jan-Ivar Tangen from the Norwegian Institute of Air Research and Kim Holmen from the University of Stockholm, and Korb Whale, Jacinta McNairn, Geoff Jones, Steve Mercer, Peter Ayranto and Christian Piller from the Alert station. Ingeborg Levin from the University of Heidelberg was very helpful in setting up the air sampling in Alert. We also
5
thank Doug Worthy and Victoria Hudec from the Atmospheric Environment Service, Toronto, Canada, for calculation of the back-trajectories. We are grateful to Paul Novelli for providing the records ofCO mixing ratios from Alert and Spitsbergen from the NOAA/CMDL network. Temperature data from Ny ˚Alesund were kindly provided by Siegrid Debatin from the Alfred Wegner Institute in Potsdam, Germany. The European Commission supported theCO-OH
-10
Europe project under grant ENV4-CT96-0318 and the Marie Curie Fellowship of V. Gros under grant EVK2-CT-1999-50003.
References
Barrie, L. A. and Platt, U.: Arctic tropospheric chemistry: An overview, Tellus, 49B, 450–454, 1997.
15
Bergamaschi, P., Brenninkmeijer, C. A. M., Hahn, M., R ¨ockmann, T., Scharffe, D. H., and Crutzen, P. J.: Isotope analysis based source identification for atmospheric CH4 and CO
across Russia using the Trans-Siberian railroad, J. Geophys. Res., 103, 8227–8235, 1998. Bergamaschi, P., Hein, R., Brenninkmeijer, C. A. M., and Crutzen, P. J.: Inverse modeling of the
globalCOcycle: 2. Inversion of13C/12Cand18O/16Oisotope ratios, J. Geophys. Res., 105, 20
1909–1927, 2000a.
Bergamaschi, P., Hein, R., Heimann, M., and Crutzen, P. J.: Inverse modeling of the globalCO
cycle: 1. Inversion ofCOmixing ratios, J. Geophys. Res., 105, 14 531–14 546, 2000b. Brenninkmeijer, C. A. M.: Robust, high efficiency, high-capacity cryogenic trap, Anal. Chem.,
63, 1182–1184, 1991.
25
Brenninkmeijer, C. A. M.: Measurement of the abundance of14COin the atmosphere and the 13C/12Cand18O/16Oratio of atmosphericCO, with application in New-Zealand and Antarctica,
J. Geophys. Res., 98, 10 595–10 614, 1993.
ACPD
2, 213–248, 2002Isotope variations of high northern latitude
surface CO T. R ¨ockmann et al. Title Page Abstract Introduction Conclusions References Tables Figures J I J I Back Close
Full Screen / Esc
Print Version Interactive Discussion
©EGS 2002
V.: Absolute measurement of the abundance of atmospheric carbon monoxide, J. Geophys. Res., 106, 10 003–10 010, 2001.
Brenninkmeijer, C. A. M. and R ¨ockmann, T.: Russian doll type cryogenic traps: Improved de-sign and isotope separation effects, Anal. Chem., 68, 3050–3053, 1996.
Brenninkmeijer, C. A. M. and R ¨ockmann, T.: Principal factors determining the18O/16Oratio of 5
atmosphericCOas derived from observations in the southern hemispheric troposphere and lowermost stratosphere, J. Geophys. Res., 102, 25,477–25 485, 1997.
Brenninkmeijer, C. A. M. and R ¨ockmann, T.: A rapid method for the preparation ofO2 from CO2for mass spectrometric analysis of17O/16Oratios, Rap. Commun. Mass Spectrom., 12,
479–483, 1998a.
10
Brenninkmeijer, C. A. M. and R ¨ockmann, T.: Using isotope analysis to improve atmosphericCO
budget calculations, in: International Symposium on Isotope Techniques in the Study of Past and Current Environmental Changes in the Hydrosphere and the Atmosphere, (Ed) Murphy, P., 69–77, International Atomic Energy Agency, Vienna, Austria, 1998b.
Brenninkmeijer, C. A. M., R ¨ockmann, T., Br ¨aunlich, M., J ¨ockel, P., and Bergamaschi, P.: Review
15
of Progress in Isotope Studies of Atmospheric Carbon Monoxide, Chemosphere: Global Change Science, 1, 33–52, 1999.
Cofer III, W. R., Winstead, E. L., Stocks, B. J., Goldammer, J. G., and Cahoon, D. R.: Crown fire emissions ofCO2,CO,H2,CH4, and TNMHC from a dense jack pine boreal forest fire,
Geophys. Res. Lett., 25, 3919–3922, 1998.
20
Conway, T. J., Steele, L. P., and Novelli, P. C.: Correlations among atmosphericCO2,CH4and COin the Arctic, March 1989, Atmos. Environ., 27, 2881–2894, 1993.
Crutzen, P. J., Golitsin, G. S., Elansky, N. F., Brenninkmeijer, C. A. M., Scharffe, D., Belikov, I. B., and Elokhov, A. S.: Observations of minor impurities in the atmosphere over the Russian territory with application of a railroad laboratory car, Dok. Russ. Acad. Sciences, 351, 1289–
25
1293, 1996.
Crutzen, P. J. and Zimmermann, P. H.: The changing photochemistry in the troposphere, Tellus, 43, 136–151, 1991.
DeMore, W. B., Sander, S. P., Golden, D. M., Hampson, R. F., Kurylo, M. L., Howard, C. J., Ravishankara, A. R., Kolb, C. E., and Molina, M. J.: Chemical kinetics and photochemical
30
data for use in stratospheric modeling, JPL Publication, 12, 1997.
Forster, C., Wandinger, U., Wotawa, G., James, P., Mattis, I., Althausen, D., Simmonds, P., O’Doherty, S., Jennings, S. G., Kleefeld, C., Schneider, J., Trickl, T., Kreipl, S., Jager, H.,
ACPD
2, 213–248, 2002Isotope variations of high northern latitude
surface CO T. R ¨ockmann et al. Title Page Abstract Introduction Conclusions References Tables Figures J I J I Back Close
Full Screen / Esc
Print Version Interactive Discussion
©EGS 2002
and Stohl, A.: Transport of boreal forest fire emissions from Canada to Europe, J. Geophys. Res., 106, 22 887–22 906, 2001.
Fromm, M., Alfred, J., Hoppel, K., Hornstein, J., Bevilacqua, R., Shettle, E., Servranckx, R., Li, Z., and Stocks, B.: Observations of boreal forest fire smoke in the stratosphere by POAM III, SAGE II, and lidar in 1998, Geophys. Res. Lett., 27, 1407–1410, 2000.
5
Fulle, D., Hamann, H. F., Hippler, H., and Troe, J.: High-pressure range of addition reactions of HO. II. Temperature and pressure dependence of the reaction HO +CO ↔HOCO → CO2, J.
Chem. Phys., 105, 983–1000, 1996.
Granier, C., M ¨uller, J. F., P ´etron, G., and Barsseur, G.: A three- dimensional study of the global
CObudget, Global Change Science, 1, 255–261, 1999.
10
Gros, V., Br ¨aunlich, M., R ¨ockmann, T., J ¨ockel, P., Bergamaschi, P., Brenninkmeijer, C. A. M., Rom, W., Kutschera, W., Kaiser, A., Scheel, H. E., Mandl, M., v. d. Plicht, J., and Possner, G.: Detailed analysis of the isotopic composition ofCOand characterization of the air masses arriving at Mt. Sonnblick (Austrian Alps), J. Geophys. Res., 106, 3179–3193, 2001.
Haan, D., Martinerie, P., and Raynaud, D.: Ice core data of atmospheric carbon monoxide
15
over Antarctica and Greenland during the last 200 years, Geophys. Res. Lett., 23, No. 17, 2235–2238, 1996.
Hodder, P. S., Brenninkmeijer, C. A. M., and Thiemens, M. H.: Mass independent fractionation in tropospheric carbon monoxide, ICOG proceedings, US Geological Circulair 1107, 1994. Huff, A. K. and Thiemens, M. H.: Multiple stable isotope analysis of atmospheric carbon
monox-20
ide: Continuing source identification using a mass independent anomaly, in Eos Trans. AGU, Fall Meet. Suppl. Abstracts, pp. F124, San Francisco, 1996.
Huff, A. K. and Thiemens, M. H.: 17O/16Oand18O/16Oisotope measurements of atmospheric
carbon monoxide and its sources, Geophys. Res. Lett., 25, 3509–3512, 1998.
J ¨ockel, P.: Cosmogenic14COas tracer for atmospheric chemistry and transport, Ph.D. thesis, 25
Universit ¨at Heidelberg, thesis electronically available at
http://www.ub.uni-heidelberg.de/archiv/1426, Heidelberg, 2000.
Johnston, T.: Canada Report, International Forest Fire News, 20, 1999.
Kasishke, E. S., Bergen, K., Fennimore, R., Sotelo, F., Stephens, G., Janetos, A., and Shugart, H. H.: Satellite imagery gives clear picture of Russia’s boreal forest fires, EOS Transactions
30
of the American Geophysical Union, 80, 141–147, 1999.
Kato, S., Akimoto, H., R ¨ockmann, T., Br ¨aunlich, M., and Brenninkmeijer, C. A. M.: Stable isotopic compositions of carbon monoxide from biomass burning experiments, Atmosph.
En-ACPD
2, 213–248, 2002Isotope variations of high northern latitude
surface CO T. R ¨ockmann et al. Title Page Abstract Introduction Conclusions References Tables Figures J I J I Back Close
Full Screen / Esc
Print Version Interactive Discussion
©EGS 2002
vironm., 33, 4357–4362, 1999.
Khalil, M. A. K. and Rasmussen, R. A.: Carbon monoxide in the earth’s atmosphere: indications of a global increase, Nature, 332, 242–245, 1988.
Khalil, M. A. K. and Rasmussen, R. A.: Atmospheric Carbon Monoxide: Latitudinal Distribution of Sources, Geophys. Res. Lett., 17, 1913–1916, 1990.
5
Khalil, M. A. K. and Rasmussen, R. A.: Global decrease in atmospheric carbon monoxide concentration, Nature, 370, 639–641, 1994.
Krankowsky, D., Bartecki, F., Klees, G. G., Mauersberger, K., Schellenbach, K., and Stehr, J.: Measurement of heavy isotope enrichment in tropospheric ozone, Geophys. Res. Lett., 22, 1713–1716, 1995.
10
Lingenfelter, R. E.: Production of carbon 14 by cosmic-ray neutrons, Rev. Geophys., 1, 35–55, 1963.
Lowe, D. C., Levchenko, V. A., Moss, R. C., Allan, W., Brailsford, G. W., and Smith, A. M.: Assessment of storage correction required for in situ14COproduction in air sample cylinders,
Geophys. Res. Lett., in press, 2002.
15
Mak, J. E. and Brenninkmeijer, C. A. M.: Compressed air sample technology for isotopic anal-ysis of atmospheric carbon monoxide, J. Atmos. Oceanic Technol., 11, 425–431, 1994. Mak, J. E., Brenninkmeijer, C. A. M., and Southon, J. R.: Direct measurement of the production
rate of14Cnear the Earth’s surface, Geophys. Res. Lett, 26, 3381–3384, 1999.
Novelli, P., Masarie, K. A., Tans, P. P., and Lang, P. M.: Recent changes in atmospheric carbon
20
monoxide, Science, 263, 1587–1589, 1994a.
Novelli, P. C., Collins, Jr., J. E., Myers, R. C., Sachse, G. W., and Scheel, H. E.: Re-evaluation of the NOAA/CMDL carbon monoxide reference scale and comparisons withCOreference gases at NASA-Langley and the Fraunhofer Institut, J. Geophys. Res., 99, 12 833–12 839, 1994b.
25
Novelli, P. C., Masarie, K. A., and Lang, P. M.: Distribution and recent trends in carbon monoxide in the lower troposphere, J. Geophys. Res., 103, 19 015–19 033, 1998.
Novelli, P. C., Steele, L. P., and Tans, P. P.: Mixing ratios of carbon monoxide in the troposphere, J. Geophys. Res., 97, 20 731–20 750, 1992.
Prather, M. J.: Time scales in atmospheric chemistry: Theory, GWPs forCH4 andCO, and 30
runaway growth, Geophys. Res. Lett., 23, 2597–2600, 1996.
Ramacher, B., Rudolph, J., and Koppmann, R.: Hydrocarbon measurements during tropo-spheric ozone depletion events: Evidence for halogen atom chemistry, J. Geophys. Res.,