HAL Id: hal-00304023
https://hal.archives-ouvertes.fr/hal-00304023
Submitted on 5 Mar 2008HAL is a multi-disciplinary open access
archive for the deposit and dissemination of sci-entific research documents, whether they are pub-lished or not. The documents may come from teaching and research institutions in France or abroad, or from public or private research centers.
L’archive ouverte pluridisciplinaire HAL, est destinée au dépôt et à la diffusion de documents scientifiques de niveau recherche, publiés ou non, émanant des établissements d’enseignement et de recherche français ou étrangers, des laboratoires publics ou privés.
Characterization of the South Atlantic marine boundary
layer aerosol using an Aerodyne Aerosol Mass
Spectrometer
S. R. Zorn, F. Drewnick, M. Schott, T. Hoffmann, S. Borrmann
To cite this version:
S. R. Zorn, F. Drewnick, M. Schott, T. Hoffmann, S. Borrmann. Characterization of the South Atlantic marine boundary layer aerosol using an Aerodyne Aerosol Mass Spectrometer. Atmospheric Chemistry and Physics Discussions, European Geosciences Union, 2008, 8 (2), pp.4831-4876. �hal-00304023�
ACPD
8, 4831–4876, 2008
Characterization of the South Atlantic
MBL aerosol S. R. Zorn et al. Title Page Abstract Introduction Conclusions References Tables Figures ◭ ◮ ◭ ◮ Back Close
Full Screen / Esc
Printer-friendly Version Interactive Discussion
Atmos. Chem. Phys. Discuss., 8, 4831–4876, 2008 www.atmos-chem-phys-discuss.net/8/4831/2008/ © Author(s) 2008. This work is distributed under the Creative Commons Attribution 3.0 License.
Atmospheric Chemistry and Physics Discussions
Characterization of the South Atlantic
marine boundary layer aerosol using an
Aerodyne Aerosol Mass Spectrometer
S. R. Zorn1,2, F. Drewnick1, M. Schott3, T. Hoffmann3, and S. Borrmann1,2 1
Max Planck Institute for Chemistry, Particle Chemistry Department, Mainz, Germany 2
University of Mainz, Institute for Atmospheric Physics, Mainz, Germany 3
University of Mainz, Institute of Inorganic and Analytical Chemistry, Mainz, Germany Received: 31 January 2008 – Accepted: 4 February 2008 – Published: 5 March 2008 Correspondence to: S. R. Zorn (zorns@mpch-mainz.mpg.de)
ACPD
8, 4831–4876, 2008
Characterization of the South Atlantic
MBL aerosol S. R. Zorn et al. Title Page Abstract Introduction Conclusions References Tables Figures ◭ ◮ ◭ ◮ Back Close
Full Screen / Esc
Printer-friendly Version Interactive Discussion
Abstract
Measurements of the submicron fraction of the atmospheric aerosol in the marine boundary layer were performed from January to March 2007 (Southern Hemisphere summer) onboard the French research vessel Marion Dufresne in the Southern At-lantic and Indian Ocean (20◦S–60◦S, 70◦W–60◦E). For chemical composition
mea-5
surements an Aerodyne High-Resolution-Time-of-Flight AMS was used to measure mass concentrations and species-resolved size distributions of non-refractory aerosol components in the submicron range.
Within the “standard” AMS compounds (ammonium, chloride, nitrate, sulfate, organ-ics) “sulfate” is the dominating species in the marine boundary layer reaching
concen-10
trations between 50 ng m−3
and 3 µg m−3
. Furthermore, what is seen as “sulfate” by the AMS seems to be mostly sulfuric acid. Another sulfur containing species that can ubiquitously be found in marine environments is methanesulfonic acid (MSA). Since MSA has not been directly measured before with an AMS, and is not part of the stan-dard AMS analysis, laboratory experiments needed to be performed in order to be able
15
to identify it within the AMS raw data and to extract mass concentrations for MSA from the field measurements. To identify characteristic air masses and their source regions backwards trajectories were used and averaged concentrations for AMS standard com-pounds were calculated for each air mass type. Sulfate mass size distributions were measured for these periods showing a distinct difference between oceanic air masses
20
and those from African outflow. While the peak size in the mass distribution was roughly 250 nm in marine air masses it was shifted to 470 nm in African outflow air. Correlations between the mass concentrations of sulfate, organics and MSA were calculated which show a narrow correlation for MSA with sulfate/sulfuric acid coming from the ocean but not with continental sulfate.
ACPD
8, 4831–4876, 2008
Characterization of the South Atlantic
MBL aerosol S. R. Zorn et al. Title Page Abstract Introduction Conclusions References Tables Figures ◭ ◮ ◭ ◮ Back Close
Full Screen / Esc
Printer-friendly Version Interactive Discussion
1 Introduction
Atmospheric research is a scientific field that has become more and more important in recent years. Still many processes taking place in the atmosphere are barely un-derstood. This is in particular true for the Ocean-Atmosphere System, where a lot of research is currently taking place (Meskhidze and Nenes, 2006). As everywhere in
5
the atmosphere aerosol particles are playing a substantial role in this system. Cur-rently, a focus is on how their formation is taking place and which gaseous compounds are participating in this process. The major source for marine boundary layer (MBL) aerosol particles in the super-micron size range is sea spray, and consequently these particles are mainly composed of sodium chloride. However, under certain conditions a
10
significant fraction of the sub-micron aerosol is of secondary origin. The mechanisms leading to particle formation and growth from the gas phase (gas-to-particle conver-sion) are yet not fully understood. One of the current ideas is that certain molecules are able to form thermodynamically stable clusters (Kulmala,2003). If these clusters grow into the nanometer size range, they can act as nucleation seeds for other organic
15
and inorganic vapors (M ¨akel ¨a et al.,2002). An important group of species involved in particle formation which are also most common species in atmospheric aerosol par-ticles are sulfur compounds. Furthermore, they are important for tropospheric cloud formation as cloud condensation nuclei (CCN), but also for polar stratospheric clouds which play a substantial role in stratospheric ozone depletion (Seinfeld and Pandis,
20
2006). Since the ocean is a large natural source for atmospheric sulfur, there is a deep interest in understanding the pathway of aerosol formation of these compounds after being emitted from the ocean into the MBL. Most of the sulfur in aerosol particles is available as sulfuric acid or, if neutralized, as sulfate. However, in coastal and oceanic environments sulfur is also present in organic compounds. One of the most common
25
organic sulfur compounds within these environments is dimethylsulfide (DMS), which is produced by phytoplankton and several types of anaerobe bacteria. DMS is accounting for approximately 75% of the global sulfur cycle with about 38–40 Gg y−1 of DMS
re-ACPD
8, 4831–4876, 2008
Characterization of the South Atlantic
MBL aerosol S. R. Zorn et al. Title Page Abstract Introduction Conclusions References Tables Figures ◭ ◮ ◭ ◮ Back Close
Full Screen / Esc
Printer-friendly Version Interactive Discussion
leased from the ocean into the atmosphere (Chasteen and Bentley,2004). According to current understanding, after being emitted into the marine boundary layer DMS will be oxidized mainly by hydroxyl radicals, finally resulting in the formation of several end products. From these products dimethylsulfoxide (DMSO), dimethylsulfone (DMSO2), and especially methanesulfonic acid (MSA) and sulfuric acid can be expected to
parti-5
tion into the particle phase (von Glasow and Crutzen,2004).
Investigation of the marine aerosol formation is one aim of the OOMPH project (Or-ganics over the Ocean Modifying Particles in both hemispheres, Sixth Framework Pro-gramme of the European Union). To characterize the aerosol in the remote and mostly pristine marine boundary layer within that project an Aerodyne High-Resolution
Time-10
of-Flight Aerosol Mass Spectrometer (HR-ToF-AMS) was operated during a ship cam-paign in the Southern Atlantic and Indian Ocean. The HR-ToF-AMS delivers quanti-tative data on non-refractory aerosol composition and species-resolved aerosol size distributions for the sub-micron particle size range. With its high sensitivity it is well suited for aerosol measurements in clean environments, such as the remote marine
15
boundary layer. The good temporal resolution of the data allows removal of measure-ments contaminated by ship exhaust without loosing excessive amounts of information. Several applications of aerosol mass spectrometry for the analysis of the marine boundary layer aerosol have been reported so far. Gieray et al. (1997) used LAMMS (Laser microprobe mass spectrometry) for the analysis of individual aerosol particles
20
collected in marine influenced clouds at Great Dunn Fell (Cumbria, UK). They did not only find cloud droplets nucleated on sea salt particles but also those formed on sulfate and methane sulfonate containing particles.
During the First Aerosol Characterization Experiment (ACE 1) in 1995Murphy et al.
(1998) used a laser ablation aerosol mass spectrometer (PALMS) stationed at Cape
25
Grimm (Tasmania) for on-line analysis of individual aerosol particles. Sea salt could be found in 90% of their particle spectra, but in some spectra of sulfate dominated parti-cles also indications for MSA were identified. Topping et al.(2004) used an Aerodyne AMS stationed at the Island of Jeju (Korea) for chemical characterization of the aerosol
ACPD
8, 4831–4876, 2008
Characterization of the South Atlantic
MBL aerosol S. R. Zorn et al. Title Page Abstract Introduction Conclusions References Tables Figures ◭ ◮ ◭ ◮ Back Close
Full Screen / Esc
Printer-friendly Version Interactive Discussion
during the ACE Asia campaign. The focus of this campaign was mainly the outflow from Asia. Still they did measure some marine influenced air masses which showed a strong variability and the highest AMS “sulfate” mass loadings during that period.
Another type of laser ablation aerosol mass spectrometer (ATOFMS) was used dur-ing the 2002 North Atlantic Marine Boundary Layer Experiment (NAMBLEX) at the
5
remote marine site at Mace Head, Ireland, for on-line characterization of individual aerosol particles (Dall’Osto et al.,2004). However, since the use of Laser ablation as ionization technique brings up some problems for the detection of sulfateDall’Osto et
al. (2004) did focus on sea salt, dust and carbonaceous particles. During this cam-paign an Aerodyne AMS was used at the same site byCoe et al.(2006). They found
10
that the submicron fraction of the measured marine aerosol was dominated by sulfate and organics with only little contributions from sea salt, which dominated the coarse mode.
For the 2002 New England air quality study an Aerodyne AMS was installed aboard a ship (Bates et al.,2005). The focus of these measurements was the chemical
char-15
acterization of the outflow from New England (USA), and not of marine aerosol com-ponents.
During the 2002 SOLAS SERIES measurement campaign in the sub-arctic North-ern Pacific Phinney et al. (2006) used a Q-AMS to characterize the marine aerosol during an iron enrichment experiment. In these measurements MSA was determined
20
and quantified from the mass spectra by estimating the non-MSA contributions to the signals where MSA fragments are expected and calculating the remaining MSA signal, similar to some of the calculations of standard AMS aerosol species (Allan et al.,2004). Here we are presenting results from one of the first uses of an on-line aerosol mass spectrometer for measuring the chemical aerosol composition of the remote marine
25
boundary layer in the Southern Hemisphere. For the first time MSA concentrations are directly determined from the high-resolution mass spectra. Furthermore, since the instrument was deployed on a ship crossing the Southern Atlantic Ocean, our mea-surements cover a large spatial area of the Southern Hemisphere.
ACPD
8, 4831–4876, 2008
Characterization of the South Atlantic
MBL aerosol S. R. Zorn et al. Title Page Abstract Introduction Conclusions References Tables Figures ◭ ◮ ◭ ◮ Back Close
Full Screen / Esc
Printer-friendly Version Interactive Discussion
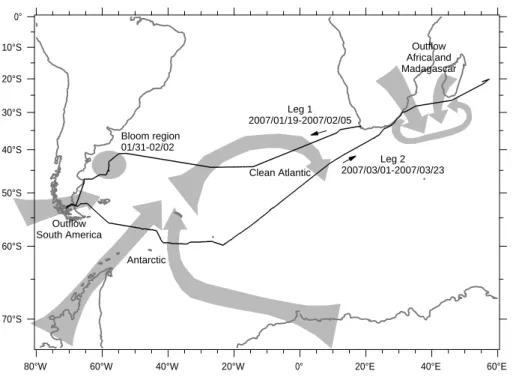
2 Overview over the 2007 OOMPH Southern Hemisphere cruise
The measurements of MBL aerosol were taken during the 2007 OOMPH Southern Hemisphere cruise in the 20◦
S to 60◦
S latitude band. The OOMPH project is investi-gating the organic chemistry of the ocean and the marine boundary layer with a focus on organic vapors and their influence on particle nucleation processes. The cruise
on-5
board the French research vessel Marion Dufresne took place in the Southern Atlantic Ocean and the Indian Ocean in the late Southern Hemisphere summer and early fall from January to March 2007 (Fig.1). The campaign was split into two parts, hereafter called leg 1 and 2. Leg 1 started at the 19th January in Cape Town (RSA). The Atlantic Ocean was crossed staying between 35◦
S and 45◦
S Latitude. Arriving at the coast
10
of South America the course shifted south towards the Magellan Street. In this area two phytoplankton blooms were crossed (31 January–2 February, 40◦
S–45◦ S, 55◦
W). After passing the Magellan Street the ship arrived at the 5th February in Punta Arenas (Chile) ending leg 1.
On 1 March the ship left Punta Arenas for leg 2 going further south (Fig.1). This time
15
the ship was cruising southeastwards near 60◦
S Latitude until 9 March, when it passed 24◦W Longitude. From that point on it was heading northeast towards Durban (RSA). After arriving near Durban on 18 March the ship proceeded towards the Mascarene Islands (Reunion, Mauritius). The campaign ended on 23 March near Reunion Island. The measurements during the 2007 Southern Hemisphere campaign covered a
20
large range of different parameters. The most common meteorological parameters were taken including sounding balloons; LIDAR measurements, but also flux measure-ments and calculations of air flow dynamics and turbulences around the ship and the inlets and probe systems were performed. Oceanic monitoring did include sampling of seawater several times a day for biological characterization as well as the
determi-25
nation of chemical and physical parameters, such as sea salinity, surface temperature and CO2concentrations. Gas phase measurements did include ozone, OH, HO2, RO2 and NOx concentrations as well as organic species like DMS, isoprene and
halocar-ACPD
8, 4831–4876, 2008
Characterization of the South Atlantic
MBL aerosol S. R. Zorn et al. Title Page Abstract Introduction Conclusions References Tables Figures ◭ ◮ ◭ ◮ Back Close
Full Screen / Esc
Printer-friendly Version Interactive Discussion
bons. Besides these on-line measurements additional air samples were collected in electropolished stainless steel canisters for subsequent VOC analysis at least twice a day.
For the particle phase characterization of the MBL filter samples were taken for chemical analysis as well as for morphological characterization by electron microscopy.
5
Particle number concentrations and size distributions were measured by optical meth-ods. The soluble part of the fine aerosol was measured with a Particle-into-Liquid-Sampler, coupled to an Ion Chromatograph (PILS-IC), the chemical composition of the submicron particle range with a High-Resolution-Time-of-Flight AMS, whose results are the topic of the current publication.
10
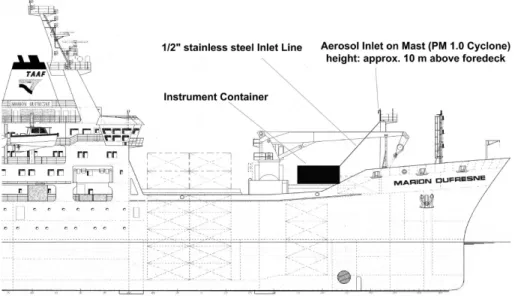
3 Instrumental setup and data quality assurance for the AMS
The AMS was located inside an air conditioned container on the deck of the ship (Fig.2). The aerosol was sampled with a PM1.0cyclone (URG-2000-30EHB) on top of the aerosol mast at a height of 10 m above the foredeck and approximately 20–25 m above the sea surface. From there an inlet line was installed to the container. The
15
length of the inlet line was 15 m; the inlet line itself was made of 1/2′′ stainless steel tubing. The inlet flow of the AMS during the campaign was 0.1 lpm. A critical orifice before a vacuum pump preserved a total flow rate of 16.7 lpm through the inlet line, re-sulting in an average flow rate of approximately 4.5 m s−1 and a retention time of 3.5 s for particles within the inlet line. Simple calculations for transport losses according to
20
Hinds(1998) show that for the particle size range between 40 nm and 1000 nm losses
were below two percent within that setup. The AMS sample flow was extracted from the inlet line using an isokinetic sampling probe immediately before the AMS inlet.
To ensure data quality calibrations were performed several times during the cam-paign. A particle-Time-of-Flight calibration to convert the particle flight times into
par-25
ticle diameters was performed once at the beginning of the campaign, after the instru-ment was installed inside the container. To determine the instruinstru-ment background and
ACPD
8, 4831–4876, 2008
Characterization of the South Atlantic
MBL aerosol S. R. Zorn et al. Title Page Abstract Introduction Conclusions References Tables Figures ◭ ◮ ◭ ◮ Back Close
Full Screen / Esc
Printer-friendly Version Interactive Discussion
instrument-specific parameters measurements through a high efficiency-particulate air filter (HEPA filter) were performed two times during the campaign (once at each leg). The ionization efficiency of the ion source was quantified at the beginning and at the end of each leg, the sensitivity of the detector was monitored all the time and calibrated at least once a week.
5
During regular operation the instrument was collecting averaged high resolution mass spectra, species-resolved size distributions and single particle spectra by alter-nating through these three operation modes of the data acquisition software spending 40% of the time collecting average mass spectra and averaged size distributions and 20% for collection of single particle data. The time for a sampling period was ten
min-10
utes during the first part of the cruise crossing the Atlantic Ocean from East to West. For the second part of the cruise the averaging time was decreased to five minutes to reduce the amount of measurement intervals lost because of short contamination events by the ships stack emissions, which was much more pronounced during leg 2 going from West to East.
15
The measurements for the first part of the campaign were started on 19 January while the ship was still in the harbor. The instrument was collecting data during the whole time of leg 1 without any problems until arrival of the ship in Punta Arenas on 5 February. Measurements for leg 2 were started on 1 March also before leaving the harbor of Punta Arenas. During this leg some instrumental problems occurred.
20
As a result of a failure of the vaporizer power supply the instrument did not run for approximately three days in the beginning of leg 2.
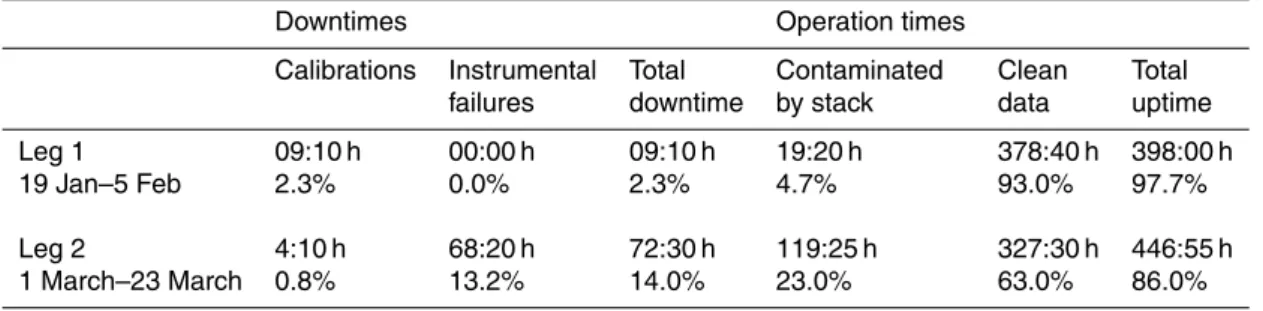
The measurements ended on 23 March, when the Marion Dufresne was heading to-wards Reunion Island. A summary about calibrations, downtimes and operation times as well as stack contamination and clean data for the two legs is shown in Table1.
ACPD
8, 4831–4876, 2008
Characterization of the South Atlantic
MBL aerosol S. R. Zorn et al. Title Page Abstract Introduction Conclusions References Tables Figures ◭ ◮ ◭ ◮ Back Close
Full Screen / Esc
Printer-friendly Version Interactive Discussion
4 Extraction of MSA concentrations from AMS data
This is the first time that an AMS has been used to measure remote marine aerosols in the Southern Hemisphere. Since the standard AMS data processing (Allan et al.,2004) does not include methanesulfonic acid (MSA), a substance to be found ubiquitously in aerosol particles from marine environments, a procedure had to be developed to
5
separate MSA from “sulfate” and “organics” in the AMS mass spectra and to quantify this species. As a first step in achieving this aim comprehensive laboratory experiments were performed to characterize the fragmentation of MSA in the AMS evaporation and ionization process and to determine MSA fragmentation patterns that can be used for field data analysis.
10
The aerosol was generated by nebulizing a solution of MSA with an atomizer (TSI, Model 3076). For drying the aerosol was led through two silica gel dryers and then in-troduced into the AMS where standard mass spectra of this species were recorded. To test if MSA could be still seen and separated from other compounds also a combined solution of MSA and ammonium sulfate ((NH4)2SO4) was used. In order to be able
15
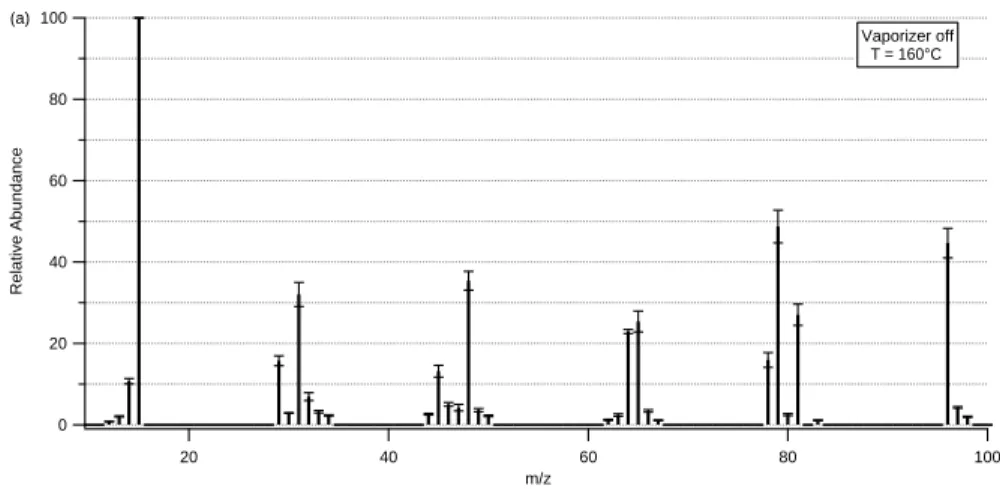
to predict the MSA fragmentation pattern in AMS measurements at all vaporizer tem-peratures the standard fragmentation patterns were determined for a series of fifteen different vaporizer temperatures ranging from 160◦C up to 800◦C. The lowest tempera-ture was reached by turning vaporizer heating completely off. The remaining vaporizer temperature of approximately 160◦C is due to radiative heating by the electron emitting
20
filament of the ToF-AMS ion source. In order to achieve good statistics and to account for potential day-to-day variations the temperature dependencies were measured three times at different days with at least four averaging intervals of five minutes each.
These experiments show that the fragmentation pattern of MSA is heavily depending on vaporizer temperature (Fig.3). Comparison with the NIST spectrum for MSA (NIST
25
Mass Spec Data Center, 2005, data not shown) demonstrates that for low tempera-tures (Fig.3a) they both show similar patterns. The differences that can still be seen between the measured spectrum and the NIST spectrum are due to two reasons. The
ACPD
8, 4831–4876, 2008
Characterization of the South Atlantic
MBL aerosol S. R. Zorn et al. Title Page Abstract Introduction Conclusions References Tables Figures ◭ ◮ ◭ ◮ Back Close
Full Screen / Esc
Printer-friendly Version Interactive Discussion
first one is that in the AMS the vaporizer temperature is well above the minimum nec-essary temperature for evaporation of MSA, which leads to increased fragmentation of the molecules. Secondly, the NIST spectrum starts with higher mass-to-charge ratios while AMS spectra are normally recorded starting with m/z12, which makes it possible to record the methyl-fragments (m/z12–15) and to identify the most prominent MSA
5
fragment at m/z15.
Generally the higher the vaporizer is heated the more a shift to smaller mass-to-charge ratios can be seen in the fragmentation pattern (Fig.3b). Especially the peak of the parent ion at m/z96 and the fragments at m/z78, 79 and 81 are quite strongly decreasing whereas signals at m/z14, 48 and 64 are increasing. The reason for this
10
is most likely thermal decomposition during the flash-vaporization process or thermally induced enhancement of fragmentation in the electron impact ionization process.
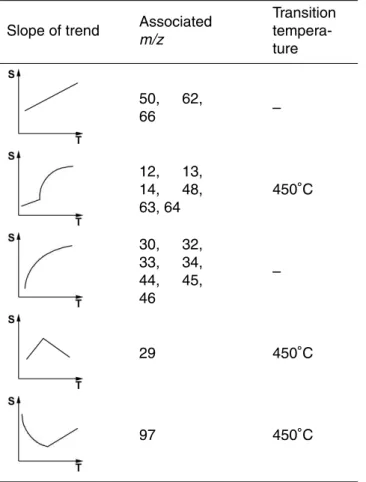
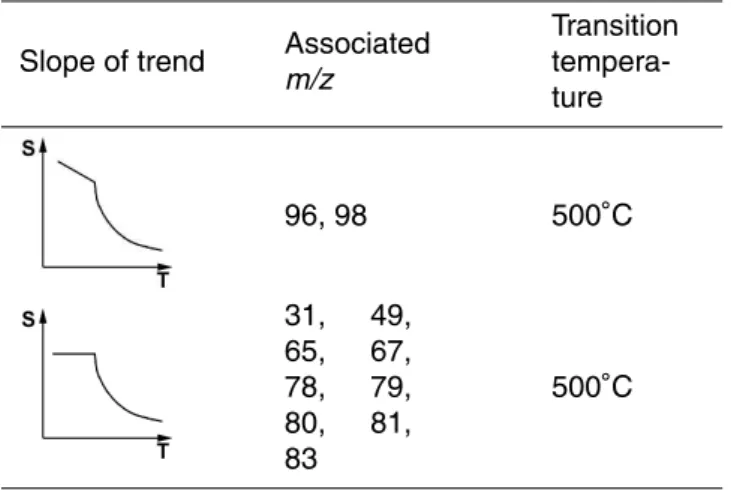
The individual MSA fragments were grouped into 7 groups that showed similar rela-tive peak intensity dependence of vaporizer temperature (Table2). To be able to predict the average MSA fragmentation pattern at any given temperature, for each of the main
15
fragments a fit for the temperature dependency was calculated using equations that describe the peak intensity dependence sketched in Table2. Using these fits it is pos-sible to calculate the specific fragmentation pattern for any vaporizer temperature be-tween 160◦C and 800◦C. The variability for some fragments within the measurements at individual vaporizer temperatures (error bars in Fig.3) shows that some fragments
20
are influenced by external parameters like humidity, ambient temperature and possibly concentration of MSA of the spray solution.
The fragmentation pattern characterization shows that most fragments of MSA are occurring at m/z values where also fragments of sulfate and sulfuric acid or of other organic species can be found. Therefore, in order to extract MSA-related signals, these
25
fragments must be separated from those of the AMS species groups “sulfate” and “organics”. Due to the small relative uncertainty of the individual line intensities of the various fragments (Fig.3) and the knowledge of the MSA fragmentation pattern at each vaporizer temperature it is sufficient to know the intensity of one of the major fragments
ACPD
8, 4831–4876, 2008
Characterization of the South Atlantic
MBL aerosol S. R. Zorn et al. Title Page Abstract Introduction Conclusions References Tables Figures ◭ ◮ ◭ ◮ Back Close
Full Screen / Esc
Printer-friendly Version Interactive Discussion
to reconstruct the whole MSA fragmentation pattern.
As the most suitable one for such a characteristic fragment the signal at m/z79 (CH3SO2+) was identified for two reasons. This fragment is not only one of the most prominent MSA fragments containing a sulfur atom but also it can be found at a m/z where no fragment from the sulfate or sulfuric acid fragmentation pattern is present.
5
Unlike the Q-AMS used by Phinney et al. (2006), which provides only mass spec-tra with unitary resolution, the HR-ToF-AMS is in principle capable of collecting mass spectra with mass resolution up to 6000 m/∆m, making it possible to separate the MSA fragment at m/z79 (CH3SO2+, 78.99) from the other major contributors at this m/z, bromine (m/z78.92) and a hydrocarbon organic fragment (m/z79.06, C6H7+).
There-10
fore with this instrument MSA can be directly quantified for the first time without es-timating the MSA signals from assumptions about the non-MSA components at the same m/z.
Due to the large differences in the exact mass of the species found at m/z79 they can also be separated at the mass resolution of m/∆m=2500 at which the
HR-ToF-15
AMS was operated during the ship measurement campaign. This was not necessarily possible for the other MSA fragments.
To extract the MSA signal intensity at m/z79 a three-step algorithm was implemented in the raw mass spectra integration of the ToF-AMS Data Analyzer TADA (Hings et
al., 2007), which was used to process the campaign data. Since the bromine peak
20
(m/z78.92) was always present in the background spectra of the instrument, unlike the MSA peak, it was used to perform a very exact mass calibration by fitting a simple Gaussian distribution at this part of the high resolution background mass spectra at
m/z79 (Fig.4). The second step was fitting a function consisting of three Gaussian
distributions to the whole m/z79 signal of the aerosol mass spectrum. For this fit the
25
width of each of the three Gauss functions was held constant and set to match the mass resolution of the instrument at this m/z. In addition the center points of the three Gaussian distributions were held constant at the locations calculated from the exact mass calibrations for the three species. Therefore only the amplitudes of the three
ACPD
8, 4831–4876, 2008
Characterization of the South Atlantic
MBL aerosol S. R. Zorn et al. Title Page Abstract Introduction Conclusions References Tables Figures ◭ ◮ ◭ ◮ Back Close
Full Screen / Esc
Printer-friendly Version Interactive Discussion
peaks at m/z79 were fitted using the Marquardt-Levenberg algorithm, implemented into IGOR Pro (Wavemetrics), the platform on which TADA runs.
With these premises and restrictions the amplitude of each of the three gauss func-tions gives the fraction of the associated peak of the total peak at m/z79. Therefore the fit can not only be used to determine the MSA fraction but also for the organic and
5
bromine part of the m/z79 signal. Since the method described uses only the MSA frac-tion of the whole m/z79 mass peak of the spectrum, it is providing significantly lower limits of detection (900 pg m−3for total MSA) than one would obtain using conventional AMS data analysis as used byPhinney et al.(2006) who reported LODMSA=17 ng m−3. With the MSA fraction identified and quantified at m/z79 and the fragmentation
pat-10
tern derived from the laboratory experiments one can now calculate the intensity for each MSA fragment in each aerosol mass spectrum and subtract it from the accord-ing m/z. After this calculation MSA is no longer contributaccord-ing to the mass fragments of “sulfate” and “organics”.
To calculate the mass concentrations for MSA during the field measurements the
15
vaporizer temperature dependent fits (Table2) were used to calculate the contribution of each fragment to the total MSA mass concentration for the vaporizer temperature used during the ship measurement campaign (T =625◦C, see Fig.3c). To convert the resulting NO3-equivalent mass concentration into actual species mass concentrations, another parameter, the relative ionization efficiency RIE (Drewnick et al., 2005) for
20
MSA, must be applied. Likely due to the fact that MSA has a large vapor pressure and MSA particles quickly evaporate under typical laboratory conditions (temperature, RH, MSA vapor mixing ratio) it was not possible to determine the MSA relative ionization efficiency (RIEMSA) in laboratory experiments. Therefore RIEMSA was calculated from the RIE of sulfate and organics using Eq. (1) as a best estimate.
25
RIEMSA=
(RIEOrg+ RIESO4)
2 (1)
⇒RIEMSA= (1.2 + 1.4)
ACPD
8, 4831–4876, 2008
Characterization of the South Atlantic
MBL aerosol S. R. Zorn et al. Title Page Abstract Introduction Conclusions References Tables Figures ◭ ◮ ◭ ◮ Back Close
Full Screen / Esc
Printer-friendly Version Interactive Discussion
This estimate can lead to a significant error since the RIE is proportional to the mass concentration of the compound. So far, it is the best assumption we can provide since no MSA concentrations measured by other instruments during the campaign are available. Our estimate for RIEMSA is different from the value used by Phin-ney et al. (2006), who used the same RIE for this species as they used for sulfate
5
(RIEMSA=RIESO4=1.15).
5 Field data analysis
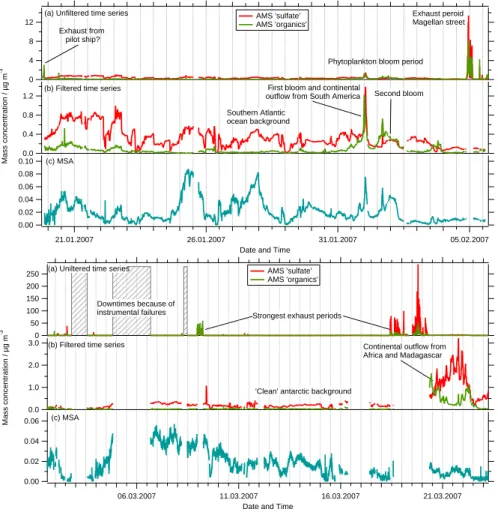
5.1 Removing exhaust contamination
During a ship campaign the own ship exhaust is always a potential source of contami-nation for nearly all kind of atmospheric measurements. While constant wind directions
10
can support the contamination-free sampling using well positioned sampling inlets it also can lead to a significant fraction of contaminated samples, especially if the ship has to pursue a narrow schedule and the sampling points are fixed.
Since for leg 1 the ship was traveling from East to West, wind was coming most of the times from ahead. With the ToF-AMS sampling inlet being located on the aerosol
15
mast ∼10 m above the foredeck of the ship, contamination from the stack was very rare for this part of the campaign. In total less than five percent of the collected data from leg 1 did show exhaust signatures. For leg 2, the situation was quite contrary, because the journey was going the opposite direction. This resulted in extended time periods with winds coming from the back of the ship bringing exhaust from the stack,
20
located in the middle of the ship, to the inlet. To keep measurement times lost due to contamination as low as possible without loosing too much information, the ToF-AMS averaging length was decreased from ten to five minutes for this leg. Still approximately 120 h (23%) of data were contaminated.
To reliably exclude the contaminated data from the dataset before further analysis,
25
ACPD
8, 4831–4876, 2008
Characterization of the South Atlantic
MBL aerosol S. R. Zorn et al. Title Page Abstract Introduction Conclusions References Tables Figures ◭ ◮ ◭ ◮ Back Close
Full Screen / Esc
Printer-friendly Version Interactive Discussion
was done by using a variety of criteria, especially AMS and wind data. The criteria for data exclusion were observations of wind speed amplitude and direction ranges relative to the ships movement, for which the ToF-AMS data showed signs of exhaust contamination. Exhaust contamination was generally observed when the relative wind speed dropped below 2 m s−1, but also when the wind was coming from a sector
be-5
tween 135◦and 215◦relative to the ship (0◦is in the front, 180◦in the back). In addition ToF-AMS mass concentration and size distribution signatures for sulfate and organics were used to identify contaminated data. In the ToF-AMS data these events showed a high, simultaneous increase in “sulfate” and “organics” mass concentrations, but also an additional mode between 40 and 100 nm particle diameter could be seen in the
10
aerosol size distributions. In Fig.5the effect of the filter applied to the ToF-AMS mass concentration time series is presented for both legs.
As has been mentioned before and can be seen in Fig. 5 during leg 1 only a few short time intervals were contaminated by the ship exhaust. During these events mass concentrations of sulfate and organics are increasing by at least one order of
magni-15
tude.
In addition to the downtimes of the instrument at the beginning of leg 2 (see Table1), contamination of measurements with stack exhaust did occur quite often during this part of the campaign.
Interestingly, the signatures for the exhaust events are always the same (strong
in-20
crease in AMS “organics” and “sulfate”), but the intensities are varying. Looking close at Fig.5 it seems that the organics-to-sulfate ratio is decreasing over the campaign. Possible explanations for this behavior are the influence of external parameters like air temperature and humidity or wind speed. Another reason could be a change in the composition of the remaining fuel during the course of the campaign.
25
Another way to remove exhaust signatures from AMS measurements is a method to separate hydrocarbon-like organic aerosols (HOA) produced by combustion from oxygenated organic aerosols (OOA) mainly of biological origin (Zhang et al., 2005). This method was developed for aerosol in urban environments, where both organic
ACPD
8, 4831–4876, 2008
Characterization of the South Atlantic
MBL aerosol S. R. Zorn et al. Title Page Abstract Introduction Conclusions References Tables Figures ◭ ◮ ◭ ◮ Back Close
Full Screen / Esc
Printer-friendly Version Interactive Discussion
components are found at reasonable concentrations. Since this is not the case for our measurements this method cannot be used in our case. A first examination shows typical HOA-like spectra only for exhaust periods. For all other times the spectra are not similar to common HOA or OOA spectra (Zhang et al.,2005), and require a deeper analysis, which is not within the scope of this paper.
5
5.2 Time series of aerosol mass concentrations
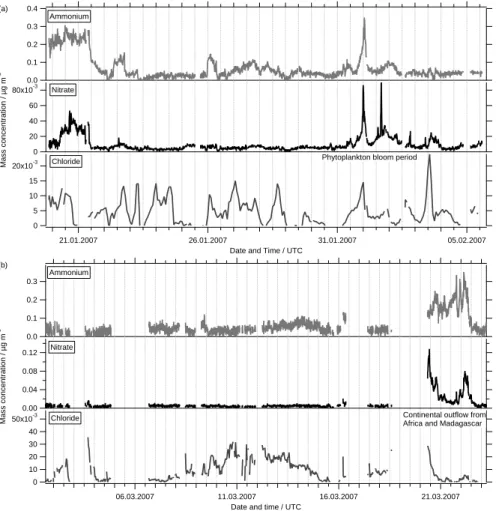
Looking at the filtered time series of the uncontaminated measurements some points are quite obvious. The first one is that AMS “sulfate” nearly all the time is the dom-inating species in the fraction of the marine aerosol measured by the AMS, i.e. the submicron non-refractory aerosol (Fig. 5). Only when coming close to coastal areas
10
or when passing through one of the phytoplankton blooms organic concentrations ex-ceed those of AMS “sulfate”. These blooms were identified by satellite data and an increased biological activity was seen by the strong green color of the ocean. For both bloom events a drop in sea surface temperature (SST) can be seen (Fig. 7, upper panel), especially for the second where SST drops from 16◦C to 10◦C, indicating the
15
inflow of cold water. During these bloom periods organics contribute up to 50 percent to the total non-refractive aerosol mass concentrations in the size fraction below 1 µm. The temporal trends of the time series for methanesulfonic acid (Fig.5) seem to fol-low those for AMS “sulfate” for times where the aerosol is mainly dominated by marine sources. This is supporting the assumptions that both are originating from the same
20
source, likely oxidation of dimethylsulfide (DMS).
For leg 1, generally the ratio between MSA and AMS “sulfate” is higher when air masses did come directly from Antarctica (24 January 2007–25 January 2007, 26 Jan-uary 2007–28 JanJan-uary 2007) and during the phytoplankton bloom periods near South America, especially during the second of these blooms (1 February 2007–2 February
25
2007). For periods when air masses were coming from the middle of the ocean or had a long residence time there before arriving at the ship (Clean Atlantic, 12 March 2007– 15 March 2007), the ratio is much lower, but the trends for MSA and AMS “sulfate” time
ACPD
8, 4831–4876, 2008
Characterization of the South Atlantic
MBL aerosol S. R. Zorn et al. Title Page Abstract Introduction Conclusions References Tables Figures ◭ ◮ ◭ ◮ Back Close
Full Screen / Esc
Printer-friendly Version Interactive Discussion
series are still similar, most likely due to longer transport from the source region to the ship or due to the later season.
Only for the time after passing the phytoplankton bloom region when – according to backward trajectories (see below) – air masses were continentally influenced by passing over South America and inside the Magellan Street, this is no longer true. For
5
these time intervals MSA is nearly zero although the time series for AMS “sulfate” show significant concentrations.
During leg 2 the typical mass concentrations of AMS “sulfate” as well as of MSA were only half as large as the ones from leg 1, possibly because of lower temperatures (Fig.7) and the season passing from summer to autumn in the Southern Hemisphere
10
leading to reduced biological activities. Total organics mass concentrations (without MSA) on the other side did not show such a difference. Their average mass con-centration was within the same range as for leg 1, except the concon-centrations measured during the bloom period. Overall, during the second leg not much variation can be seen in the time series for organics, AMS “sulfate” and MSA. Only when the measurements
15
were performed in a region with continental influence from Africa and Madagascar (20 March 2007–23 March 2007) a strong change in both organics and “sulfate” mass con-centrations could be seen. Again the mass concentration for MSA did not rise during that period, which indicates again that MSA is produced mainly over the Ocean. This could make MSA an excellent tracer for marine Aerosol. Unfortunately, not much is
20
known about the lifetime of MSA in the aerosol. From our laboratory experiments we know that pure MSA particles are evaporating quickly. However, in a natural, mixed aerosol this could be very different. Putaud et al. (1999) estimated a lifetime of ap-proximately six days in the absence of precipitation, andSodemann et al.(2006) found MSA on dust particles from alpine ice cores and linked it to a dust event going through
25
a phytoplankton bloom area in the Mediterranean Sea.
Most periods during the ship cruise ammonium was close to the detection limit (LOD, 60 ng m−3) or below. Significant mass concentrations of ammonium could only be mea-sured at the beginning of leg 1 (Fig.6, upper panel), and when air masses were
con-ACPD
8, 4831–4876, 2008
Characterization of the South Atlantic
MBL aerosol S. R. Zorn et al. Title Page Abstract Introduction Conclusions References Tables Figures ◭ ◮ ◭ ◮ Back Close
Full Screen / Esc
Printer-friendly Version Interactive Discussion
tinentally influenced by outflow from Africa (20 March 2007–23 March 2007, Fig. 6, lower panel) when the average mass concentration of ammonium was 0.18 µg m−3
. The high concentrations at the beginning of the cruise are most likely because of con-tinental influence from Africa.
An increase of ammonium to a maximum of 0.35 µg m−3
did also occur during the
5
first bloom period together with AMS “sulfate”, which most likely is an indication of continental influence. During the second bloom event ammonium mass concentrations did only rise slightly above the LOD resulting in an average mass concentration of 0.07 µg m−3.
Nitrate mass concentrations during the campaign were also quite low, but most times
10
above the detection limit (3 ng m−3). Interestingly, nitrate mass concentrations did also rise during the bloom period (20 ng m−3) as well as during the period where outflow from Africa was observed with an average concentration of 40 ng m−3 (Fig.6). Unlike ammonium, the nitrate concentration seems to be correlated with the concentration of organics. For all other times, when no continental influence can be seen, nitrate shows
15
very low concentrations.
Since the AMS can only measure the non-refractory part of the sub-micron aerosol, it will not detect sodium chloride with significant efficiency. However, it is possible that a small fraction of the chloride from the sea salt can be detected, showing at least a trend for sea salt in the sub-micron fraction of the MBL aerosol. For leg 1, 10-min chloride
20
mass concentrations were almost all the time below the detection limit of 16 ng m−3. Even though being below the detection limit for chloride the time series showed clear structures. Therefore the time series were averaged over 90 min, reducing the detec-tion limit for chloride by a factor of three to a value of approximately 5 ng m−3(Fig.6). For leg 2 an increase of chloride mass concentrations to about 20–30 ng m−3 can be
25
seen between 8 and 15 March (Fig. 6, lower panel) which does not correlate with any other substance measured by the AMS. Comparison of chloride time series with wind speed shows for most structures within the chloride time series a positive corre-lation with the time series of the wind speed for both legs (Fig. 7). Wind speed over
ACPD
8, 4831–4876, 2008
Characterization of the South Atlantic
MBL aerosol S. R. Zorn et al. Title Page Abstract Introduction Conclusions References Tables Figures ◭ ◮ ◭ ◮ Back Close
Full Screen / Esc
Printer-friendly Version Interactive Discussion
ground was calculated from apparent wind data and ship movement and orientation. This correlation is indicating that the AMS, even though it is not capable of flash va-porizing sodium chloride, provides some information about sea salt concentrations, at least under the conditions during this ship campaign. The sea salt concentration within the submicron fraction of the MBL aerosol is increasing with increasing wind speeds,
5
especially if wind speeds are above the values needed for whitecap formation.
The analysis so far indicates that AMS “sulfate” is the dominant species of the marine submicron non-refractory aerosol. Organic species contribute only to a minor degree to this aerosol composition in the MBL but they are also present during all times (Table3). In contrast, nitrate and ammonium are only found in the aerosol mass spectra close to
10
the continents. During measurements of undisturbed marine air masses the concen-tration of these species is typically below the detection limit of 60 ng m−3for ammonium and of 3 ng m−3 for nitrate, hence no ammonium and only very low concentrations of nitrate have been detected in the submicron aerosol in the MBL. In other words this means that no counter ion for the “sulfate” measured with the ToF-AMS is present
15
during most periods on the ocean and suggests that most of the aerosol species sum-marized in the ToF-AMS species class “sulfate” is sulfuric acid. The vaporization and ionization process of the ToF-AMS generates fragmentation patterns for sulfate and sulfuric acid that are very similar to each other and at this time it is not possible to separate these two species using the standard AMS data processing method (Allan
20
et al.,2004). In continental regions sulfuric acid is rapidly neutralized since ammonia evaporating from soils or from other sources is available in sufficient concentrations to produce ammonium sulfate. However, for the ocean these sources are missing. The assumption of particles containing a large fraction of sulfuric acid is supported by the PILS-IC data collected during the campaign (not shown here). To correct for
incom-25
plete aerosol collection as a consequence of incomplete transmission of the particles to the vaporizer as well as for particle bounce from the vaporizer before evaporation, the AMS analysis software corrects the measured mass concentrations with the so called Collection Efficiency factor CE (Huffman et al.,2005). This factor can be determined
ACPD
8, 4831–4876, 2008
Characterization of the South Atlantic
MBL aerosol S. R. Zorn et al. Title Page Abstract Introduction Conclusions References Tables Figures ◭ ◮ ◭ ◮ Back Close
Full Screen / Esc
Printer-friendly Version Interactive Discussion
by comparing AMS measurements with those from other instruments, for example a PILS-IC. Under typical continental conditions the AMS collection efficiency is about 50%. Typically this value is rationalized by the supposition that approximately 50% of the particles bounce off the vaporizer before they evaporate. For liquid particles, such as pure ammonium nitrate particles, DOP (dioctyl phthalate) particles or activated
par-5
ticles under very humid conditions, the collection efficiency increases to almost 100%. Actually, for the OOMPH campaign the ToF-AMS “sulfate” mass concentrations agree well with those measured by the PILS-IC without applying collection efficiency correc-tion. This suggests that the particles were mostly liquid leading to the conclusion that they either had a significant liquid surface layer as a consequence of the large RH or
10
they did comprise a large fraction of sulfuric acid. As a consequence of these findings no collection efficiency factor was applied to correct for particle bounce for the aerosol concentrations presented here.
5.3 Aerosol characteristics of various air masses
For further analysis of the ToF-AMS data and to characterize the composition and
phys-15
ical parameters of the aerosol found in different air masses observed during the ship cruise an analysis of these air masses based on backward trajectories was performed. The backward trajectories were produced by using LAGRANTO, a Lagrangian simula-tion algorithm (Wernli and Davies,1997). Trajectory ensembles were calculated every three hours, with a bundle of 24 trajectories for each time step. The time covered by
20
the trajectories was 10 days.
To calculate average aerosol parameters for different air masses we did look for time intervals when air mass trajectories originated from the same source region, followed similar paths, and spend similar times within a certain region. If, for example, trajecto-ries originally came from Antarctic regions but had a long residence time traveling over
25
the Southern Atlantic Ocean for several days instead of going straight to the ship posi-tion, they were no longer treated as originated from Antarctica but as “Clean Atlantic”. Using the criteria described above at least five time periods representative for
differ-ACPD
8, 4831–4876, 2008
Characterization of the South Atlantic
MBL aerosol S. R. Zorn et al. Title Page Abstract Introduction Conclusions References Tables Figures ◭ ◮ ◭ ◮ Back Close
Full Screen / Esc
Printer-friendly Version Interactive Discussion
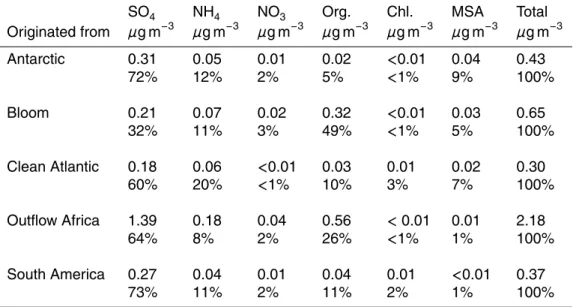
ent source regions could be identified, hereafter called “Antarctic”, “Bloom”, “South America”, “Clean Atlantic” and “Outflow Africa”. Schematic arrows characterizing the trajectories or regions, as in case of the bloom period, of these air masses can be found in Fig.1.
For each of these time periods the origin and track of the trajectories did stay
con-5
stant at least one day or longer, besides for the “Bloom” period, which lasted only a few hours when the ship crossed through the phytoplankton bloom area. A summary of species concentrations measured with the ToF-AMS for each of the air masses is presented in Table3.
To investigate possible relations between different species for the different regions
10
correlations between the most abundant species sulfate, organics, and MSA were cal-culated (Figs.8and9).
To be classified as “Antarctic” air masses had to originate in and coming straight from Antarctica before arriving at the ship position (Fig. 1). These air masses are characterized by very low concentrations for most aerosol compounds except “sulfate”
15
and MSA. A large MSA-to-“sulfate” ratio is quite characteristic for these air masses as shown in the correlation plot for these species in Fig. 9. Organics show lowest concentrations for this source region, leading to a very high MSA-to-organics ratio (Fig.8).
Very similar are both, absolute and relative concentrations for the “Clean Atlantic” air
20
mass (Table3). Trajectories for these air masses came originally also from Antarctica but stayed for some days above the Southern Atlantic Ocean going from West to East before approaching the ship from Northwest. “Sulfate” and MSA show a similar ratio as for “Antarctic” air (Fig.9), but concentrations are almost a factor of two lower. Chloride shows the highest concentrations for these air masses, caused by high wind speeds
25
for these air masses, leading to an increase of small sea salt particles even in the size range below 1 µm (Figs. 6 and 7). Finally, the MSA-to-organics ratio is on the same branch as for “Antarctic” air masses (Fig.8). The strong similarities between “Clean Atlantic” and “Antarctic” aerosol composition suggests, that also the “Antarctic” aerosol
ACPD
8, 4831–4876, 2008
Characterization of the South Atlantic
MBL aerosol S. R. Zorn et al. Title Page Abstract Introduction Conclusions References Tables Figures ◭ ◮ ◭ ◮ Back Close
Full Screen / Esc
Printer-friendly Version Interactive Discussion
is dominated by marine emissions collected during the short time the air spent traveling to the ship position or, alternatively, from emissions within the biological active Antarctic shelf region, however, not by emissions from the Antarctic continent itself.
When arriving in the costal region of South America, the ship passed through so-called phytoplankton blooms. Phytoplankton blooms or algal blooms are areas where
5
the population of one or a few species of micro algae or marine bacteria is increas-ing rapidly due to a strong nutrient input. These organisms are known to produce organic compounds which can be released into the atmosphere, such as for example DMS, halocarbons (Lovelock et al., 1973) and isoprene (Bonsang et al., 1992). As mentioned before the blooms were indicated by satellite images and high biological
10
activities causing the green color of the ocean.
During the “Bloom” periods offshore of South America (Fig. 1) “sulfate” mass con-centrations are at similar levels as for “Clean Atlantic”, but concon-centrations for organics are significantly higher making up nearly 50 percent of the total non-refractory aerosol mass below one micrometer. Compared to the organic concentrations measured
dur-15
ing “Antarctic” and “Clean Atlantic” periods they are approximately 20 times higher. A detailed investigation of this organic aerosol is part of forthcoming analyses and not within the scope of this publication.
In fact the bloom period is the only one when organics are clearly dominating the aerosol composition. Unfortunately during this time interval air mass trajectories are
20
coming over South America (first bloom event, see Fig.5) and from the Pacific Ocean passing over it (second bloom event). Although they were only passing over less pop-ulated areas with grassland (Patagonia) an influence from continental sources cannot be excluded.
The MSA-to-“sulfate” ratio for this period (Fig. 9) shows the same slope as that for
25
“Clean Atlantic”, but the concentrations measured during the bloom are higher, al-though slightly below those for “Antarctic” air masses. Interestingly, the organics-to-MSA ratio for the bloom period differs totally from the same ratio for these other two air masses. Another indication for continental influence during this period are the relatively
ACPD
8, 4831–4876, 2008
Characterization of the South Atlantic
MBL aerosol S. R. Zorn et al. Title Page Abstract Introduction Conclusions References Tables Figures ◭ ◮ ◭ ◮ Back Close
Full Screen / Esc
Printer-friendly Version Interactive Discussion
high nitrate mass concentrations (Fig.6). These are approximately twice as large as those observed in the “Clean Atlantic” and “Antarctic” air masses. On the other hand – according to the MSA-to-“sulfate” ratio – no significant “sulfate” influence from the con-tinent can be seen in the data during the bloom, inconsistent with a major concon-tinental influence.
5
The only time when Nitrate concentrations are even higher than within the bloom aerosol is during the “Outflow Africa” period. Air masses measured during that period are coming primarily from the Southern Atlantic (for the first half) and Indian (second half) Ocean, but most of them are passing over Africa or Madagascar before arriving at the ships position and are clearly continentally influenced (Fig.1). This can be seen
10
as “sulfate” concentrations are at maximum values for this period. The same is true for mass concentrations of ammonium and the total non refractory sub-micron aerosol concentration. At the same time MSA concentrations are the lowest observed within any of the air masses (Table 3). The correlation plot of organics and MSA (Fig. 8) shows a very large organics-to-MSA ratio as well as a large “sulfate”-to-MSA ratio
15
(Fig.9). This is another indicator for significantly continentally influenced air masses, observed during this time period.
The correlation plot for organics and MSA shows two modes for this period, the main one with large organics-to-MSA ratio and a smaller one with large MSA-to-organics ratio. A detailed inspection of the backward trajectories for this time interval and the
20
associated data points in Fig. 6 shows that at the beginning of this period the wind was coming from Northwest (Continental Africa). In the course of the ship passing from Africa to Madagascar the wind direction was changing to South (Southern At-lantic/Indian Ocean) and later to North East (Madagascar). The data points for this second smaller mode are from this period in between, when mainly marine air masses
25
with only little continental influence were observed. During the periods at the beginning and the end of this time interval the large continental influence was observed.
The only other time when the “sulfate”-to-MSA ratio shows a similar behavior with negligible MSA fraction is during the “South America” period. At that time the air
ACPD
8, 4831–4876, 2008
Characterization of the South Atlantic
MBL aerosol S. R. Zorn et al. Title Page Abstract Introduction Conclusions References Tables Figures ◭ ◮ ◭ ◮ Back Close
Full Screen / Esc
Printer-friendly Version Interactive Discussion
masses measured were originating from Pacific Antarctic regions and passing over the southern part of South America shortly before arriving at the ship. This period shows the lowest mass loading for MSA during the whole campaign, with values be-low 0.01 µg m−3. Whether this is due to a short lifetime, due to wet deposition while passing over the Andes or because of other reasons like missing sources for MSA is
5
unknown so far.
The organics-to-MSA ratio during that time has the same slope as for “Antarctic” and “Clean Atlantic” air masses. The average mass concentration for organics during that period is two times higher than those for these two periods, but still ten times lower than the ones for “Bloom” and “Outflow Africa”.
10
As shown in Figs. 8 and 9 “sulfate” and MSA as well as organics and MSA show compact correlations for the individual air masses, even though the absolute concen-trations of these species vary significantly. For different air masses these correlations show very different slopes.
5.4 AMS “sulfate” size distributions
15
The concentrations for most compounds measured during the ship campaign are to low to generate meaningful particle size distributions for the non-refractory sub-micron aerosol. Only for “sulfate” or sulfuric acid, as discussed before, mass concentrations were high enough to provide enough data for calculating averaged size distributions for the different time intervals associated with the different air masses as mentioned
20
before (Fig.10).
The size distributions for the “Clean Atlantic” and the “Antarctic” air masses look very similar with mode diameters between 200 and 300 nm vacuum aerodynamic diameter
dva, although mass concentrations for “Antarctic” are slightly higher. Possibly additional modes exist around 150 nm in the “Clean Atlantic” size distribution and around 350 and
25
700 nm in the “Antarctic” size distribution, however these features in the data are not very significant. The size distribution for “South America” clearly shows a bimodal size distribution with one mode in the same size range as the maximum of the two size
ACPD
8, 4831–4876, 2008
Characterization of the South Atlantic
MBL aerosol S. R. Zorn et al. Title Page Abstract Introduction Conclusions References Tables Figures ◭ ◮ ◭ ◮ Back Close
Full Screen / Esc
Printer-friendly Version Interactive Discussion
distributions mentioned before. The dominating mode for this distribution has its max-imum at 200 nm diameter. This additional mode could be a continental contribution of either nearby combustion from coastal areas or fishing boats. Unfortunately, mass con-centrations for “organics” were to low to make use of the HOA/OOA analysis method
(Zhang et al.,2005) or for the calculation of significant mass size distributions of typical
5
HOA masses (m/z43, 44, 55, 57).
The size distribution for the phytoplankton bloom period looks different from the other distributions, with a tail towards small particles – possibly from additional modes in the size range 90–200 nm – and a maximum between 300 and 400 nm. Interestingly, for particle sizes above the maximum the distribution is similar to the one from the
10
“Antarctic” period. Possible reasons are a mixing of aged continental and oceanic aerosol together with freshly created particles from within the “Bloom” region. However, mass concentrations for this distribution are within the range of the ones mentioned before.
The only averaged size distribution for “sulfate” that is clearly shifted towards larger
15
diameters with a maximum around 500 nm dva is the one for the “Outflow Africa” time interval (Fig.10, lower panel). However, the shape seems to be similar to that of the “Bloom” size distribution, but the mass concentrations are approximately five times larger than for the other distributions. This could be a sign for an aged aerosol leading to a shift in the size distribution indicating a continental influence for this period.
20
6 Discussion
For the first time an on-line aerosol mass spectrometer has been operated on a cam-paign in the Southern Hemisphere crossing the Southern Atlantic Ocean. Unlike in the studies of Bates et al. (2005) and Phinney et al. (2006), who operated also an Aerodyne AMS on a ship, the main interest of our measurements was not continental
25
outflow or the influence of an iron enrichment experiment but the pristine, remote ma-rine boundary layer aerosol. Our measurements show not only, that sulfate is the most
ACPD
8, 4831–4876, 2008
Characterization of the South Atlantic
MBL aerosol S. R. Zorn et al. Title Page Abstract Introduction Conclusions References Tables Figures ◭ ◮ ◭ ◮ Back Close
Full Screen / Esc
Printer-friendly Version Interactive Discussion
abundant species, but even more that it is present as sulfuric acid within the remote boundary layer. Therefore the measurements taken with the HR-ToF-AMS during this ship campaign seem to support the CLAW hypothesis (Charlson et al.,1987) which states that mainly DMS coming from the ocean is processed to sulfuric acid and sul-fate, at least for the non refractory sub micron range of the Aerosol. These aerosol
5
particles then can become very effective cloud condensation nuclei (CCN) having an impact on cloud coverage and therefore on the global climate system.
As proposed byvon Glasow and Crutzen(2004), our measurements show that part of the oxidized DMS is present in the aerosol phase as MSA. AlthoughMurphy et al.
(1998) had some indications for MSA, it was impossible for them to clearly identify
10
it in their measurements due to the limitations of their instrument. The same is true for measurements byCoe et al.(2006), which were limited to unitary resolution of the mass spectra due to the use of a quadrupole mass spectrometer as analyzer.Gieray et
al. (1997) did identify methane sulfonate, the neutralized ion of methanesulfonic acid, most likely because they took samples at a remote coastal area and the aerosol had
15
been neutralized by the time it was analyzed.
Topping et al. (2004) did not identify MSA from their on-line aerosol mass
spectro-metric measurements. However, results from ion chromatographic analysis of the PM10 concentrations presented by them show also a ratio of ten to one for sulfate and MSA, similar to our findings.
20
The mass concentrations of sulfate and MSA found byPhinney et al.(2006) are two to four times higher than the ones found during the OOMPH campaign. A possible reason for that is that in their study they measured during increased phytoplankton growth by iron enrichment of the ocean, leading to a higher production of DMS and to an increased particle production. However, their sulfate-to-MSA ratio is within the same
25
range as the one seen during our bloom period. Furthermore, they also experienced the miss of a cation and also assumed a collection efficiency close to one.
Organic compounds are present all the time, but at very low concentrations (20 ng m−3). Only close to coastal areas or within air masses influenced by continental
ACPD
8, 4831–4876, 2008
Characterization of the South Atlantic
MBL aerosol S. R. Zorn et al. Title Page Abstract Introduction Conclusions References Tables Figures ◭ ◮ ◭ ◮ Back Close
Full Screen / Esc
Printer-friendly Version Interactive Discussion
outflow or when measuring ship exhaust they are increasing. SinceBates et al.(2005) did focus on continental outflow, it is not surprising that their measurements showed a dominance of organic aerosols.
Unlike the ATOFMS used byDall’Osto et al.(2004) the Aerodyne AMS is not appro-priate for measuring sea salt in aerosol particles due to the vaporization at relatively
5
low temperatures and because it is designed to measure the submicron aerosol parti-cle fraction between 70 nm and 700 nm. Still our measurements show that the fraction of chloride measured is sufficient to correlate it with wind speed and to show at least qualitatively that the fraction of sea salt in the submicron aerosol of the MBL is increas-ing with increasincreas-ing wind velocity.
10
7 Summary
The Time-of-Flight Aerosol Mass Spectrometer (ToF-AMS) was for the first time suc-cessfully operated on a ship measuring the composition of the sub-micron marine boundary layer aerosol in the Southern Hemisphere. Time series and averaged mass concentrations for the AMS standard species “sulfate”, ammonium, nitrate, chloride
15
and organics could be extracted from the data improving the knowledge about the non-refractory aerosol composition from non-continental Southern Hemisphere regions. Even more, information about a species never directly measured before by an AMS, methanesulfonic acid (MSA), could be extracted from the data after extensive labo-ratory characterization experiments and the development of a new data processing
20
method. This method uses the highly resolved mass spectra provided by the High-Resolution ToF-AMS (DeCarlo et al.,2006) to extract information about a species that is not part of the standard analysis and therefore couldn’t be extracted from AMS mea-surements before. The MSA results presented here clearly show capabilities of the Aerodyne HR-ToF-AMS, however, also the limitations of the instrument. Even by using
25
the high resolution data it will not be possible to extract information on every individ-ual species or fragment, even if it is present in sufficient concentrations to be detected
ACPD
8, 4831–4876, 2008
Characterization of the South Atlantic
MBL aerosol S. R. Zorn et al. Title Page Abstract Introduction Conclusions References Tables Figures ◭ ◮ ◭ ◮ Back Close
Full Screen / Esc
Printer-friendly Version Interactive Discussion
with the instrument. Nevertheless, with careful analysis and laboratory studies the high-resolution data can greatly improve the results that can be obtained by an AMS, not only by delivering information about species that could not be separated from the standard AMS species with unit-resolution spectra, but also by significantly improved detection limits for selected species.
5
Most of the time during both legs of the ship campaign AMS “sulfate” made up two thirds of the total mass in the size range measured. Based on the results presented above a large fraction of the AMS “sulfate” is indeed sulfuric acid. Interestingly, the sec-ond most prominent non-refractory aerosol species after sulfate or sulfuric acid seems to be MSA. It is almost all the time present when the measured air is coming from
10
oceanic regions. The Aerosol mass concentrations for this species are approximately ten times lower than for “sulfate”, but for oceanic sources MSA is similarly abundant as the sum of all other organic species. Mass concentrations for organics, besides MSA, are very low nearly all the time on the ocean except in coastal regions, indicating their continental origin. Only during the phytoplankton bloom event, when
concentra-15
tions of organic compounds did rise by a factor of 20 compared to oceanic background concentrations, a direct link between particle phase organics and oceanic sources is suggested. This is subject of ongoing investigations.
Acknowledgements. This research was supported by the OOMPH (Organics over the Ocean Modifying Particles in both Hemispheres) project of the EU Sixth Framework Programme. We 20
would like to thank T. B ¨ottger and the crew of the Marion Dufresne for logistical support, and J. Williams, Co-Ordinator of the OOMPH procect, for making it possible for us to participate in this project. Thanks to J. Sciare for sharing his PILS-IC data and to H. Wernli for back trajectory data. Special thanks to the Institut Polaire Franc¸ais Paul ´Emile Victor (IPEV) for funding of our participation in the cruise. S. Zorn also thanks the German Research Foundation (DFG) for 25
financing his work through the Research Training School GRK 826. T. Hoffmann and M. Schott acknowledge financial support from the EU project MAP (Marine Aerosol Production).
ACPD
8, 4831–4876, 2008
Characterization of the South Atlantic
MBL aerosol S. R. Zorn et al. Title Page Abstract Introduction Conclusions References Tables Figures ◭ ◮ ◭ ◮ Back Close
Full Screen / Esc
Printer-friendly Version Interactive Discussion
References
Allan, J. D., Delia, A. E., Coe, H., Bower, K. N., Alfarra, M. R., Jimenez, J. L., Middlebrook, A. M., Drewnick, F., Onasch, T. B., Canagaratna, M. R., Jayne, J. T., and Worsnop, D. R.: A generalised method for the extraction of chemically resolved mass spectra from aerodyne aerosol mass spectrometer data, J. Aerosol Sci., 35, 909–922, 2004. 4835,4839,4848
5
Bates, T. S., Quinn, P. K., Coffman, D. J., Johnson, J. E., and Middlebrook, A. M.: Dom-inance of organic aerosols in the marine boundary layer over the Gulf of Maine during NEAQS 2002 and their role in aerosol light scattering, J. Geophys. Res., 110, D18202, doi:10.1029/2005JD005797, 2005. 4835,4854,4856
Bonsang, B., Polle, C., and Lambert, G.: Evidence for marine production of isoprene, Geophys. 10
Res. Lett., 19, 1129–1132, 1992. 4851
Charlson, R. J., Lovelock, J. E., Andreae, M. O., and Warren, S. G.: Oceanic phytoplankton, atmospheric sulphur, cloud albedo and climate, Nature, 326, 655–661, 1987.4855
Chasteen, T. G. and Bentley, R.: Volatile Organic Sulfur Compounds of Environmental Interest: Dimethyl Sulfide and Methanethiol. An Introductory Overview, J. Chem. Educ., 81, 1524– 15
1528, 2004. 4834
Coe, H., Allan, J. D., Alfarra, M. R., Bower, K. N., Flynn, M. J., McFiggans, G. B., Topping, D. O., Williams, P. I., O’Dowd, C. D., Dall’Osto, M., Beddows, D. C. S., and Harrison, R. M.: Chemical and physical characteristics of aerosol particles at a remote coastal location, Mace Head, Ireland, during NAMBLEX, Atmos. Chem. Phys., 6, 3289–3301, 2006,
20
http://www.atmos-chem-phys.net/6/3289/2006/. 4835,4855
Dall’Osto, M., Beddows, D. C. S., Kinnersley, R. P., Harrison, R. M., Donovan, R. J., and Heal, M. R.: Characterization of individual airborne particles by using aerosol time-of-flight mass spectrometry at Mace Head, Ireland, J. Geophys. Res., 109, D21302, doi:10.1029/2004JD004747, 2004. 4835,4856
25
DeCarlo, P. F., Kimmel, J. R., Trimborn, A., Northway, M. J., Jayne, J. T., Aiken, A. C., Gonin, M., Fuhrer, K., Horvath, T., Docherty, K. S., Worsnop,, D. R., and Jimenez, J. L.: Field-Deployable, High-Resolution, Time-of-Flight Aerosol Mass Spectrometer, Anal. Chem., 78, 8281–8289, 2006. 4856
Drewnick, F., Hings, S. S., DeCarlo, P. F., Jayne, J. T., Gonin, M., Fuhrer, K., Weimer, S., 30
Jimenez, J. L., Demerjian, K. L., Borrmann, S., and Worsnop, D. R.: A New Time-of-Flight Aerosol Mass Spectrometer (TOF-AMS) – Instrument Description and First Field

![Copper‐Rich Thermoelectric Sulfides: Size‐Mismatch Effect and Chemical Disorder in the [TS4]Cu6 Complexes of Cu26T2Ge6S32 (T=Cr, Mo, W) Colusites](data:image/gif;base64,R0lGODlhAQABAIAAAP///wAAACH5BAEAAAAALAAAAAABAAEAAAICRAEAOw==)