HAL Id: cea-01383760
https://hal-cea.archives-ouvertes.fr/cea-01383760
Submitted on 19 Oct 2016
HAL is a multi-disciplinary open access
archive for the deposit and dissemination of
sci-entific research documents, whether they are
pub-lished or not. The documents may come from
teaching and research institutions in France or
abroad, or from public or private research centers.
L’archive ouverte pluridisciplinaire HAL, est
destinée au dépôt et à la diffusion de documents
scientifiques de niveau recherche, publiés ou non,
émanant des établissements d’enseignement et de
recherche français ou étrangers, des laboratoires
publics ou privés.
SINFONI spectra of heavily obscured AGNs in
COSMOS: Evidence of outflows in a MIR/O target at z
2.5
M. Perna, M. Brusa, M. Salvato, G. Cresci, G. Lanzuisi, S. Berta, I.
Delvecchio, F. Fiore, D. Lutz, E. Le Floc’h, et al.
To cite this version:
M. Perna, M. Brusa, M. Salvato, G. Cresci, G. Lanzuisi, et al.. SINFONI spectra of heavily obscured
AGNs in COSMOS: Evidence of outflows in a MIR/O target at z 2.5. Astronomy and Astrophysics
- A&A, EDP Sciences, 2015, 583, pp.A72. �10.1051/0004-6361/201526907�. �cea-01383760�
10.1051/0004-6361/201526907
c
ESO 2015
Astrophysics
&
SINFONI spectra of heavily obscured AGNs in COSMOS: Evidence
of outflows in a MIR/O target at z
∼
2.5
?
M. Perna
1,2, M. Brusa
1,2, M. Salvato
3,4, G. Cresci
5, G. Lanzuisi
1,2, S. Berta
3, I. Delvecchio
6, F. Fiore
7, D. Lutz
3,
E. Le Floc’h
8, V. Mainieri
9, and L. Riguccini
101 Dipartimento di Fisica e Astronomia, Università di Bologna, viale Berti Pichat 6/2, 40127 Bologna, Italy
e-mail: michele.perna4@unibo.it
2 INAF–Osservatorio Astronomico di Bologna, via Ranzani 1, 40127 Bologna, Italy
3 Max-Planck Institut fur Extraterrestrische Physik, Giessenbachstrasse 1, 85748 Garching bei München, Germany 4 Excellence Cluster Universe, Boltzmannstrasse 2, 85748 Garching bei München, Germany
5 INAF–Osservatorio Astrofisico di Arcetri, Largo Enrico Fermi 5, 50125 Firenze, Italy 6 Department of Physics, University of Zagreb, Bijeniˇcka cesta 32, 10000 Zagreb, Croatia
7 INAF–Osservatorio Astronomico di Roma, via Frascati 33, 00044 Monte Porzio Catone (RM), Italy 8 AIM, Unité Mixte de Recherche CEA CNRS, Université Paris VII, UMR n158, 75014 Paris, France 9 European Southern Observatory, Karl-Schwarzschild-str. 2, 85748 Garching bei München, Germany
10 Observatório do Valongo, Universidade Federal do Rio de Janeiro, Ladeira do Pedro Antônio 43, Saúde, Rio de Janeiro,
RJ 20080-090, Brazil
Received 6 July 2015/ Accepted 18 August 2015
ABSTRACT
Aims.We present new data for four candidate obscured Compton-Thick (CT) quasars at z ∼ 1–2.5 observed with the SINFONI VLT spectrograph in adaptive optics (AO) mode. These sources were selected from a 24 µm Spitzer MIPS survey of the COSMOS field, on the basis of red mid-infrared to optical and optical to near-infrared colours, with the intention of identifying active galactic nuclei (AGNs) in dust enshrouded environments, where most of the black hole mass is assembled.
Methods. Near-infrared spectra were analysed to check for emission line features and to search for broad components in the [OIII]-Hβ and Hα-[NII] regions. We also employed X-ray spectral analysis, radio and MIR diagnostics, and SED fitting to study the nature of the sources.
Results.We successfully identified three objects for which we had only a photometric redshift estimate. Based on their emission line diagnostics and on ancillary multi-wavelength constraints, we find that all four targets harbour obscured AGNs. Broad profiles, which could be attributed to the effects of outflows, are revealed in only one target, MIRO20581. In particular, we clearly resolved a fast (∼1600 km s−1) and extended (∼5 kpc) outflow in the [OIII]5007 emission line. This feature, the commonly used indicator for
ionised outflowing gas, was only sampled and detected for this target; hence, we cannot exclude the presence of outflows in the other sources. Overall, the constraints we obtain from our targets and from other comparative samples from the literature suggest that these optically faint luminous infrared galaxies, hosting obscured AGNs, may represent a brief evolutionary phase between the post-merger starburst and the unobscured quasar phases.
Key words.Galaxy: evolution – ISM: jets and outflows – quasars: emission lines
1. Introduction
Outflow winds are predicted to be ubiquitous in active galactic nuclei (AGN) systems and are invoked in many co-evolutionary models to link the growth of supermassive black holes (BH) and galaxies through feedback phenomena. These models predict an obscured phase for young recently ignited quasars (QSOs), trig-gered by the funnelling of a large amount of gas into the nu-clear region during major galaxy mergers (e.g.Menci et al. 2008;
Hopkins et al. 2008). Roughly at the same time, this amount of gas is also responsible for vigorous star formation activity. This initial phase is followed by a transitional phase, the so-called feedback or blow-out phase (Hopkins et al. 2008), in which the gas is cleared out through outflowing winds released by the BH before becoming a normal unobscured QSO.
?
Based on observations with SINFONI VLT spectrograph, ESO program 092.A-0884(A).
In the framework described above, during the obscured phase, the BH is expected to accrete mass very rapidly, imply-ing a vigorous, although obscured, X-ray emission. In the AGN census, X-ray surveys have been extensively used to probe the assembly and growth of BH at high redshift. In particular, since the X-ray flux is less attenuated than the optical flux, selec-tion criteria based on high X-ray to optical flux ratio ( fx/ fO)
have been used to select obscured sources at z ∼ 1–2. Several studies (e.g.Fiore et al. 2003; Mignoli et al. 2004; Alexander et al. 2002;Del Moro et al. 2009;Della Ceca et al. 2015) have found that sources with high fx/ fOare characterised, on
aver-age, by red optical to near-infrared colours (R − KVega > 5)
and column densities in the X-ray of the order of 1021−23cm−2.
Moreover, VLT X-Shooter (Brusa et al. 2015;Perna et al. 2015) and SINFONI (Cresci et al. 2015) observations of a small sub-sample of obscured QSOs at z ∼ 1.5, selected on the basis of their observed red colours and high fx/ fOratio, have confirmed
the presence of ionised outflowing material in 75% of objects
and a dust-reddened type 1 nature. These objects appear simi-lar to infrared bright (KVega ≤ 16) dust-reddened Type 1 QSOs
selected by combining radio with near-infrared (NIR) and op-tical catalogues at lower redshift (z . 1;Glikman et al. 2004,
2007). Studying a subsample of 13 objects, with strongly dis-turbed morphology, Urrutia et al. (2012) found that ∼60% of these radio-detected sources show evidence for outflow in the [OIII]5007 line profile (see alsoBrusa et al. 2015).
However, each selection technique biases the samples to-wards particular properties and, chiefly, may bias the character-isation of the outflows (see Brusa et al. 2015, for details); to test co-evolutionary models, we need to select and isolate di ffer-ent populations of quasars in the different phases of the AGN to galaxy co-evolution, including the initial Compton-thick (CT1) phase.
Since most of the absorbed AGN energy is re-emitted in the mid-infrared (MIR), surveys at these wavelengths can potentially recover the elusive obscured accretion missed by X-ray surveys (e.g. Brandt & Alexander 2015). Several crite-ria based on the MIR emission of high-z sources have been in-troduced in recent years to search for heavily obscured AGNs at z ∼ 1–3, and have been applied on Spitzer MIPS observa-tions in multi-wavelength survey fields. Typically, the criteria involve the selection of objects with MIR luminosities typical of AGN, but with faint optical or near-infrared emission (e.g.
Martínez-Sansigre et al. 2005;Fiore et al. 2008,2009;Dey et al. 2008;Riguccini et al. 2015).
For example, Fiore et al. (2009) used the MIPS 24 µm COSMOS catalogue (Sanders et al. 2007) to select a sample of ∼60 candidate obscured AGN/CT QSOs characterised by ex-treme mid-infrared to optical flux ratio ( f24 µm/ fR > 1000) in the
area covered by the C-COSMOS Chandra survey (Elvis et al. 2009;Civano et al. 2012). They coupled this selection with a red colour (R − K)Vega> 4.5 cut, which is able to efficiently pick up
objects at the redshift of interest (z ∼ 1–3). To test the efficiency of the selection, they stacked the Chandra images at the position of the MIPS sources without a direct X-ray detection and re-covered a hardness ratio (HR) in the stacking signal larger than that measured for less extreme sources ( f24 µm/ fR< 1000 and/or
(R − K) < 4.5). Still, these sources, with f24 µm/ fR > 1000,
ex-hibit evidence of both star formation and AGN activity, and there are contradicting conclusions about how many of the sources se-lected in this way are actually obscured AGN at z ∼ 1–3, rather than dusty star-forming objects (e.g. Donley et al. 2008;Fiore et al. 2009;Dey et al. 2008).
In this paper we present new SINFONI observations, as-sisted with adaptive optics (AO), for a sample of four luminous, highly obscured QSOs in the COSMOS field, selected on the ba-sis of their high mid-infrared to optical flux ratios (MIR/O) and red R − K colours. Given the tight positive correlation between the f24 µm/ fR and the fx/ fO ratios found for sources with
col-umn density of the order of 1022−23cm−2(seeFiore et al. 2008,
Fig. 2),Fiore et al.(2008) suggested that luminous highly ob-scured AGNs, which are faint in the X-ray because of high col-umn densities, i.e. NH & 1023−24cm−2, and cannot be selected
using their X/O ratio, can be recovered using their MIR/O ratio. Therefore, potentially, in the framework previously described, we may be able to select sources in the prelude, or at the beginning, of the blow-out phase.
1 Throughout the paper, we distinguish between moderately obscured
(with log(NH) = 22–23 cm−2), highly obscured (with log(NH) = 23–
24 cm−2), and CT AGNs (with log(N
H) > 24 cm−2).
In the following, we refer to these sources as MIRO tar-gets, as per their high MIR/O flux ratio, and using their MIPS catalogue ID from the COSMOS Spitzer catalogue (Le Floc’h et al. 2009). The main aim of the SINFONI observations, be-sides the spectroscopic determination of the redshifts of the tar-gets, is to compare the physical properties of the sources selected in different ways (MIR/O vs. X/O) and assess the presence of ionised outflows and broad features. Targets selected with a sim-ple MIR/O ratio cut are usually known in the literature as dust-obscured galaxies (DOGs,Dey et al. 2008; see alsoRiguccini et al. 2011,2015, for a complete discussion on the DOGs popu-lation in COSMOS). In the last section, we compare our results with a compilation of a few DOGs sharing similar properties, e.g. redshift and 24 µm flux.
The paper is organised as follows: Sect. 2 presents the sam-ple selection and the ancillary data collected for our MIRO targets; Sect. 3 outlines the VLT observations and data re-duction; Sect. 4 exposes the spectroscopic analysis. Section 5 presents proof of ionised outflowing material in the X-ray source MIRO20581 and discusses the energetic output associated with the outflow and, finally, we summarise our results and the impli-cations in Sect. 6. Throughout the paper, we adopt the cosmo-logical parameters H0 = 70 km s−1,ΩM = 0.3 and Ωλ = 0.7
(Sperger et al. 2003). We adopt a Chabrier initial mass function to derive stellar masses and star formation rates (SFRs).
2. Sample selection
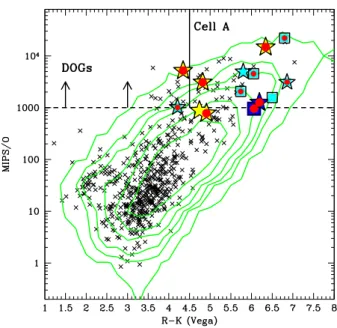
Figure1 shows the mid-infrared to optical flux ratio f24 µm/ fR
versus the (R − K) colour diagnostics diagram proposed in
Fiore et al. (2008), applied to the MIPS-selected sources in the COSMOS field (Fiore et al. 2009). The green isoden-sity contours show the distribution of the full sample of MIPS-selected sources in the COSMOS GO3 data (Le Floc’h et al. 2009) and with associated optical and K-band counter-parts (∼15 000 sources), while the black crosses are the sources detected at fluxes larger than 1 mJy at 24 µm (∼550). The box in the top right corner in the colour-colour space, delimited by vertical solid line and horizontal dashed line, marks the region where CT AGN are expected in more than 60% of the MIPS-selected sources (cell A in Fiore et al. 2009). All the sources above the horizontal dashed line are instead usually referred to as DOGs in the literature.
From theLe Floc’h et al.(2009) MIPS selected sample, us-ing SINFONI-NGS mode, we observed five targets marked as yellow stars in Fig.1 and listed in Table1, with the fluxes in the R−, K−, and MIPS 24 µm band used for the selection. Three out of five are classified as DOGs (MIRO10561, MIRO28704, MIRO20581) and two out of five are also in Cell A of Fiore et al. (2009; MIRO10561, MIRO28704)2. The main selection criteria, in addition to the high MIPS/O fluxes and red R − K colour, were the proximity to a bright AO star and a photometric red-shift broadly in the range z ∼ 1–3 so that rest-frame optical lines are redshifted in the SINFONI J, H, or K filters (four targets). In addition, for only one source (MIRO18744) a spectroscopic redshift was available from the IMACS/Magellan follow-up of X-ray sources in the COSMOS field (Trump et al. 2007), and 2 At the time of observations, all the targets were selected within the
cell A. Differences from the current situation shown in Fig.1are due to the fact that we now use an improved version of the COSMOS pho-tometric catalogue (Laigle et al., in prep.) in which the photometry is slightly changed. The colours in the figure are all related to the “total flux” measurements.
Fig. 1. f24 µm/ fR as a function of R − K colour for all the COSMOS
24 µm sources associated with the optical and K-band counterparts (green isodensity contours). Black crosses represent the 1 mJy flux-limited sample. Yellow stars denote the five objects observed with SINFONI; cyan stars and squares denoteMelbourne et al.(2011) and
Brand et al. (2007) targets, respectively (two targets present in both samples are indicated with stars); blue symbols denote thePerna et al.
(2015) targets. Star and square symbols indicate IFU and long-slit ob-servations, respectively. Sources marked with red circles are also de-tected in the 1 mJy flux limited sample and are those considered for the analysis. The box delimited by a vertical solid line and horizontal dashed line marks the region proposed inFiore et al.(2009) to select CT AGN (Cell A). The horizontal dashed line sets the criterion for the selection of DOGS.
we proposed to observe its Hα+ [NII] region with SINFONI (J-band).
In Fig. 1 we also show the z ∼ 2 DOGs presented in Melbourne et al. (2011; cyan stars) and in Brand et al. (2007; cyan squares) for which K-band magnitude is available, and the z ∼ 1.5 dust-reddened type 1 sources presented in Perna et al. (2015; blue symbols). The properties of these targets are dis-cussed in Sect.6, in order to compare our results with those pre-viously reported in literature.
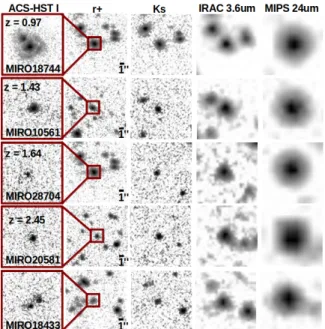
The ACS (300 × 300), R-band, K-band, IRAC3.6 µm, and
MIPS (1500 × 1500) cutouts3 of the five targets are shown in
Fig.2. We also included the IRAC 3.6 µm cutout to verify blend-ing problems in the MIPS emission: for all but MIRO18433, we can safely say that the majority of the emission at 24 micron is correctly associated with the K-band and optical counterpart (e.g. our SINFONI targets), and that the observed colours do not suffer from bad photometry. MIRO18744 may show evidence for an ongoing merger: tidal tails and double nuclei are dis-tinguishable in the ACS cutout. MIRO18433, instead, presents two components in the ACS cutout (last row of Fig.2), which are strongly blended at optical and infrared wavelengths and preclude an accurate SED fitting decomposition and a correct photometric redshift derivation. Indeed, MIRO18433 is the only source for which no spectral features have been detected in the SINFONI HK-band in two hour observations (see Table1). Moreover, MIRO18433 is the only source below the 1mJy flux 3 The cutouts are extracted from the public COSMOS cutouts
page: http://irsa.ipac.caltech.edu/data/COSMOS/index_ cutouts.html
limited sample (red circles in Fig. 1). For all the above reasons, MIRO18433 was excluded from the subsequent analysis.
2.1. Identikit via ancillary data
Previous works (e.g. Alexander et al. 2002; Donley et al. 2008) have demonstrated that red optical to near-infrared colours and high MIR-optical ratios can identify both AGN and star-forming galaxies. In the following, we briefly discuss the multi-wavelength properties of the SINFONI targets to assess which one among SF or AGN activity is the dominating process. We note however that all four of our targets have f24 µm > 1 mJy,
and that the 24 µm emission is, on average, increasingly dom-inated by AGN contribution at higher f24 µm (e.g.Brand et al.
2006;Dey et al. 2008). In the subsequent analysis (e.g. X-ray and SED fits), we made use of the spectroscopic redshift ob-tained from our SINFONI observations.
1. MIR-X-ray diagnostics. The AGN intrinsic hard X-ray lumi-nosity and the infrared lumilumi-nosity re-emitted by the torus fol-low a tight correlation (Lutz et al. 2004;Gandhi et al. 2009). Figure3shows the distribution of rest-frame observed X-ray luminosity (LObsX ) vs. L5.8 µmfor several samples of CT
can-didate AGN4 collected by Lanzuisi et al. 2015a (with the addition of XMM ID 5371;Civano et al. 2015) and for our MIRO targets (red diamonds).
For all of the sources, the rest-frame 5.8 µm luminosi-ties were obtained using a simple power-law interpolation between the 24 and 8 µm observed-frame luminosities. We computed the X-ray luminosities on the basis of the available XMM and Chandra data in the COSMOS field. More specifically, MIRO20581 and MIRO18744 are both detected in the X-rays, in the XMM-COSMOS (XID70135 and XID60205:Cappelluti et al. 2007;Brusa et al. 2010) and C-COSMOS (CID451 and CID401; Civano et al. 2012) sur-veys, while MIRO10561 is detected in the deeper COSMOS-Legacy survey (CID 3587 in the Civano et al. 2015 cata-logue and Marchesi et al., in prep.). The remaining source, MIRO28704, is instead undetected down to a luminosity of log(LX) ∼ 42.8 in the 2–10 keV band.
The Lutz et al. (2004; green shaded area) and Fiore et al. (2009; orange solid line) relations represent the tight X-ray to mid-IR correlations found for the low- and high-redshift (z > 1) unobscured AGN, respectively. The Lutz et al. (2004) relation has also been confirmed recently at higher redshift byMateos et al.(2015). These relations, however, have been calibrated at low luminosities, and require extrapolations to high luminosities (i.e. log(λLλ(5.8 µm)) > 46). A
flatten-ing of the MIR-Xray relation at the highest luminosities has been found by the recent work ofStern(2015). Assuming that both the hard X-ray and the infrared luminosities are re-lated to the AGN activity (see below; Fig.5), and given that the mid-IR is largely independent of obscuration, a lower LX
to L5.8 ratio with respect to that observed for unobscured
AGN suggests that the observed LXare affected by
obscura-tion (e.g.Stern et al. 2014). All the MIRO sources lie below these relations at values consistent with a heavily obscured absorber: the long- (short-) dashed line in Fig.3marks the NH= 1024(1023) cm−2locus, computed from the Fiore et al.
relation. Therefore, the NH loci in the figure are computed
4 All the sources with upper limits to the X-ray luminosity have been
preselected as AGN candidates using a variety of methods specifically designed to discriminate between SF and AGN galaxies.
Table 1. MIRO/SINFONI sample: selection properties and log file of observations.
MIRO RA Dec zphot R K f24 µm R − K MIPS/O Band Guide star Expo zspec
AB AB mJy Vega (name) (min) (this work)
(1) (2) (3) (4) (5) (6) (7) (8) (9) (10) (11) (12) (13) 18 744 10:01:52.2 01:56:08.6 0.97a 22.8 19.6 2.08 ± 0.03 4.90 780 J Hip 037044 50 0.97 10 561 09:59:43.5 01:44:07.6 1.54 24.6 21.4 1.70 ± 0.06 4.80 3090 J, H Hip 040661 50, 50 1.43 28 704 10:01:45.9 02:28:53.8 1.74 26.3 21.6 1.63 ± 0.02 6.35 14 800 HK Hip 046054 30 1.64 20 581 10:00:00.6 02:15:31.1 2.09 25.3 22.6 1.47 ± 0.02 4.35 5180 HK Hip 046054 80 2.45 18 433 10:01:44.8 01:55:55.8 2.59 24.6 21.6 0.44 ± 0.02 4.75 880 HK Hip 044598 120 – Notes. (1) target name; (2) right ascension; (3) declination; (4) photometric redshifts available prior to the SINFONI observations; (5) and (6): R-and K-bR-and magnitudes; (7) MIPS 24 µm flux; (8) R−K colour; (9) MIPS 24 µm/O flux ratio; (10) SINFONI filters; (11) guide star name; (12) total integration time on target for each band; (13) spectroscopic redshift.(a)Spectroscopic redshift available from Magellan IMACS spectrum.
Fig. 2.From left to right: ACS-HST I, r+ Subaru, Ks COSMOS, IRAC 3.6 µm, MIPS 24 µm band cutouts of the five MIRO targets. The target name, position, cutouts scale, and redshift derived from the SINFONI data are also labelled. For display purposes, 300
× 300
ACS-HST cutouts show the regions in the red boxes superimposed on the r+ cutouts.
with the most conservative approach: using the Lutz et al. re-lation, the dashed lines would be steeper than those obtained from the Fiore et al. Therefore, the intrinsic X-ray luminos-ity would be larger and, as a consequence, the NHneeded to
explain the observed luminosities of the MIRO targets would also be larger.
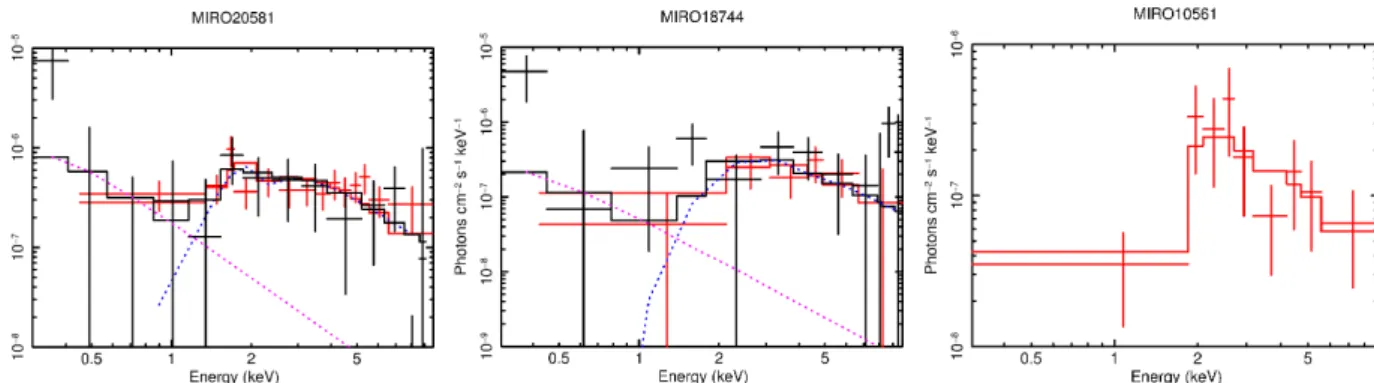
2. X-ray spectra. The X-ray spectra of the three X-ray de-tected MIR/O are shown in Fig. 4. Given the low photon statistics available for all the detected sources (in the range 20–150 net counts) we applied the Cstat statistic (Cash 1979) to the unbinned data and assumed a very simple model to re-cover a rough estimate of the nuclear obscuration and in-strinsic luminosity: a power-law with photon index fixed to Γ = 1.9 plus obscuration at the source redshift (plus galactic NH).
In the XMM-detected sources, a second component is re-quired by the data to model the soft emission. Indeed, as demonstrated in Lanzuisi et al. (2015a), given the com-plexity of the X-ray emission and the concurrent pres-ence of other processes, such as scattering components or emission from star formation, heavily obscured AGN can
Fig. 3.Log(LObs
X ) vs. Log (L5.8 µm) for several CT candidates. Grey
cir-cles represent literature CT candidate AGN (seeLanzuisi et al. 2015a, for more details). Red diamonds represent our MIRO targets; intrinsic X-ray luminosities of the X-ray detected objects are also indicated with upper bars. The green shaded area is the relation of Lutz et al. (2004) for a sample of low-redshift, unobscured AGN. The orange solid line is the relation for high-redshift unobscured AGN (Fiore et al. 2009), while the dashed and long dashed lines are the expected relation for a 1023cm−2
and 1024cm−2absorber.
be missed when fitting low-counting statistics data com-patible with a single power-law model (see also Lanzuisi et al. 2015b). For all these sources we derived column den-sity of NH≈ 2.5–7 × 1023cm−2with high uncertainties (see
Table 2). Although they are characterised by a high obscu-ration, the X-ray detected sources are not in the Compton Thick regime, as expected given current X-ray surveys lim-its and sensitivities, which is consistent with previous works (e.g.Lanzuisi et al. 2009;Georgakakis et al. 2010). The rest-frame intrinsic X-ray luminosities are also listed in Table2. The most luminous of the three sources is MIRO20581 with an X-ray luminosity ∼1045 erg s−1, while the other
two sources have inferred intrinsic luminosities slightly be-low 1044 erg s−1. These luminosities exceed of about 2 dex
those expected from stellar processes given the observed SFR (see below).
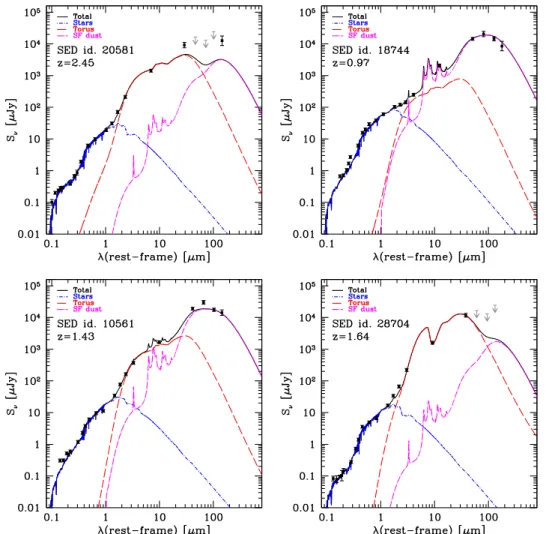
3. SED fitting: Fig.5 shows the SED fitting decomposition of the four targets considered in the paper, which were ob-tained making use of a modified version of the magphys
Fig. 4. X-ray spectra of MIRO20581 (left), MIRO18744 (centre) from XMM and Chandra, and MIRO10561 (right) from Chandra. The XMM (black) and Chandra (red) data of MIRO20581 and MIRO18744 are fitted with a double power law (as shown in the model components). The MIRO10561 Chandra data are instead fit with a single absorbed power law.
Table 2. MIRO/SINFONI sample: main properties.
MIRO NH log(L2−10) log(L5.8) log(Lbol) Sradio q24 M∗ SFR log(RSB)b E(B − V)host E(B − V)AGN
1023cm−2 erg s−1 erg s−1 erg s−1 µJy 1011M
M /yr (1) (2) (3) (4) (5) (6) (7) (8) (9) (10) (11) (12) 18 744 2.4+7.5−1.3 43.82 44.85 45.11 424 ± 28 2.3 2.0 99 0.2 0.5 2.7 10 561 2.9+1.8−1.3 43.96 45.35 45.97 72 ± 15 0.4 1.5 196 0.3 0.7 4.0 28 704 – – 45.32 47.63 154 ± 25 2.0 0.6 11(<25)a –0.8(<–0.5)a 0.5 4.1 20 581 6.8+3.0−2.1 45.00 45.89 46.61 5430 ± 60 –0.6 1.9 48(<132)a –0.6(<–0.2)a 0.6 2.0
Notes. (1) Target name; (2) column density; (3) intrinsic X-ray luminosity; (4) frame 5.8 µm luminosity; (5) bolometric luminosity; (6) rest-frame 1.4 GHz flux; (7) q24obs = log( f24 µm/ f1.4 GHz) (Bonzini et al. 2013); (8) stellar mass; (9) star formation rate; (10) starburstiness, defined as
the ratio between the specific star formation rate (sSFR= SFR/M∗) and that expected for main-sequence galaxies at given computed stellar mass
and spectroscopic redshift (sSFRMS,z), according to the relation ofWhitaker et al.(2012); (11) galaxy reddening; (12) AGN reddening.(a)Values
in the parenthesis refer to measurements constrained using upper limits in the FIR SED (see Fig.5).
code (da Cunha et al. 2008) designed to take into account a possible AGN emission component (Berta et al. 2013) and a modestly absorbed galaxy component. These targets have stellar mass M∗ in the range 0.6–2 × 10¹¹ M and SFR of
10–100 M /yr, and are in (or below) the main sequence (MS)
of star-forming galaxies (seeWhitaker et al. 2012), as sug-gested by their starbustiness, RSB = sSFR/sSRFMS,z (see
Table 2). For two sources, MIRO20581 and MIRO28704, the far-infrared emission is not well constrained (see Fig.5), hence, in the table SFR and RSB upper limits are also
re-ported (in parentheses); these values were computed treating the FIR upper limits as real detections.
In all cases the (observer frame) NIR emission is dominated by the host galaxy light and the AGN disk component suf-fers considerably extinction (E(B − V) = 2–4). According to the SED fitting decomposition, the 5.8 µm luminosity is dominated by the torus emission (hLtorus
5.8 µm/L total
5.8 µmi = 87%),
in agreement with the results from the bright DOG sample presented inRiguccini et al.(2015). This also confirm that the X-ray to mid-IR diagnostic discussed above is a reliable instrument to test the X-ray obscuration of the MIRO targets. According to the criteria in Dey et al. (2008), who clas-sified dust-obscured galaxies in AGN-dominated (“power-law” DOGs) and SF-dominated (“bump DOGs”) on the basis of the rest-frame optical to mid-infrared SED shape (see their Sect. 3.1.2, and their Fig.5), all four MIRO targets would be classified as power-law DOGs, although MIRO18744 appears to show intermediate characteristics between the two classes.
4. Radio: all the targets are also detected in the Very Large Array (VLA) observations of the COSMOS field (Schinnerer et al. 2010).Fiore et al.(2009) reported that QSOs selected
on the basis of the MIR/O excess at z ∼ 1.5 are more ra-dio luminous than unobscured type 1 QSOs of similar lu-minosity and redshift, when the intrinsic 5.8 µm luminosi-ties are compared (see alsoMartínez-Sansigre et al. 2005). MIRO20581 is the only radio loud target (q24obs= −0.6,
be-ing q24obs = log( f24 µm/ f1.4 GHz); see Bonzini et al. 2013,
Fig. 2) in our SINFONI sample, with L1.4 GHz = 4.5 ×
1025W Hz−1. MIRO20581 is also detected in the 3 GHz
sur-vey of the COSMOS field (Smolcic et al., in prep.) and is one of the most luminous sources in the Very Long Baseline Array (VLBA) COSMOS catalogue (Herrera-Ruiz et al., in prep.). The Jansky Very Large Array (JVLA) measure-ments for MIRO20581, at 3 and 1.4 GHz, imply an inverted radio spectral index, which is consistent with a compact ra-dio source rather than with a diffuse star-forming region. Indeed, we derive a SFR a factor of 10–40 larger than the SED fitting estimate for MIRO20581 using the relation be-tween the 1.4 GHz luminosity and the SFR introduced by
Condon (1992). Therefore, the radio luminosity is inter-preted as due to AGN activity. MIRO18744 and MIRO28704 are also detected in the VLBA catalogue and even in these cases, possible signatures of compact radio cores are present. 5. High ionisation diagnostics: for MIRO18744 a IMACS Magellan spectrum is available (Trump et al. 2007), sam-pling the rest-frame range 2850–4600 Å. The spectrum shows a prominent [NeV]3425 emission line, an unambigu-ous sign of obscured nuclear activity (Mignoli et al. 2013;
Lanzuisi et al. 2015b).
The main properties of our SINFONI sample discussed above are reported in Table 2, with the targets sorted by decreasing MIPS flux and increasing redshift. Overall, the multi-wavelength
Fig. 5.SED fitting of MIRO targets. The black dots represent the observed data points (in each panel, from left to right: Subaru U, B, g, V, r, i, z; VISTA Y, J, H, and Ks; the four Spitzer IRAC bands, Spitzer MIPS24; Hershel PACS, and SPIRE). The blue line shows the integrated extincted emission originating from the host galaxy. The magenta line represents the star formation contribution for dust absorption, partially redistributed across the MIR/FIR range in a self-consistent way (da Cunha et al. 2008;Berta et al. 2013;Delvecchio et al. 2014). The red line reproduces the AGN contribution and incorporates both the accretion disc and torus emission. The black solid line represents the sum of all components.
constraints we have in our 24 µm bright SINFONI targets sug-gest unambiguously the presence of obscured AGN activity. These characteristics correspond to those expected for objects caught in the post-merger, dust-enshrouded phase of rapid black hole growth (see e.g. Hopkins et al. 2008; Fiore et al. 2008,
2009).
3. SINFONI observations and data reduction
The observations were obtained in service mode using the near-infrared spectrometer SINFONI of the VLT in AO-assisted mode, during period 92A (from 2013-12-28 to 2014-03-30). All the targets in the sample were observed in one or two of the SINFONI filters (J, H, K, or HK), depending on the initial red-shift guess. We note that the program has only been partially exe-cuted (∼45%) and, therefore, our targets have not been observed with all the requested filters and/or for the entire requested time. We used a field of view (FoV) of 8 × 800in a 2D 64 × 64 spaxel frame. The spectral resolutions are R ∼ 1800 for J, R ∼ 2900 for H and R ∼ 1400 for HK.
We achieved a spatial resolution of 0.200 (FWHM) based
on the point spread functions (PSF) obtained in natural guide star (NGS) AO-mode, which roughly corresponds to 0.9 kpc at the average redshifts of z = 1.5. This spatial resolution is in
agreement with those obtained in other SINFONI AO-assisted observations (e.g.Bouché et al. 2013;Cresci et al. 2009). Our targets do not extend more than ∼1–200 in diameter, and were
therefore observed with on-source dithering in order to use the object exposure with the closest MJD as an approximation of a sky exposure. The information about the observations for each object are shown in Table1.
Besides the objects of the sample, a set of standard stars and their respective sky frames were also observed to flux calibrate the data. Guide star names are also reported Table 1. The stars have R magnitudes in the range 15 < R < 16.
The data reduction process was performed using ESOREX (version 2.0.5). We used the IDL routine “skysub.pro” (Davies 2007) to remove background sky emission. Then, we used our own IDL routines to perform the flux calibration and to reconstruct a final datacube for each object, adding the di ffer-ent pointings. The flux calibration was performed following the prescription indicated byPiqueras López et al.(2012).
4. Data analysis and spectral fits
Here, we briefly discuss the general data analysis and results of the spectral fits. In the following sections, we describe the
4800 4900 5000 -2 0 2 (a) (b) (c) (d)
Fig. 6.a) MIRO20581 HK-band spectrum around the [OIII] (left) and the Hα+[NII] complex (right). Superimposed on the spectrum are the best-fit
components (solid and dashed blue curves, with arbitrary normalisation to ease the visualisation). The red solid curves represent the sum of all com-ponents, including the power law. Dotted lines mark the wavelengths of the Hβ, [OII] doublet, Hα, [NII], and [SII] doublet. b) MIRO10561 H-band integrated spectrum around the Hα+[NII] complex. c) MIRO18744 J-band integrated spectrum around the Hα+[NII] complex. d) MIRO28704 HK-band integrated spectrum around the Hα+[NII] complex. See a) for the description of superimposed curves in b), c), and d) panels. In the bottom panelof each fit, the residuals with respect to the best fit are shown.
more detailed spatially resolved analysis for our best case, MIRO20581.
Figure6shows the one-dimensional integrated spectra, ex-tracted in a 1–200 diameter aperture, according to the
compact-ness of the source. All the targets show the Hα+ [NII] complex, with the exception of MIRO28704, which has a lower quality spectrum and in which only the Hα5 emission is detected. The only target for which we also detected the [OIII]5007 emission 5 The narrow feature at λ ≈ 6584 Å is associated with a wrong
sky-line subtraction. We discard the possibility that the observed sky-line is HeI10830 at z= 0.6. We fitted the SED imposing this redshift. This fit produced a significantly larger Chi square, four times the value obtained imposing z = 1.64. Indeed, at z = 0.6 the source would be undetected down to a luminosity of log(LX) ∼ 42.2 in the 2–10 keV band; with a
bolometric luminosity estimated by this SED fitting decomposition of log(Lbol) = 45.3, MIRO28704 would have a very unusual bolometric
correction of the order of kbol= Lbol/LX> 1000.
line is MIRO20581. MIRO10561 was observed in the J-band as well, but both [OIII] line and continuum emission were not detected. Instead, [OIII] emission line for the other two targets was not covered because of the incompleteness of the obser-vations (MIRO28704; see Sect. 3) and the wavelength cover-age of SINFONI instrument (MIRO18744; [OIII]5007 expected
at λobs−frame≈ 0.986 µm).
We simultaneously fitted each of the emission lines (from only one, Hα in MIRO28704 to a total of six, Hβ, [OIII] doublet, [NII] doublet and Hα, for MIRO20581) with Gaussian line pro-files. When more than one emission line is fitted, we constrained the centroids and the line flux ratios according to atomic physics, while the widths were fixed to be the same as each emission line (seePerna et al. 2015).
From the fit described above, we computed spectroscopic redshifts for our targets. We chose as redshift solution the one which produces the best fit of the narrow components of
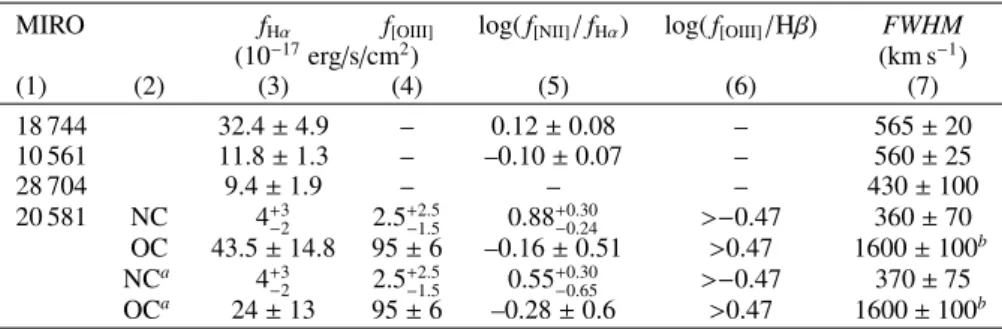
Table 3. Emission line properties in the integrated spectra.
MIRO fHα f[OIII] log( f[NII]/ fHα) log( f[OIII]/Hβ) FWHM
(10−17erg/s/cm2) (km s−1) (1) (2) (3) (4) (5) (6) (7) 18 744 32.4 ± 4.9 – 0.12 ± 0.08 – 565 ± 20 10 561 11.8 ± 1.3 – –0.10 ± 0.07 – 560 ± 25 28 704 9.4 ± 1.9 – – – 430 ± 100 20 581 NC 4+3−2 2.5+2.5−1.5 0.88+0.30−0.24 >−0.47 360 ± 70 OC 43.5 ± 14.8 95 ± 6 –0.16 ± 0.51 >0.47 1600 ± 100b NCa 4+3 −2 2.5+2.5−1.5 0.55+0.30−0.65 >−0.47 370 ± 75 OCa 24 ± 13 95 ± 6 –0.28 ± 0.6 >0.47 1600 ± 100b
Notes. (1) target name; (2) kinemetic component: NC= narrow component, OC = outflow component; (3) Hα flux; (4) [OIII]5007 flux; (5) diag-nostic [NII]6583/Hα flux ratio; (6) diagnostic [OIII]5007/Hβ flux ratio; (7) kinematic component width.(a)These results were obtained following
the second approach illustrated in Sect.5, adding a BLR component for the Hα profile.(b)The centroid of the OC profile is blueshifted ∼550 km s−1. the emission lines. We detected Hα and [NII] emission for
MIRO18744 at z = 0.97, consistent with the spectroscopic red-shift already available from the Magellan spectrum. For the remaining three sources, we were able to assign, for the first time, a spectroscopic redshift from our line fit (see Col. 13 in Table1). The spectroscopic redshifts are in general agreement with the photometric estimates available within the COSMOS survey (Salvato et al. 2011;Ilbert et al. 2009), with an accuracy of |zphot− zspec|/(1 + zspec). 0.1.
The results of the emission line fits are reported in Table3. To investigate the nature of the ionising source, we investigate the emission line ratios diagnostics [NII]/Hα and [OIII]/Hβ. The only source for which we have both [NII]/Hα and [OIII]/Hβ (MIRO20581) to calculate the BPT diagram (Baldwin et al. 1981) lies in their AGN photoionisation region. For the remain-ing sources, although with large uncertainties due to low-quality spectra, two out of three also show [NII]/Hα ratios consistent with an AGN origin (Veilleux & Osterbrock 1987), which is con-sistent with the AGN classification discussed in Sect. 2.1. The diagnostic line ratios are reported in Table3; lower limit in the [OIII]/Hβ ratios are due to the non-detected Hβ emission line.
Although there is a clear presence of two objects in the ACS-HST image of MIRO18744 (Fig.2), given the low signal-to-noise (S/N), the SINFONI spectrum is relative to both objects.
5. The ionised outflow in MIRO20581
We now concentrate on MIRO20581. To reproduce the line profiles in the [OIII] and Hα region we had to introduce an extra blueshifted and broad (FWHM ≈ 1600 km s−1) compo-nent (see Fig. 6, panel a). Emission from ionised gas in for-bidden lines like [OIII] cannot be associated with motion in the broad line region (BLR) because it would be suppressed by collisional de-excitation when produced in high-density re-gions (seeDevereux 2011, for an alternative explanation). For this reason, any broad (>550 km s−1) profile in these forbidden
lines is generally interpreted to be ascribed to outflowing ionised gas. Broad Hα profiles may be also ascribed to the presence of an ionised outflowing gas (e.g. Genzel et al. 2014); however, the Hα emission may suffer from severe contamination by the presence of the BLR motion and therefore may be considered less reliable tracer of outflows and the associated energetics. This is especially the case when the high-velocity BLR wings are not detected, as instead, it is the case of Mrk 231, for instance (Rupke & Veilleux 2011).
To investigate the ionised gas emission in MIRO20581 at best, and taking the considerations above into account, we
simultaneously fitted the Hβ+[OIII] and Hα+[NII] regions (see Sect.4for details) using two approaches. To reproduce the line profiles of all the emission lines, we fitted the two regions
1. with two sets of Gaussian profiles: one to account for the presence of NLR components (in the following narrow com-ponent, NC), with FWHM. 550 km s−1, and one for the
presence of outflow components (OC), with FWHM > 550 km s−1;
2. using the same components as above, namely the NC and OC components, and adding a broader profile (FWHM > 1900 km s−1) to account for the presence of the Hα emission
originated in the BLR.
The two fits have acceptable low residuals and adequately rep-resent the shape of the line profiles, hence, it is not possible to confirm or exclude the presence of the BLR emission in this source, at least with this S/N. The results of these two ap-proaches are reported in Table3. If present, the Hα BLR emis-sion would have a FWHM of about 2500–3000 km s−1. The
lower value has been obtained fitting the entire Hα+[NII] pro-file with only one Gaussian. The NII/Hα ratio depends on the detailed modelling but, in both cases, the emission lines remain in the AGN photoionisation region (see previous section).
We performed a tentative fit with two sets of Gaussian pro-files, taking only NLR and BLR components into account. This has shown high residuals especially in the [OIII]5007 profile. Figure7shows these residuals.
5.1. Spatial analysis
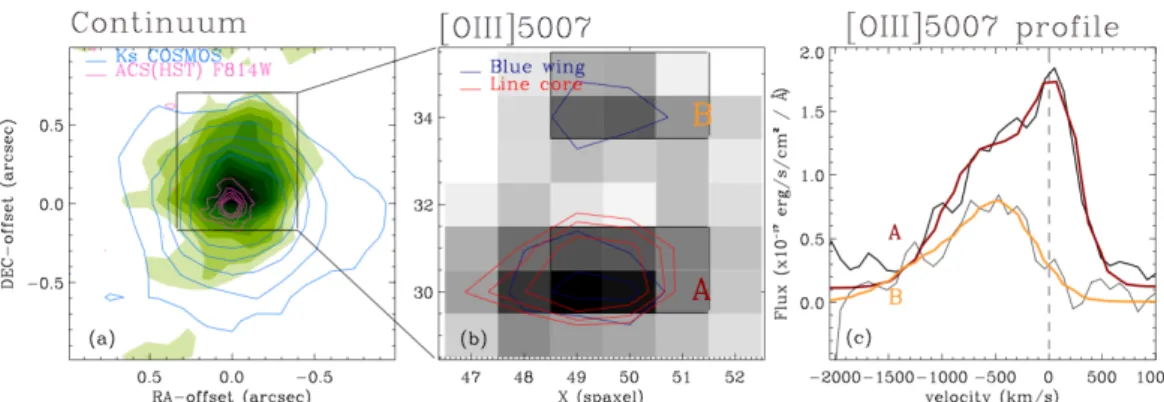
Figure8, panel a shows the contour plot of the median SINFONI datacube in steps of 1σ starting from 3σ over the entire HK wavelength range (green scale). The standard deviation σ was computed in a 1.25–1.7500 annulus centred on the target. The
astrometry in the SINFONI datacube was performed using the Ks COSMOS cutout, obtaining a match between the coordinates of the peak of intensity in the Ks COSMOS cutout and in the median SINFONI datacube. In Fig.8a, the Ks COSMOS con-tours are over-imposed on the SINFONI datacube (cyan solid curves). We also show the HST/ACS F814W contours at higher resolution (magenta curves; see also Fig. 1).
Figure8, panel b shows the [OIII]5007 map integrated on the continuum-subtracted total line profile (grey scale) with over-imposed contour levels (starting from 3σ) of the emission of the line core (5000–5014 Å; width ∼800 km s−1) and of the blueward part (4973–5000 Å; width ∼1600 km s−1) of the line profile.
Fig. 7.MIRO20581 residuals in the [OIII] and Hα range obtained by fitting the observed lines with only NLR and BLR components. (See Sect. 5; to be compared to Panel a of Fig.6.)
Blueshifted emission is found out to a distance of R = 0.600
(as-sociated with region B), i.e. 4.8 kpc from the nucleus. Instead, the core emission is less extended and could be associated with the narrow component of the [OIII] profile.
5.2. Kinematic analysis
To map the line emission distributions and corresponding ve-locities, a nuclear and an off-nuclear spectra are extracted from two 3 × 2 spaxel regions (3 × 2 kpc) close to the central and off-nuclear peaks in the [OIII] channel map (Fig.8, panel b, re-gions A and B labelled with black boxes; see alsoPerna et al. 2015; Cresci et al. 2015). In Fig.8, panel c we show the inte-grated spectra over the two regions: red and orange solid lines represent the nuclear and off-nuclear line profiles, respectively.
In both cases, the [OIII] profiles are broad, with widths of FWHM = 1400–1200 km s−1, and maximum velocities of 1600–1650 km s−1 (nuclear and off-nuclear spectrum). In
the off-nuclear region, the centroid of the emission lines is blueshifted ∼700 km s−1.
5.3. Outflow properties
Assuming that the broad and shifted [OIII] component can be associated with an outflowing wind, the kinetic power (Pion
K ) and
mass-outflow rate ( ˙Mion
out) of the outflow can be computed
un-der reasonable assumptions in the case of a biconical geome-try. First of all, given that the electron density of the outflow-ing gas cannot be estimated directly from the data because of the low quality of spectra in the [SII] region (see Fig. 6), and the metallicity indicators (Pettini & Pagel 2004;Yin et al. 2007) are not useful because of the AGN ionising radiation, we as-sumed standard values of ne (100 cm−3) and metallicity
(so-lar). Generally, the Hβ luminosity is used to calculate the total amount of gas and mass outflow rate (e.g.Liu et al. 2013;Cresci et al. 2015). However, in our case this line is not detected, and we have adopted theCano-Díaz et al.(2012) formulae, which instead employ the [OIII] line luminosity:
PionK = 5.17 × 1043
CL44([OIII])v3out,3
ne3Rkpc10[O/H]
erg s−1, (1) ˙
Mionout = 164 × 1043CL44([OIII])vout,3 ne3Rkpc10[O/H]
M s−1, (2)
where L44([OIII]) is the [OIII] luminosity associated with the
outflow component in units of 1044 erg s−1, n
e3 is the electron
density in units of 1000 cm−3, vout,3is the outflow velocity voutin
unit of 1000 km s−1, C is the condensation factor (≈1), 10[O/H]is
the metallicity in solar units, and Rkpcis the radius of the
outflow-ing region in units of kpc. We therefore used the [OIII]5007 flux associated with the outflow component in the 100integrated spec-trum (Fig. 6, panel a). We further adopted a spatial extension of 4.8 kpc for the outflowing gas given that we observe the blue-ward emission out to this distance (see Fig.8, panel b; Sect. 5.1). Finally, we considered as outflow velocity the maximum veloc-ity observed vmax in the nuclear region (vout = 1600 km s−1;
see Sect.5.2), and we assumed that lower velocities are due to projection effects (Cano-Díaz et al. 2012;Cresci et al. 2015).
Following the Cano-Díaz et al. formalism, the kinetic power is Pion
k = 1.5×10
44erg s−1, while the outflow mass rate is ˙Mion
out =
190 M yr−1, consistent with the values observed for targets at
similar bolometric luminosities (Carniani et al. 2015). These equations assume a simplified model in which the wind occurs in a conical region uniformly filled with outflowing ionised clouds. The values, not corrected for extinction and only regarding the ionised component of the outflow (see also the other conserva-tive conditions inCano-Díaz et al. 2012; and the discussion in
Perna et al. 2015, Sect. 6.1), represent lower limits to the total outflow power.
The kinetic power is ≈0.4% of the AGN bolometric luminos-ity also inferred from the SED fitting decomposition, in rough agreement with the predictions of AGN feedback models (few % of Lbol, King 20056). The momentum flux, ˙Pionk = ˙Mvout is
2 × 1036 dyne, ≈2 times the radiative momentum flux from the
central black hole, Lbol/c. Its momentum boost, i.e. the ratio
be-tween ˙Pion
k and Lbol/c is in agreement with those observed in
X-ray winds (e.g. Tombesi et al. 2015), rather than with the ratios associated with ionised and/or molecular outflows (e.g.
Cicone et al. 2014;Perna et al. 2015). This discrepancy how-ever, could be totally attributed to the fact that our estimate of the momentum flux represents a lower limit. In fact, correcting the [OIII] luminosity for an E(B − V)= 1.3 calculated from the SED fitting decomposition7, we obtain a mass outflow rate a factor
of ∼10 larger (∼2000 M /yr). Consequently, we obtain a
mo-mentum flux and momo-mentum boost in more reasonable agree-ment with the results reported in the literature (namely: a mo-mentum boost 20 times Lbol/c, a kinetic power ≈4% Lbol/c)
and favouring an “energy-conserving” nature of the observed large-scale ionised outflow (see e.g.Carniani et al. 2015, and references therein).
However, these results are based on few assumptions whose contributions are worth noting. Estimates of the electron den-sity of outflowing region have been obtained in few low-z AGN and ultra-luminous infrared galaxies (e.g. Villar-Martín et al. 2014;Rodríguez-Zaurín et al. 2013) and high-z QSOs (e.g.Perna et al. 2015; Brusa et al., in prep.) with values between 102
and 103 cm−3. Although the value we used in Eqs. (1) and (2) is routinely used in the literature (e.g.Liu et al. 2013;Harrison et al. 2014; Cresci et al. 2015), outflow energetics may be a factor of 10 lower if ne = 103 cm−3is adopted. A further
fac-tor of 1/2 should be considered, taking the assumption on the 6 However, our kinetic power estimate is related to the only ionised
component, while the prediction considers all the outflow components (i.e. molecular, atomic, and ionised components).
7 This value has been obtained as rough estimate assuming for the
out-flowing material a reddening value in between the E(B − V) estimated for the AGN and galaxy components (see Table2). In fact, possible dif-ferential obscuration between nuclear and off-nuclear regions may be present.
Fig. 8.a) MIRO20581 contour plot of the median SINFONI datacube over the entire HK wavelength range (green scale, in steps of 1σ starting from 3σ), with over-imposed the Ks COSMOS (cyan; starting from 3σ, in steps of 3σ) and ACS HST contours (magenta; starting from 3σ, in steps of 3σ). b) [OIII]5007 channel map obtained integrating the continuum-subtracted SINFONI datacube on the total line profile (4973–5024 Å) of the region selected in panel a). The contours levels are in steps of 1σ (starting from 3σ) and show the [OIII] emission coming from the core (5000–5014 Å) and from the bluer (4973–5000 Å) part of the line profile. c) [OIII] line profiles obtained from integrated spectra over the spaxels selected in the two regions A and B in panel b). Vertical dashed lines represent the systemic velocity obtained from the 100
integrated spectrum.
Table 4. MIRO20581 outflow energetics.
Basic asm Min. asm Max. asm
(1) (2) (3) ˙ Pion k (erg s −1) 1.5 × 1045 3.8 × 1043 4.6 × 1046 ˙ Mion out(M yr−1) 2000 48 20 000 Pion k /Lbol 0.04 0.001 0.4 ˙ Pion k /(Lbol/c) 20 0.5 200
Notes. Energetic values obtained from Eqs. (1) and (2) using basic as-sumptions (Col. 1), minimising asas-sumptions (Col. 2), and maximising assumptions (Col. 3) on ne, metallicity, and extinction.
metallicity into account, if metal-rich regions are present (see
Perna et al. 2015). Finally, we considered a reddening value in between the E(B − V) estimated for the AGN and galaxy com-ponents (see Table2). Considering the AGN (galaxy) reddening E(B − V) estimate instead of the average, the [OIII]5007 flux and therefore all the energetics should be corrected by a factor of 100 (5). However, all of the basic assumptions previously out-lined are in agreement with those adopted in similar studies in the literature and, in the case of the reddening value, reasonable. For completeness, we report in Table4all the energetic values with ranges obtained minimising and maximising the Eqs. (1) and (2), using all the possible alternative assumptions above described.
6. Discussion
We analysed the NIR SINFONI spectra of four candidate ob-scured QSOs, selected from the COSMOS survey on the basis of red mid-infrared to optical and optical to near-infrared colours.
Broad profiles in the [OIII] and Hα lines with FHWM > 550 km s−1 (OC component), which are
com-monly used as signposts of outflows, have only been detected in one source, MIRO20581. We cannot exclude the presence of faint OC components in the other sources, given the low quality of the spectra and lack of the [OIII]5007 emission, which is a better optical tracer for outflows. Overall, the integrated spectra of the other three sources have low S/N (with emission lines detected at ∼3σ) and faint outflow components in the Hα+[NII] could still be present. Alternatively, the high obscuration of the sample, as established via the SED decomposition, the X-ray
spectra, and the X-ray to mid-IR ratios (see Sect. 2.1), might suggest that these sources are in the rapid black hole growth phase, an epoch at which the scaling relations between host galaxies and black hole properties are not yet established and winds have not yet been launched (King 2005). If it is the case, MIRO20581 is different from these other three sources. We investigate this scenario in the following section.
6.1. Comparison with literature
In this section, we compare the properties of our MIRO tar-gets with those of a sample of AGN-dominated DOGs reported in the literature and discuss their main similarities and di ffer-ences. Several studies have shown that DOGs with large f24 µm
flux (&1 mJy) exhibit higher AGN activity, higher concentration, and smaller physical size. Vice versa, DOGs with lower f24 µm
exhibit higher SF activity and larger physical size (Melbourne et al. 2011; Riguccini et al. 2015). Although it is shown that the rest-frame optical morphologies of the most luminous DOGs have little sign of ongoing mergers (Melbourne et al. 2008,2009;
Bussmann et al. 2009), there are also indications of non-regular gas kinematics in their host galaxies (Melbourne et al. 2011) and, moreover, several arguments suggest that they could be post-merger products of gas-rich mergers (see e.g.Melbourne et al. 2009). Merger simulations were able to reproduce their colours and luminosities and indicate an infrared to optical drop as gas consumption and AGN-driven wind terminate both SF and BH growth (Narayanan et al. 2010).
Brand et al.(2007) studied NIR Keck spectra of a sample of ten AGN-dominated DOGs selected in the 9 deg2NOAO Deep Wide-Field Survey Boötes field (Jannuzi & Dey 1999). Most of their spectra have low S/N and it is not possible to rule out the presence of outflows in the observed emission lines, but a promi-nent broad (FWHM ∼ 1600 km s−1) [OIII]5007 profile was
de-tected in one target, SST24 J1428+34. Hα or Hβ BLR have been found in 70% of them.Melbourne et al.(2011) instead presented a sample of four AGN-dominated DOGs with high spatial res-olution Keck OSIRIS integral field spectroscopy. The sources were also selected in the Boötes field and the main selection cri-teria was the strong Hα BLR detection in available NIR spectro-scopic observations (e.g. from the sameBrand et al. 2007, sam-ple). They found that the BH masses of their sample are small for their host galaxy luminosities when compared with z ∼ 2
and local unobscured AGNs (see their Sect. 5.1). Indeed, they did not find any evidence of outflows in the hosts, which cor-responds with the above-cited predictions ofKing(2005). They also reported SFRs < 100 M yr−1 for all targets. Finally, the
Brusa et al.(2015) sample has been selected on the basis of red R − K colours (with a cut at KAB < 19), and high X/O ratio.
The latter selection criterion is roughly equivalent to the high MIR/O ratio (seeFiore et al. 2008). To confirm this, we added the two brightest sources (XID2028 and XID5321;Perna et al. 2015) in theBrusa et al.(2015) sample in Fig.1(with blue star and square), as representative of the entire sample. Evidence of outflows have been found in 75% of objects and a similar percentage of BLR emissions have been found.
Overall, all these sources have similar colours and MIR/O ra-tios to those of our MIRO targets (see Fig. 1; cyan stars and squares represent the sources in Melbourne et al. (2011) and
Brand et al.(2007) samples with K-band measurement). While BLR emission may be present only in one out four of our tar-gets (MIRO20581; see Sect. 5), a large number ofBrusa et al.
(2015), Melbourne et al. (2011), and Brand et al. (2007) ob-scured QSOs exhibit BLR emission. However, as already men-tioned, the Melbourne et al. (2011) targets were preselected to have a strong Hα detection and, in general, all the targets in these three comparative samples have strong K-band emis-sion (KAB . 20): the Brusa et al.(2015) sample has been
se-lected requiring a KAB < 19; the Boötes field from which the
Melbourne et al. (2011) andBrand et al. (2007) DOGs were selected, has considerably shallower NIR observations than the COSMOS field (KAB< 23,McCracken et al. 2010; KAB< 20.8,
Dey et al. 2008, respectively). On the contrary, for the observa-tions proposed in this work, we did not impose any flux thresh-old. Hence, it seems that the presence of BLR emission is re-lated to the K-band flux. This offers a possible interpretation. All these targets are AGN-dominated DOGs at z ∼ 2; therefore, an higher K-band flux may correspond to a higher rest-frame op-tical AGN continuum emission, which is proper of AGN show-ing BLR emission. Vice versa, our sample, with KAB & 20, is
dominated by rest-frame optical host-galaxy continuum emis-sion (see Fig.5). The X-ray absorption is fully consistent with type 2 (1.9 in the case of MIRO20581) classification obtained by the SINFONI spectra.
The only object in which we detected the outflow, MIRO201581, stands out with respect to the other targets. Although sharing the same X-ray luminosities of theBrusa et al.
(2015) targets, the X-ray spectrum of MIRO20581 shows a high column density (NH≈ 7×1023cm−2) that is larger than those
ob-served for the X/O targets (NH≈ 1021.6cm−2,Perna et al. 2015).
This difference may be attributed mainly to line of sight effects, which intersect a larger portion of the torus in MIRO20581 with respect to thePerna et al.(2015) targets, and would also explain the fact that we do not detect a dominant BLR component in the Hα in MIRO20581. Alternatively, the high extinction seen in the SED in both the AGN and host-galaxy components may be related to large scales obscurations.
Assuming that the Hα+[NII] complex of MIRO20581 is composed of NC, OC, and a BLR component, its black hole mass can be estimated using theBongiorno et al.(2014) formula, assuming a FWHM of the Hα BLR emission of 3000 km s−1(see Sect. 5), log(MBH/M ) = 8.4. Considering the stellar mass
es-timated by SED fitting decomposition (log(M∗/M ) = 11), we
measure a central black hole to stellar mass ratio of the host of ∼0.002, comparable with the ratios of unobscured QSO at the same redshift (Bongiorno et al. 2014;Merloni et al. 2010). Hence, it seems that outflows are present only in sources for
which the MBH− M∗relation has been fixed, in agreement with
the predictions ofKing(2005).
From the comparison between Lbol (Table 2) and the
Eddington luminosity associated with the MBH, we also infer a
high Eddington ratio (Lbol/LEdd ∼ 1). All these properties (high
Eddington ratio, high extinction, MBH/M∗ ∼ 0.002) point
to-wards the interpretation that MIRO20581 could be associated with the beginning of the blow-out phase. On the other hand, its SFR and starbustiness are low (but still within ±0.6 dex of the MS; see Table2), indicating perhaps an advanced state of the ongoing process of negative feedback (see alsoBalmaverde et al. 2015). We underline that its FIR emission is not well constrained (see Fig.5); hence we calculated as upper limit a SFR = 132 M /yr, treating the FIR upper limits as real
de-tections. A higher SFR, and consequently a higher sSFR, may be more consistent with the beginning of a blow-out phase in which the effects of feedback are still marginal and the SF is still occurring.
In theNarayanan et al.(2010) simulations, AGN-dominated DOGs appear after the peak of the star formation, and therefore not necessarily associated with Starburst phase, given that the time scales of the two processes are not the same. Indeed, results recently presented inRiguccini et al.(2015) showed that 50% of AGN-dominated DOGs detected by Herschel display sSFRs that place them in or above the MS, while the remaining 50% are below the MS, indicating perhaps an ongoing quenching of the star formation due to the AGN activity. In this scenario, small SFRs observed in dust-obscured, massive main-sequence galax-ies hosting AGNs, such those of MIRO10561, MIRO28704, MIRO18744, and those presented inMelbourne et al. (2011), may be associated with systems that are still actively growing their black holes.
7. Summary
The main results from the multi-wavelength analysis and the SINFONI data on the small sample of mid-infrared bright, red quasars we present here are as follows. All the sources but MIRO28704, selected from the 24 µm Spitzer MIPS survey as candidate obscured QSO, are confirmed highly (NH≈ 2.5–7 × 1023cm−2) obscured AGN from our detailed
analysis. For MIRO28704, we only found indications of a CT na-ture (see Sect. 2.1). We successfully provided a spectroscopic redshift for three objects for which we had only a photometric estimate (see Sect. 4). We revealed the presence of a powerful ionised outflow extended out to ∼4.8 kpc in only one source, MIRO20581 at z= 2.45. The large velocity (1600 km s−1) and outflow mass rate (2000 M /yr) for MIRO20581 are not
sustain-able by star formation. The energetics of the outflow are consis-tent with an energy-conserving mechanism (Sect. 5); the inferred Eddington ratio (λEdd ∼ 1), together with its highly obscured
nature, point towards the interpretation that this source may be caught in the blow-out phase. We collected several arguments that point towards the fact that luminous ( f24 µm> 1 mJy)
AGN-dominated DOGs may be objects in the transition phase between the post-merger starburst and unobscured QSO phases. The oc-currence of outflows seems to be associated with the end of the rapid BH growth, when the MBH− M∗relation has been already
established (see Sect. 6.1). The efficiency of this mid-infrared to optical and optical to near-infrared colours selection criteria in detecting objects in the blow-out phase may be lower when com-pared to other selection criteria (e.g.Brusa et al. 2015;Glikman et al. 2007). This may be because higher obscuration could be associated with a still ongoing process of BH growth, preceding
the blow-out phase (see Sect. 6). To confirm this statement, how-ever, higher S/N spectra are required. Since MIRO20581 is the only target with outflow and an X-ray luminosity of 1045erg s−1 (see Sect. 2), we suggest that sources in the blow-out phase can be most efficiently isolated from shallow X-ray surveys rather than solely on their high MIR/O colours (see alsoBrusa et al. 2015).
In recent years, several detections of AGN-driven outflows on kpc scale, probed by ionised gas kinematics, have been re-ported in the literature (see Carniani et al. 2015for an updated compilation), and MIRO20581 is the last addition to this sparse and inhomogeneously assembled sample. Moreover, definitive evidences of the impact of the detected outflows on the host galaxies are still missing. To quantify how common AGN driven outflows are and the impact of the wind in the hosts, NIR IFU AO-assisted observations of large (e.g. several tens) and ho-mogeneously selected (e.g. from X-rays) samples of AGN are needed. We will address these issues in the near future through a SINFONI Large Program, “SUPER” (SINFONI Survey for Unveiling the Physics and the Effect of Radiative feedbacK, PI: V. Mainieri), which will target the first statistically sound sam-ple (∼40 AGN and QSOs drawn from the COSMOS, CDFS and SDSS surveys) over four order of magnitudes in bolometric lu-minosities, and spanning all possible AGN (e.g. NH, Eddington
ratio) and hosts (e.g. starburstiness) properties.
Acknowledgements. M.P., M.B., and G.L. acknowledge support from the FP7 Career Integration Grant “eEASy” (“SMBH evolution through cosmic time: from current surveys to eROSITA-Euclid AGN Synergies”, CIG 321913). M.B. gratefully acknowledges fundings from the DFG cluster of excellence “Origin and Structure of the Universe” (http://www.universe-cluster. de). We acknowledge financial support from INAF under the contracts PRIN-INAF- 2011 “Black Hole growth and AGN feedback through cosmic time”), from PRIN MIUR 2010-2011 (“The dark Universe and the cosmic evolu-tion of baryons”), and from PRIN-INAF-2014 (“Windy Black Holes combing galaxy evolution”). We gratefully acknowledge the unique contribution of the entire COSMOS collaboration for making their excellent data products pub-licly available; more information on the COSMOS survey is available athttp: //www.astro.caltech.edu/~cosmos. We thank Francesca Civano for shar-ing COSMOS legacy data before publication and for useful comments. We thank the anonymous referee for his/her interest in the results of our work, and useful suggestions that improved the presentation of the results.
References
Alexander, D. M., Vignali, C., Bauer, F. E., et al. 2002,AJ, 123, A1149
Baldwin, J. A., Phillips, M. M., & Terlevich, R. 1981,PASP, 93, 5
Balmaverde, B., Marconi, A., Brusa, M., et al. 2015, A&A, in press, DOI: 10.1051/0004-6361/201526694
Berta, S., Lutz, D., Santini, P., et al. 2013,A&A, 551, A100
Bonzini, M., Padovani, P., Mainieri, V., et al. 2013,MNRAS, 436, 3759
Bongiorno, A., Maiolino, R., Brusa, M., et al. 2014,MNRAS, 443, 2077
Bouché, N., Murphy, M. T., Kacprzak, G. G., et al. 2013,Science, 341, 50
Brand, K., Dey, A., Weedman, D., et al. 2006,ApJ, 644, 143
Brand, K., Dey, A., Desai, V., et al. 2007,ApJ, 663, 204
Brandt, W. N., & Alexander, D. M. 2015,A&ARv, 23, 1
Brusa, M., Civano, F., Comastri, A., et al. 2010,ApJ, 716, 348
Brusa, M., Bongiorno, A., Cresci, G., et al. 2015,MNRAS, 446, 2394
Bussmann, R. S., Dey, A., Lotz, J., et al. 2009,ApJ, 693, 750
Cano-Díaz, M. R., Marconi, A., Netzer, H., et al. 2012,A&A, 537, L8
Cappelluti, N., Hasinger, G., Brusa, M., et al. 2007,ApJS, 172, 341
Carniani, S., Marconi, A., Maiolino, R., et al. 2015,A&A, 580, A102
Cash, W. 1979,ApJ, 228, 939
Cicone, C., Maiolino, R., Sturm, E., et al. 2014,A&A, 562, A21
Civano, F. 2015,A&AS, 225, 222.06
Civano, F., Elvis, M., Brusa, M., et al. 2012,ApJS, 201, 30
Condon, J. J. 1992,ARA&A, 30, 575
Cresci, G., Hicks, E. K. S., Genzel, R., et al. 2009,ApJ, 697, 115
Cresci, G., Mainieri, V., Brusa, M., et al. 2015,ApJ, 799, 81
da Cunha, E., Charlot, S., Elbaz, D., et al. 2008,MNRAS, 388, 1595
Davies, R. I. 2007,MNRAS, 375, 1099
Della Ceca, R., Carrera, F. J., Caccianiga, A., et al. 2015,MNRAS, 447, 3227
Del Moro, A., Watson, M. G., Mateos, S., et al. 2009,A&A, 493, 445
Delvecchio, I., Gruppioni, C., Pozzi, F., et al. 2014,MNRAS, 439, 2736
Devereux, N. 2011,ApJ, 727, 93
Dey, A., Soifer, B. T., & Desai, V. 2008,ApJ, 677, 943
Donley, J. L., Rieke, G. H., Pé rez-Gonzá lez, P. G., & Barro, G. 2008,ApJ, 687, 111
Elvis, M., Civano, F., Vignali, C., et al. 2009,ApJS, 184, 158
Fiore, F., Brusa, M., Cocchia, F., et al. 2003,A&A, 409, 79
Fiore, F., Grazian, A., Santini, P., et al. 2008,ApJ, 672, 94
Fiore, F., Puccetti, S., Brusa, M., et al. 2009,ApJ, 693, 447
Gandhi, P., Host, H., Smette, A., et al. 2009,A&A, 502, 457
Genzel, R., Föerster-Schreiber, N., Rosario, D., et al. 2014,ApJ, 796, 7
Georgakakis, A., Rowan-Robinson, M., Nandra, K., et al. 2010,MNRAS, 406, 420
Glikman, E., Gregg, M. D., Lacy, M., et al. 2004,ApJ, 607, 60
Glikman, E., Helfand, D. J., White, R. L., et al. 2007,ApJ, 667, 673
Harrison, C. M., Alexander, D. M., Mullaney, J. R., & Swin-bank, A. M. 2014,
MNRAS, 441, 3306
Hopkins, P. F., Hernquist, L., Cox, T. J., & Keres, D. 2008,ApJS, 175, 356
Ilbert, O., Capak, P., Salvato, M., et al. 2009,ApJ, 690, 1236
Ivison, R. J., Magnelli, B., Ibar, E., et al. 2010,A&A, 518, A31
Jannuzi, B. T., & Dey, A. 1999, in ASP Conf. Ser., 191, Photometric Redshifts and the Detection of High Redshift Galaxies (San Francisco: ASP), 111 King, A. 2005,ApJ, 635, L121
Lanzuisi, G., Piconcelli, E., Fiore, F., et al. 2009,A&A, 498, 67
Lanzuisi, G., Ponti, G., Salvato, M., et al. 2014,ApJ, 781, 105
Lanzuisi, G., Perna, M., Delvecchio, I., et al. 2015a,A&A, 578, A120
Lanzuisi, G., Ranalli, P., Georgantopoulos, I., et al. 2015b,A&A, 573, A137
Le Floc’h, E., Aussel, H., Ilbert, O., et al. 2009,ApJ, 703, 222
Liu, G., Zakamska, N. L., Greene, J. E., Nesvadba, N., & Liu, X. 2013b,
MNRAS, 436, 2576
Lutz, D., Maiolino, R., Spoon, H. W. W., & Moorwood, A. F. M. 2004,A&A, 418, L465
Martínez-Sansigre, A., Rawlings, S., & Lacy, M. 2005,Nature, 436, 666
Mateos, S., Carrera, F. J., Alonso-Herrero, A., et al. 2015,MNRAS, 449, 1422
McCracken, H. J., Capak, P., Salvato, M., et al. 2010,ApJ, 708, 202
Melbourne, J., Desai, V., Armus, L., et al. 2008,AJ, 136, 1110
Melbourne, J., Bussmann, R. S., Brand, K., et al. 2009,AJ, 137, 4854
Melbourne, J., Peng, C. Y., Soifer, B. T., et al. 2011,AJ, 141, 141
Menci, N., Fiore, F., Puccetti, S., & Cavaliere, A. 2008,ApJ, 686, 219
Merloni, A., Bongiorno, A., Bolzonella, M., et al. 2010,ApJ, 708, 137
Mignoli, M., Pozzetti L., Comastri A., et al. 2004,A&A, 418, 827
Mignoli, M., Vignali, C., Gilli, R., et al. 2013,A&A, 556, A29
Narayanan, D., Dey, A., Hayward, C. C., et al. 2010,MNRAS, 407, 1701
Perna, M., Brusa, M., Cresci, G., et al. 2015,A&A, 574, A82
Pettini, M., & Pagel, B. E. J. 2004,MNRAS, 348, L59
Piqueras Lopez, J., Colina, L., Arribas, S., et al. 2012,A&A, 546, A64
Riguccini, L., Le Floc’h, E., Ilbert, O., et al. 2011,A&A, 534, A81
Riguccini, L., Le Floc’h, E., Mullaney, J. R., et al. 2015,MNRAS, 452, 470
Rodríguez-Zaurín, J., Tadhunter, C. N., Rose, M., & Holt, J. 2013,MNRAS, 432, 138
Rupke, D. S. N., & Veilleux, S. 2011,ApJ, 729, L27
Salvato, M., Ilbert, O., Hasinger, G., et al. 2011,ApJ, 742, 61
Sanders, D. B., Salvato, M., Aussel, H., et al. 2007,ApJS, 172, 8
Schinnerer, E., Sargent, M. T., Bondi, M., et al. 2010,ApJS, 188, 384
Scoville, N., Aussel, H., Bruso, M., et al. 2007,ApJS, 172, 1
Spergel, D. N., Verde, L., Peiris, H. V., et al. 2003,ApJS, 148, 175
Stern, D. 2015,ApJ, 807, 129
Stern, D., Lansbury, B., & Assef, R. J. 2014,ApJ, 794, 102
Sturm, E., González-Alfonso, E., Veilleux, S., et al. 2011,ApJ, 733, L16
Tombesi, F., Meléndez, M., Veilleux, S., et al. 2015,Nature, 519, 436
Trump, J. R., Impey, C. D., McCarthy, P. J., et al. 2007,ApJS, 172, 383
Urrutia, T., Lacy, M., Spoon, H., et al. 2012,ApJ, 757, 125
Veilleux, S., & Osterbrock, D. E. 1987,ApJS, 63, 295
Villar-Martín, M., Emonts, B., Humphrey, A., et al. 2014,MNRAS, 440, 3202
Whitaker, K. E., van Dokkum, P. G., Brammer G., & Franx, M. 2012,ApJ, 754, 29
![Fig. 6. a) MIRO20581 HK-band spectrum around the [OIII] (left) and the Hα+[NII] complex (right)](https://thumb-eu.123doks.com/thumbv2/123doknet/14781962.596928/8.892.167.732.108.747/fig-miro-band-spectrum-oiii-left-complex-right.webp)
![Fig. 7. MIRO20581 residuals in the [OIII] and Hα range obtained by fitting the observed lines with only NLR and BLR components](https://thumb-eu.123doks.com/thumbv2/123doknet/14781962.596928/10.892.80.420.112.326/miro-residuals-oiii-range-obtained-fitting-observed-components.webp)