Cycle Time Reduction Through Wafer Starts Control by
Sam Wang
Bachelor in Science in Industrial Engineering & Operations Research, University of California, Berkeley (2002)
Submitted to the MIT Sloan School of Management and the Engineering Systems Division
In Partial Fulfillment of the Requirements for the Degrees of Master of Business Administration
and
Master of Science in Engineering Systems
In Conjunction with the Leaders for Manufacturing Program at the Massachusetts Institute of Technology
June 2008
© 2008 Massachusetts Institute of Technology. All rights reserved.
Signature of Author
V MIT Sloan Sc 1 of Management and Engineering Systems Division May 9, 2008
Certified by ..
Stephen Graves, Thesis Supervisor Abraham Siegel Professor of Management Certified by
Deborah J. Night( gale, Th&es Supelisor Professor of Engineering Systems and Aeronautics & Astronautics Engineering
Accepted by - -
-Debbie Berechman
Executive Director, MIT Sloan MBA Program Accepted by
Richard Larson MASSACHUSETTS INS OTUTE Professor of Engineering Systems Division
Chair, Engineering Systems Division Education Committee
JUN 2
5 2008
LIBRARIES
MCbiIVES
Cycle Time Reduction Through Wafer Starts Control By Sam Wang
Submitted to the MIT Sloan School of Management and the Engineering Systems Division on May 9, 2008 in Partial Fulfillment of the Requirements for the Degrees of
Master of Business Administration
and
Master of Engineering Systems
Abstract
Intel's Fab 17, located in Hudson, Massachusetts, has experienced dramatic
improvements in its cycle time performance in the last two years. These improvements have been attributed to lean implementation efforts, reduced tool variability, as well as
other key initiatives. In its efforts to continuously improve cycle time and cycle time variability, a new methodology of conducting wafer starts was developed and pilot implementations were conducted. The new methodology was based upon the concept of Little's Law of Cycle Time = Inventory / Output, whereby controlling the level of
inventory through wafer starts would positively impact cycle time performance. Thus, by monitoring the current Work-in-Process levels at selected areas of operations and
contrasting it with the optimal levels based upon Little's Law, an appropriate level of wafer starts could be determined.
Close collaboration between the manufacturing, engineering, and planning departments allowed for the creation and pilot implementations of the wafer starts control model. The pilot implementations were conducted in three separate phases, providing opportunities for data analyses and methodology improvements. Model parameters and logic were modified between each phase to better reflect actual fab realities and to achieve more effective outcomes. Positive results were observed during the pilot implementations, as cycle time variability (as defined by standard deviations) decreased and overall fab cycle time remained consistently lower, all during a period of increased production. As of the conclusion of the internship, Fl7 planned to adopt the wafer starts control model as part of its routine starts process.
Thesis Supervisor: Stephen C. Graves
Title: Abraham Siegel Professor of Management, MIT Sloan School of Management Thesis Supervisor: Deborah J. Nightingale
Title: Professor of Practice of Aeronautics and Astronautics and Engineering Systems, Department of Aerospace and Aeronautics and Engineering Systems Division
Acknowledgments
There were numerous individuals at F17 who continuously provided their guidance, support, and insights throughout my internship. I would like to give my sincerest appreciation and thanks to my supervisor, the manufacturing planning control team, the industrial engineering group, and the shift managers whom I worked with. They were always available and patient throughout this process and greatly contributed to this internship.
Of course, I would like to thank my advisors, who were instrumental in helping me with structuring and executing this internship. Professor Stephen Graves and Deborah Nightingale provided much valuable feedback for me to establish the foundation for this project and were always available to offer their guidance.
Lastly, my family has always been the most important element and they continued to be throughout this experience. I would like to thank them for their always unwavering and continuing support.
TABLE OF CONTENTS
ABSTRA CT ... 3 ACKNOWLEDGMENTS ... 5 TABLE OF CONTENTS ... 7 TABLE OF FIGURES ... 9 I. INTRODUCTION ... 11I.A. OVERVIEW OF WAFER STARTS CONTROL ... ... 12
I.B. WAFER STARTS CONTROL ATINTEL'S F23 ... 13
II F. F17 ... 15
II.A. TRADITIONAL WAFER STARTS METHODOLOGY... ... 16
III. WAFER STARTS CONTROL MODEL DESIGN ... 19
III.A. LITTLE'S LAW ... .... ... ... ... 19
III.B. MODEL OVERVIEW. ... ... ... ... 21
IIIll.b.i. M odel Param eters... 21
lll.b.ii. M odel Logic ... ... .. ... ... 23
IIIll.b.iii. Excel User Interface... .. ... 25
IIIll.c. ADDITIONAL CONSIDERATIONS ... ... ... ... ... 25
IV. MODEL IMPLEMENTATION ... 27
IV.A. PHASE I BACKGROUND... ... 27
IV.B. PHASE I DATA ANALYSIS ... ... 28
IV.c. PHASE II BACKGROUND ... ... 32
IV.D. PHASE II DATA ANALYSIS ... ... 34
IV.E. PHASE III BACKGROUND... ... 38
IV.F. PHASE III DATA ANALYSIS ... ... ... ... 40
V. CHALLENGES ... 45
V.A. CHALLENGES: THEORETICAL ... ... ... ... 45
V.B. CHALLENGES: IMPLEMENTATION ... ... ... ... 46
VI. NEXT STEPS ... 49
VII. LESSONS LEARNED... 51
Table of Figures
Figure 1: Wafer Starts Control Model Logic, V.1 ... ... 24
Figure 2: Phase I, Days 1 -X Cycle Time Performance... ... 29
Figure 3: Phase I, Days W -Z Cycle Time Performance ... 29
Figure 4: Phase I, Fab Cycle Time Performance ... ... 30
Figure 5: Phase I Under-starts and Over-starts ... ... 31
Figure 6: Phase II, Days 1 -X Cycle Time Performance ... 35
Figure 7: Phase II, Days I -U Cycle Time Performance ... 35
Figure 8: Phase II, Days W -Z Cycle Time Performance ... . 36
Figure 9: Phase II, Fab Cycle Time Performance... ... 36
Figure 10: Wafer Starts Control Model Logic, V.2 ... ... 39
Figure 11: Phase III, Days 1 -X Cycle Time Performance ... 40
Figure 12: Phase III, Days 1 -U Cycle Time Performance ... 41
Figure 13: Phase III, Days W -Z Cycle Time Performance... ... 41
I. Introduction
Cycle time performance is a critical metric that is monitored throughout Intel's
semiconductor fabrication network. In general terms, cycle time is defined as the total elapsed time to move a unit of work from the beginning to end of the physical process . In the context of this project and within Intel, it is defined as the time required to process raw silicon to produce wafers of microprocessors. Shorter cycle times and lower cycle time variability lead to lower work-in-process (WIP), lower costs, and steadier stream of output. Manufacturing staff continuously assesses the condition of fab operations based upon this metric and employs a variety of initiatives to achieve best-in-class cycle times. These efforts can include lean implementation, high precision maintenance of tools, application of production control software systems, etc. Another approach to reduce cycle time and cycle time variability is through the implementation of wafer starts control. The wafer starts control methodology varies the amount of wafers, or raw material, introduced into production based upon the current work-in-process (WIP) inventory levels. This methodology incorporates the fundamental concept of Little's Law and various versions of this methodology have been applied in different manufacturing settings, including the semiconductor industry.
This thesis will discuss the application of the wafer starts control methodology at Intel's F17, the results from the pilot implementations, and the next steps going forward.
Chapter 1 provides an overview of the wafer starts control methodology and its application at Intel's F23 by LFM '07 Matthew Ward.
Chapter 2 provides an overview of Intel's F17, its traditional wafer starts methodology and the potential impacts from applying the new wafer starts control methodology. Chapter 3 discusses the design of the wafer starts control model and the underlying logic and parameters of the model.
Chapter 4 presents the three phases of the pilot implementations as well as the analyses of the results from each phase.
Chapter 5 discusses the theoretical and implementation challenges experienced during the project.
Chapter 6 suggests next steps to be taken in continuation of the application of the wafer starts control system.
Chapter 7 discusses the personal lessons learned from this experience.
L.a. Overview of Wafer Starts Control
Both academic papers and real-life applications highlight the impact that wafer starts control can have on cycle time performance. Wein', through simulation models of wafer fabrication, demonstrated that discretionary input control and scheduling have a
significant positive impact on cycle time. This applied not only to the reduction of cycle time itself but to variability as well (as measured by standard deviation). Kim et al.2 also explored the concept of gathering up-to-date WIP information to control the release of new wafers into production. Their computer experiments illustrated improvements of 23.0% and 17.9% in mean waiting time and mean tardiness respectively.
A common concern regarding wafer starts control based upon Little's Law is the concept's validity in a complex, "re-entrant flow shop" environment, where lots may
return multiple times to an operation. However, Leachman et al.3 successfully developed the SLIM (Short Cycle Time and Low Inventory) methodologies and scheduling
applications based upon Little's Law. Under this model, target WIP levels were calculated and compared with actual WIP levels to determine scheduling at various process steps. The application of SLIM led Samsung to a greater than 60% reduction in cycle time and allowed the firm to capture an additional $1 billion in sales.
I.b. Wafer Starts Control at Intel's F23
Intel's F23 is a 200mm wafer fabrication facility located in Colorado Springs. In 2006, as part of the Leaders for Manufacturing program internship, Matthew Ward4 designed and implemented a wafer starts control system at F23 based upon Little's Law. This system monitored inventory on two different levels: fab-wide and around the constraint operation. These real-time WIP levels are then compared to the expected inventory based upon Little's Law, leading to adjustments of wafer starts accordingly. The pilot
implementation was conducted for a period of greater than 25 weeks and led to major improvements in both cycle time and WIP turns2. Results from the implementation of this model showed a cycle time reduction of 61 % and maintenance of WIP turns in excess of 3.0. Additionally, it should be noted that during the implementation period, the factory output actually increased and did not experience any negative effects.
2 In this case, WIP Turns is defined as: (ActivitiesllInventory), where Activities = the total number of
activities performed in the factory for a given period of time, and Inventory = the average factory inventory during that time.
II. F17
Intel's F17 is located in Hudson, Massachusetts, and contains both semiconductor wafer fabrication and research and development facilities. The fab was originally a part of Digital Equipment Corp. and was purchased by Intel in 1998. In the last ten years, the staff at Fl 7 has worked diligently to integrate the Intel culture and methodologies into this facility for a successful manufacturing environment.
F17 represents one of the several 200mm fabs within Intel's production network. As it strives to maintain itself as one of the most competitive 200mm fabs, it has actively adopted the principles of lean manufacturing in an effort to achieve best-in-class cycle times and to reduce production and business processes inefficiencies. As part of these efforts, internal lean implementation staff has worked extensively to conduct training sessions, Kaizen events, etc. to proliferate the understanding and application of lean concepts inside and outside of the fab. Deriving from these efforts is a progressive culture of approaching and testing new concepts at F17. The scientific method of
forming a hypothesis, establishing a prediction, conducting the experiment, and validating hypothesis with factual data is often utilized at Fl7 and forms a shared
foundation around which new concepts could be tested and analyzed. This was observed during LFM '07 Nima Subramanian's 5 internship where she hypothesized how the analysis of the wafer fabrication process in layers would address unbalanced WIP flow issues and conducted Kaizen events to facilitate the structuring of future experiments. This foundation was an essential contributing factor to the management's willingness to experiment with the wafer starts control model and to the common ground in which discussions of the validity of the model could take place.
Another key element to the background of this project is the cycle time performance at F17. In the last year, Fl7 has seen dramatic improvements in its cycle time, decreasing by more than 50%. These results are attributed to several key initiatives, including lean implementation, and focus on variability reduction. While F17 has thus far achieved this level of success, cycle time performance is and will always continue to be a key metric monitored by the fab and by Intel. To maintain this world-class performance, continuous improvements efforts and new concepts are successively experimented with and
implemented throughout the fab. Thus, this motivation forms another critical aspect of the foundation for the wafer starts control model.
II.a. Traditional Wafer Starts Methodology
The wafer starts methodology at F17 traditionally employed the following process. First, the central Intel planning group would translate forecasted demand into output
requirements for each fab throughout Intel's network. These requirements would be in the form of number of die per product and communicated to each individual fab. The fabs would then translate these requirements into the wafers necessary for production, based upon yield trends, and schedule their production as necessary to fulfill these
requirements. The production schedule would first be listed on a weekly basis (i.e., Start 2000 wafers on work week 1), then the manufacturing production control (MPC) team at F17 would decompose this into starts by shift (i.e., Start 100 wafers on shift 1, 200 wafers on shift 2, etc.). The starts per shift throughout the week would then be executed based upon this pre-established schedule. The only times when these shift start figures would be modified is when the fab experiences major manufacturing issues (such as a period of
excessive tool variability), and the manufacturing staff would request a change in the shift starts so that the high levels of work-in-process could be worked down.
This lack of flexibility in the level of starts presented both challenges and missed
opportunities. During periods of high levels of WIP at the front of the production system, raw material introduced into production would simply accumulate cycle time while it queues to be processed. This not only negatively impacts fab cycle time performance and inventory metrics, but also ties up additional financial resources through excessive WIP. Thus, an alternative wafer starts methodology which would monitor the level of current WIP and flexibly adjust the level of starts accordingly would address these challenges. Additionally, during periods where weekly production is expected to increase
significantly, an observed low level of WIP presents an opportunity to input a higher-than-planned level of raw material into the production system. This would allow the fab to better respond to its upcoming production demands. It is these challenges and missed opportunities that prompted the creation and experimentation of the variable wafer starts methodology.
III. Wafer Starts Control Model Design
As one of the core components of this project, the wafer starts control model was created for both technical and structural purposes. Technically, a model that is based upon Little's Law which served the purpose of regulating wafer starts control was not available
at Fl7. Furthermore, the numerous parameters and assumptions underlying the variable wafer starts concept prompted the creation of a new model from bottoms-up. The goal was to establish a functional model which is both technically sound and easily amenable to provide flexibility. Structurally, the model provided objectivity and transparency to the project. The objective outputs of the model supplied specific execution-able actions and a common ground for discussions of the experiment. The transparency of the
structure and assumptions of the model provided greater credibility and promoted a more rapid adoption of the experiment. With these factors in mind, a new wafer starts model was created based upon Little's Law and as a system which would be executed on a daily or shift basis, manually or automatically, to impact the wafer starts process on a regular interval.
III.a. Little's Law
In 1961, Professor John D. C. Little illustrated and formally proved the relationship between queue length, arrival rate, and wait time within a queuing system in the following manner: L = XW, where L is defined as the average length of a queue, X as arrival rate to the queue, and W as average waiting time in the queue6. This relationship is now commonly referred to as Little's Law. Within a manufacturing context, Little's Law can also be translated in an alternative manner, where L is defined as average
work-in-process, X as the throughput rate, and W as the average cycle time. In a fab production environment, throughput is held as a constant, either governed by the bottleneck
constraint or the weekly starts quantity (if this does not exceed the bottleneck constraint). Given this, an increase in the average work-in-process inventory would cause a
proportional increase in the average cycle time. Alternatively, by impacting the level of inventory in production through adjusting the level of wafer starts each day/shift, a direct impact on the cycle time would be observed as well.
In applying Little's Law in this model, we first determine the WIP target level, then establish an upper and lower limit around this level to compare actual inventory to. By establishing an acceptable range of WIP, rather than just one specific point, some flexibility is provided to accommodate the production system variability and to prevent unnecessary over adjustments. Below is an example of how these limits are calculated.
First, an expected level of inventory is calculated based upon Little's Law. Using hypothetical figures of a cycle time of 20 days and throughput of 500 wafers a day, the average WIP is 10,000 wafers.
Next, upper and lower limits are calculated based upon a hypothetical range of 10%, resulting in an acceptable range of inventory between 9,000 and 11,000. If the actual WIP is within this range, then the level of starts conducted would be in accordance with the pre-established plan. If the level of inventory is above 11,000, an under-start would be executed, in which actual starts would equal planned starts less a pre-determined
adjustment amount. Conversely, if the level of inventory is less than 9,000, an over-start could be executed, in which the actual starts equals planned starts plus a pre-determined
amount. Further details of this adjustment process are discussed in the section III.b.i.
Model Parameters.
III.b. Model Overview
The wafer starts model is composed of the following components: - Excel user interface
- Excel macro for data retrieval - Logic based upon Little's Law
On a daily basis, the manufacturing personnel would execute the model to compare the actual inventory versus the expected inventory level for selected segments of the wafer fabrication process. Based upon the pre-established logic, the model would then return a decision to either: A) Lower the quantity of wafer starts from the original plan, B) Maintain the quantity of wafer starts as the original plan, or C) Increase the quantity of wafer starts from the original plan. The manufacturing personnel would then conduct starts according to these decision outputs. Details of this process and the model are described in the following section.
III.b.i. Model Parameters
To set up the wafer starts control model, the following parameters were established: A) Segments of inventory examination: For ease of tracking, production is classified
into days. Hence, the first set of operations which are planned to take 24 hours to complete is labeled as belonging to Day 1, and so forth. Operations within Days
model examines the WIP inventory in two different sections: a) initial days of production: Days 1 -X and b) larger section of inventory from Days W -Z. By examining the initial days of production of Days 1 -X and how the current inventory level varies from the expected inventory level, a decision could be made to either under-start or over-start versus plan and immediately impact the inventory levels within those days of production. The examination of the
inventory from Days W -Z, on the other hand, allowed the model to leverage a more 'leading indicator' on the inventory levels farther into the fabrication process. Thus, if high inventory levels were examined in a later phase, action
could be taken at this point to address this problematic issue.
B) Level of potential daily variation: A level of potential daily variation was set (for example, X%), indicating that on a daily basis, wafer starts could be
approximately X% less than plan, executed as plan, or approximately X% over plan. This value was derived from the constraint that certain equipment utilized near the beginning of production were governed by specific optimal wafer loadings per run; any wafer starts adjustments below this optimal loading would cause an imbalance in production going forward and incremental materials costs. C) Calculator execution frequency: The wafer starts calculator is executed on a daily
basis and its decision output would impact the wafer starts of one of the two daily shifts. While discussions had been conducted on executing the model on a shift basis, potential adjustments of approximately W% per day were deemed as too large of a risk during the pilot. Hence, it was decided that adjustments would be made only once a day.
D) Products of variation: The products eligible for under-starts and over-starts were the high volume products at F17 and selected by the planning department. E) Limit of cumulative under-started wafers: For the duration of the experiment, a
cumulative under-starts limit of approximately Z% of weekly capacity starts level was established. This was incorporated as a risk management tool to provide an opportunity for discussion when this occurs and to ensure that production would not deviate dramatically from the pre-established plan.
F) Over-starts: Over-starts can only be conducted when there is currently a positive cumulative number of wafers under-started.
III.b.ii. Model Logic
The wafer starts control model is based upon the following five inputs: - Actual inventory in Days 1 -X
- Actual inventory in Days W -Z - Expected inventory in Days 1 -X
- Expected inventory in Days W -Z - Cumulative Under-starts for experiment
The logic table below illustrates the five different scenarios that can occur under the wafer starts control model, and is interpreted as follows:
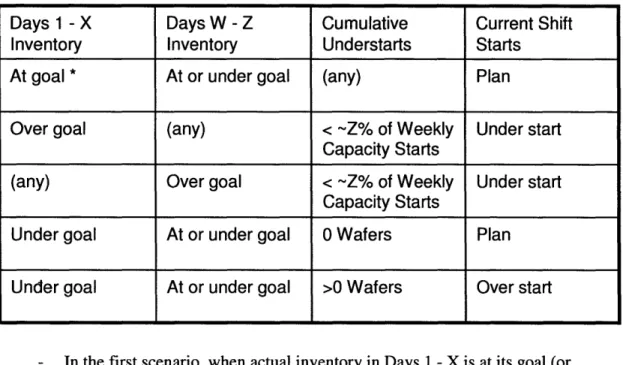
Figure 1: Wafer Starts Control Model Logic, V.1
Days 1 - X Days W - Z Cumulative Current Shift
Inventory Inventory Understarts Starts
At goal * At or under goal (any) Plan
Over goal (any) < ~-Z% of Weekly Under start Capacity Starts
(any) Over goal < -Z% of Weekly Under start
Capacity Starts
Under goal At or under goal 0 Wafers Plan
Under goal At or under goal >0 Wafers Over start
- In the first scenario, when actual inventory in Days 1 -X is at its goal (or expected level) and inventory in Days W -Z is at or under its goal, starts will be conducted as "Plan".
- In the second and third scenarios, when the actual inventory in EITHER Days I -X or Days W -Z is over its goal, under-starts will be conducted, provided that cumulative under-starts are less then approximately Z% of the weekly capacity starts level. (Under the condition that cumulative under-starts are at
approximately Z% of the weekly capacity starts level, no under-starts would be conducted.)
- In the fourth scenario, when the actual inventory in Days 1 -X is under its goal, but when the cumulative wafers in "Cumulative Understarts" is zero, starts will be conducted as Plan.
- In the fifth scenario, when actual inventory in Days 1 -X is under its goal and when Days W -Z inventory is at or under its goal, and with positive cumulative wafers in "Cumulative Understarts", an Over-start would be conducted.
IlI.b.iii. Excel User Interface
The user interface was constructed with the following considerations:
- To be utilized by a manufacturing personnel who may or may not have extensive knowledge of Excel
- To be utilized on a daily basis - Require minimal input
- Sustainability subsequent to the experiment, allowing o Easy modifications
o Clear understanding of calculations and setup within file
The user simply has to input how many wafers are currently in the "Cumulative Understarts", and an output of the day's wafer adjustment type is returned.
III.c. Additional considerations
In the implementation of the model and experiment, there was one additional major consideration in association with the planning department. Some concerns were raised by the department with regard to how the experiment would impact production output and if under-starts could attribute to an inability to meet demands. While we achieved a theoretical understanding that this should not occur, as products that are under-started are those that would have just been placed in production queue, it was difficult to fully
embrace this concept. Thus, several measures were taken to address this perceived risk. First, the products chosen for under-starts were the highest volume products at F17, and therefore any adjustments would constitute smaller percentages of overall volume for
those specific products. Second, a cumulative under-starts limit of approximately Z% of weekly capacity starts was established to provide an opportunity for the planning and manufacturing organizations to assess current status and its ability to meet future product demands when this limit was reached. Lastly, the types of products for adjustment would remain flexible and at the discretion of the planning group to respond to production needs and variability.
IV. Model Implementation
The wafer starts control model was implemented in three different phases. The duration of each phase was chosen so that it was long enough for the model to fully interact with and impact the production system, but not so long as to perpetuate any potential
deficiencies caused by the model. The intermission between each phase then provided the opportunity for data analysis and qualitative assessments, as well as gathering the stakeholders together to discuss improvement opportunities. True to this expectation, both theoretical and structural modifications were made to improve the system between each phase. The following section discusses the implementation of and results from each phase.
IV.a. Phase I Background
The following structure was established for the first phase of the experiment:
- Duration of seven and a half weeks
- Wafer starts control model executed by the manufacturing planning control
(MPC) division
- Email communication to manufacturing staff for any adjustments to the wafer
starts plan
Phase I of the experiment was conducted during a production ramp-up period. Based upon past experiences, manufacturing staff expected that a corresponding increase in both cycle time and cycle time variability would be observed during this period. With this expectation in mind, the hypotheses established for Phase I of the experiment were:
- Current lot-to-lot cycle time variability, as determined by the standard deviation, would remain constant during this period of increased production
- Current level of cycle time would remain constant during this period of increased production
- Faster escalation of fab issues as a result of the sustained lower cycle times
IV.b. Phase I Data Analysis
At the end of Phase I, cycle time performance data for the following sections of operation were analyzed: Days 1 -X, Days W -Z, and fab. It was important to examine the data from the first two sections of operations given that the adjustments were made at the
beginning of the line and these data points may be most indicative of the impact of the wafer starts control model. However, it was of course also necessary to examine the overall impact of the wafer starts control model by assessing the overall cycle time for production.
For each section, the cycle time and cycle time variability (as measured by the standard deviation) were analyzed and charted. In the analyses of this data, outliers defined as the largest 0.1% of the data (greater than three standard deviations) were removed.
Figure 2: Phase I, Days 1 -X Cycle Time Performance3
--- Phase I Experiment
---W01 W02 W03 WO4 WO5 W06 W9OO W10 Wl W12 W13 W14 W15 W16 W17 W18 W19 W20
Figure 3: Phase I, Days W -Z Cycle Time Performance --- Phase I Experiment
W01 W02 W03 W04 W05 W06 W09 W10 Wil W12 W13 W14 W15 W16 W17 W18 W19 W20
3 "Loading" is defined as the level of weekly wafer starts. Weeks labeled on x-axis are not reflective of
Figure 4: Phase I, Fab Cycle Time Performance
W01 W02 W03 W04 W05 W06 W09 W10 W11 W12 W13 W14 W15 W16 W17 W18 W19 W20
The above figures illustrate the following results:
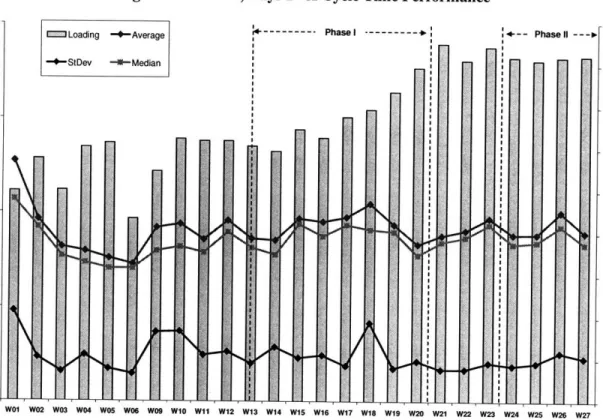
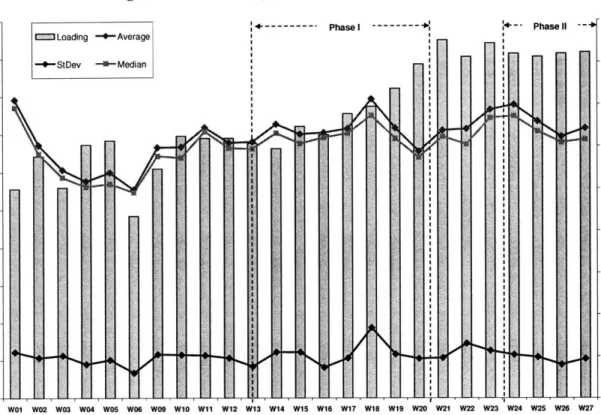
1) Lot-to-lot cycle time variability (as represented by the standard deviation) remained generally consistent throughout the experiment period, even with the increase in weekly starts. (The exception occurred during W18, where excessive tool variability was experienced within the fab.) It is recognized that Days W -Z cycle time variability was slightly higher during this experimental phase.
However, manufacturing and engineering staffs expressed that they had expected an even higher level of variability due to the production ramp-up and these results exceeded their expectations.
2) Cycle time performances for both Days 1 -X and for Days W -Z were also maintained at a consistent level during this experimental phase. (Once again, the performance in W18 can be attributed to the excessive tool variability.) It is
important to note that for both Days 1 -X and Days W -Z, cycle time reached its lowest point at W20, when production actually climbed to its highest level.
Figure 5: Phase I Under-starts and Over-starts
I.- .---. I. - -- -- I.. . -- ---- -I I --- .. .--... --- -.-I --- ---- .n I1 1i 1U 4U 2U Loading - Average 10 --- S10 --- --- 20 20 10 • 1010 I t--- -r---I --#- StDev - Median W13 W14 W15 W16 W17 W18 W19 W20
The chart above (Figure 6) is an alternative version of Figure 4 (showing only W13 -W20) and illustrates the number of times that the wafer starts calculator impacted the starts plan. (Each U denotes an under-start and O an over-start.) During W15 was the first time the model executed an under-start and an over-start and the model was active for the remainder of Phase I. The model executed the most number of under-starts during W18, as the excessive tool variability experienced during that week led to high levels of inventory in Days 1 -X as well as Days W -Z, leading to four under-starts. As
production issues persisted through the early part of the following week and more under-starts were executed, the cumulative limit of approximately Z% of the weekly capacity starts level was reached and the model was no longer allowed to under-start any more
: 1 -I ~··cC~Z~rZ --),-S ce Mda zs, - ---~L-· ;-~ "·~.4\ "sL:
wafers. As previously noted, this limit was established to manage the perceived risks associated with this experiment. We expected that the wafer starts model would have triggered additional under-starts during this period without this limit.
Discussions with the manufacturing and engineering staff led to an agreement for a second phase of implementation. This was attributed to three factors: 1) The wafer starts control model was recognized as having a positive impact on both cycle time and cycle time variability during the production ramp-up period; 2) Suggestions for theoretical and implementational improvements on the model were recommended for assessments; 3) A greater level of confidence in the wafer starts control model was achieved subsequent to the Phase I experience. Thus, with this foundation, Phase II of the experiment was designed collaboratively and executed.
IV.c. Phase II Background
Phase II of the experiment was conducted in a period of four weeks, between W24 to W27. The following modifications were incorporated for the second phase of the
experiment:
- Implementational
o Delay wafer starts calculator execution time: Previously, due to pre-established raw material delivery time constraints, the manufacturing planning control staff would execute the calculator approximately seven
hours prior to the start of the shift. Ideally, however, the calculator could be executed just prior to the shift so that it would be based on the real-time
condition of the fab. To improve upon this set up, negotiations with outside vendors were conducted, allowing the calculator to be executed just three hours prior to the start of the shift to better reflect current fab
status.
o Communication: In the first phase, when under-starts or over-starts were conducted, an email communication would be sent to all of the shift managers as well as selected operational managers. This process was tedious and took additional time for the MPC team to conduct. Thus, a new method of communication was established in which any information regarding wafer starts adjustments would be posted to a shared fab
operation status site, which is monitored continuously by the shift
managers. Additionally, detailed information regarding current inventory levels at each operation versus the expected inventory based upon Little's Law were also provided to give shift managers more visibility into any potential problematic issues.
Theoretical
o Monitored section of inventory adjustment: During Phase I, Days 1 -X inventory and Days W -Z inventory were monitored. Based upon reflections from the Phase I experiment, with consideration for tool impacts, production resources, and reasonable inventory lead time,
modifications were conducted. For the second phase of the experiment, it was agreed that Days I - U inventory would be monitored instead of Days W -Z inventory. This was conducted for two reasons: First, during the
first phase of the experiment, high inventory in Days U -Z led to an under-start decision that the manufacturing management disagreed with. It was felt that while inventory was currently high in Days U -Z, the tool issues which led to this high level of WIP would be resolved quickly and that the under-start might lead to a lack of WIP for processing in the future period. This highlighted the challenge of utilizing leading indicators of fab performance (by assessing WIP levels Z days out), as input release decisions conducted now may not be as beneficial by the time it impacts Days U -Z operations (due to changing production conditions). On the other hand, it was still critical to examine the inventory all the way through Day U since multiple tools in Days K -U have shared resources with operations in latter areas. Thus, by reacting to variations of inventory in Days K -U, positive cycle time impacts would be generated for selected
operations in latter sections.
IV.d. Phase II Data Analysis
Figure 6: Phase II, Days 1 -X Cycle Time Performance
4... Phasel --- 4I
I I
W01 W02 WO3 W04 Ws5 W06 W09 WO1 W11 W12 W13 W14 W15 W16 W17 W18 W19 W20 W21 W22 W23 W24 W25 W26 W27
Figure 7: Phase II, Days 1 -U Cycle Time Performance
)~"'"".Phasel-"---4I
-nHFH
Figure 8: Phase II, Days W -Z Cycle Time Performance
Figure 9: Phase II, Fab Cycle Time Performance
During Phase II of the experiment, only one under-start and one over-start were executed throughout the entire period (during W24). This was likely attributed to two reasons. First, fab operations experienced little variations during this period, and thus no high inventory buildup occurred throughout this period subsequent to W24. The second contributing factor may be that prior to this period, in anticipation of a further production ramp up and greater capacity needs, additional tools became available. However, as production was maintained at a constant level throughout this period, the additional tools effectively provided an extra buffer capacity. Consequently, this also prevented a high inventory buildup at the sections of production which were monitored by the wafer starts calculator.
These findings and results were discussed with the manufacturing management as was conducted at the conclusion of Phase I. There was a consensus that while the wafer starts control model did not have much impact on the system during this period, it did not invalidate the results from Phase I of the experiment. In fact, with fab operations
proceeding with little variation during this period, this is what one would expect from the wafer starts control model: with inventory in Days 1 - X and Days I -U in the expected range based upon Little's Law, leading to no under-starts and over-starts.
However, an interesting observation was made during this period. There were multiple times when low inventory was observed in either Days I -X or Days I - U, but with no cumulative under-starts. Based upon the pre-established parameters, no over-starts would be conducted under this scenario. However, this was now seen by the manufacturing
management as an opportunity to increase production during these scenarios for two reasons. First, during a ramp up period where variations are more likely to be experienced, over-starting during these times can provide a buffer inventory level. Second, the two phases of the experiment thus far had instilled confidence with the manufacturing management in terms of the validity and effectiveness of the system. Thus, this concept would be subsequently incorporated in the Phase III of the experiment,
to be discussed below.
IV.e. Phase III Background
The following changes were adapted for the third phase of the experiment:
-"Opportunity-Starts" Allowed: The concept of "Opportunity-Starts", where the
combination of 1) low inventory in Days 1 -X, 2) low or expected inventory in
Days I - U, and 3) no cumulative under-starts would result in an over-start, was
discussed as an additional option for the wafer starts model. Given the
manufacturing management's growing comfort with the tool and another expected ramp up period, it was agreed that this new logic would be incorporated into the
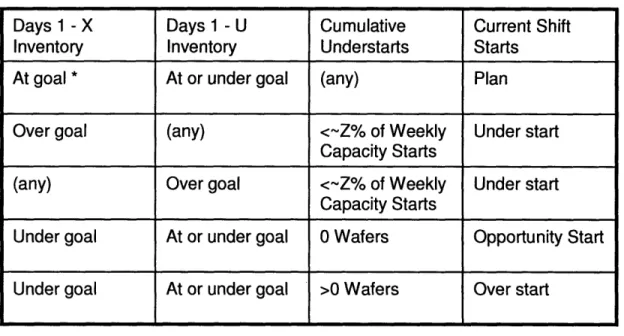
Figure 10: Wafer Starts Control Model Logic, V.2
Days 1 -X Days 1 - U Cumulative Current Shift
Inventory Inventory Understarts Starts
At goal * At or under goal (any) Plan
Over goal (any) <~Z% of Weekly Under start Capacity Starts
(any) Over goal <~Z% of Weekly Under start
Capacity Starts
Under goal At or under goal 0 Wafers Opportunity Start
Under goal At or under goal >0 Wafers Over start
- Products for Under-starts & Over-starts: During the previous two phases of the experiment, specific high-volume products were pre-selected prior to the experiment for under-starts and over-starts. However, in designing for greater flexibility and given the new complexities with opportunity-starts, the new product selection system was established. On a weekly basis, the planning group at Fl 7 would update the wafer starts calculator with the types of products for under-starts and opportunity starts. (Products for over-starts were automatically ones which had previously been under-started.) If multiple products were listed in each category, priorities were also given to which ones should first be under-started or opportunity-under-started.
Two particular points of interest are associated with the third phase of the experiment. First, across W32 - W33 was a scheduled warm-down, where fab operations were intentionally suspended for several shifts. This had an obvious impact on the cycle time
performance during these periods. Second, a ramp-up was expected toward the second half of the Phase III experiment.
IV.f Phase III Data Analysis
Figure 11: Phase III, Days 1 -X Cycle Time Performance
---Figure 12: Phase III, Days 1 -U Cycle Time Performance
19ý 4ý 4p~p* .10 ý04p 4ý 4ý14ý1 41*4ý1 e-,?ý 4114ý1 *Ip 4p, 404p 40,40 Ie4ý 40 lip le 4!ý 404P Ie 4lo O# 4ý 4p~p)o,
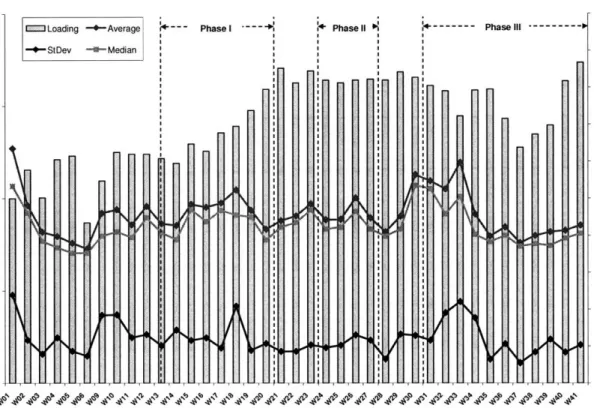
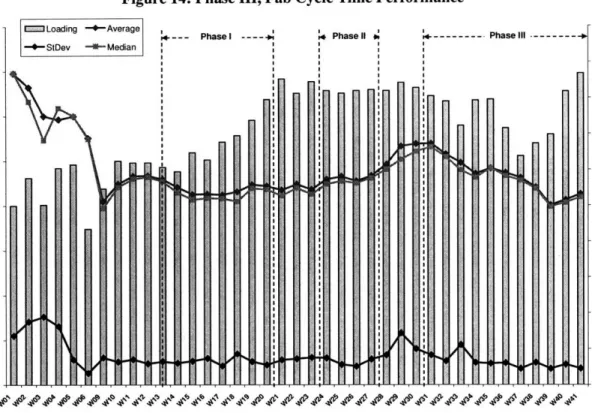
Figure 14: Phase III, Fab Cycle Time Performance
Loading -4-Average Pha Phase III---.
--- Pha Phasell --- Phasell
4--StDev --4 Median I I•'I `Oi sr I : i I ,
,11
,
! ', , I •,', ~mf5o
,~
tm.HI.
H
i
iI
Examining the data above, the following results were observed:
1) Lot-to-lot cycle time variability: The standard deviations of the lot-to-lot cycle times during phase III were mostly consistently lower, especially subsequent to W32-W33, where fab operations were intentionally suspended for several shifts during the scheduled warm-down. Contrasting Phase III results versus the period before the implementation of the wafer starts control model, we observe that: Standard deviation is 11% lower for Days 1 - X cycle time, constant for Days 1
-U, 7% lower for Days W - Z, and 39% lower for overall-fab. Furthermore, these positive results during Phase III all occurred with an increase in weekly starts
versus the previous period.
2) Cycle time performance of phase III was more variable in comparison with the period prior to implementation. Fab cycle time experienced a decrease of 14.5%,
l
... I
while Days 1 -X increased 1% and Days 1 -U & Days W -Z increased 4%. However, it is again important to highlight the context that the level of weekly starts was higher than the period prior to wafer starts control.
The results from Phase III of the experiment were viewed as rather positive from the perspective of the manufacturing management. The impact of the wafer starts control model on cycle time variability was quite clear as the standard deviation decreased while the level of starts increased. This provides a steadier flow of products not only within the fab, but also from the wafer fab to the assembly and test manufacturing facilities, thus minimizing the bullwhip effects experienced throughout supply chains. While cycle time performance within and throughout the Days W - Z did not precisely maintain consistent throughout the ramp up period, it increased only slightly given the sharp rise in weekly starts. Furthermore, the overall fab cycle time did improve during this period, further allowing Fl7 to maintain its world-class cycle time.
At the conclusion of the Phase III of the experiment, F17 planned to adopt the wafer starts control methodology as part of its routine starts process. Chapter VI. Next Steps will further discuss how F17 may conduct this adoption and the resources necessary to do SO.
V. Challenges
In the design and implementation of the wafer starts control model, several challenges were encountered throughout the three phases. These challenges incorporated both theoretical and implementation elements and continue to be critical issues that need to be
considered going forward.
V.a. Challenges: Theoretical
There were two key theoretical challenges associated with the design and structure of the wafer starts control model. The first was to design a model which accommodates all potential inventory and tool health scenarios. The current model monitors inventories in two sections of the production and translates this into a decision of how starts should be varied. However, the distribution of wafers within these monitored sections could vary widely. (I.e., Inventory is heavily shifted towards the beginning of the section or end of the section.) These different scenarios could each lead to a different decision in how wafer starts should be varied. To address this, one might consider segregating the monitored sections into even smaller segments to provide greater granularity. However, in this instance, it may pose a greater challenge to establish an even larger,
comprehensive set of logic statements that would best govern wafer starts. Another aspect of this challenge is the variability in tool health. During the experiment, there were instances where high inventory was caused by unexpected tool downtime and an under-start was executed by the model. However, manufacturing management believed that the tool would soon return to normal operational status, leading to a decrease in the inventory buildup, and that no under-start would be necessary. The model that has been
constructed thus far is unable to specifically accommodate each combination of inventory distribution and tool status. Thus, the challenge remains to build a more robust model to address these different combinations as well as balancing the output of the model with the personal judgment of the manufacturing staff.
The second theoretical challenge is the ability to recognize the bottleneck operation(s) within the production system and adjust wafer starts based upon inventory levels at these operations. At present, there are alternative hypotheses on what the bottleneck operations are in the fab. However, there are not conclusive findings to support these hypotheses. Given the lack of this firm understanding, the wafer starts control model is unable to specifically focus on these areas of operations to adjust wafer starts. (I.e., monitor WIP levels at only bottleneck operations and at the fab-wide level and conducting under-starts
and over-starts based upon these WIP levels. This was the methodology employed by LFM '07 Matthew Ward during his internship project at F23.)
V.b. Challenges: Implementation
Two major implementation challenges were encountered during the experiment: Heavy demand on the MPC staff and integration with existing production control systems. In the early stages of the design of the wafer starts control experiment, we recognized that it would be optimal for the MPC staff to execute the wafer starts control calculator. The MPC staff was already closely involved with the daily starts process and has the most visibility into the amount and type of wafers being processed on a shift basis. However, the execution of the model, including: working with the calculator, recording adjustments that were made, communicating to the manufacturing staff regarding the adjustments, and
modifying the master weekly start plan, presented a highly manual and time-consuming process. This not only created additional work for the staff, but also more opportunities for error due to the highly manual nature of the experiment. While recommendations for automation were made early on and throughout the experiment, constraints on personnel and financial resources precluded a high level of automation from being implemented. Presently, the positive results from the Phase III of the experiment are providing a strong and credible foundation to move towards greater automation of the wafer starts control model.
The second implementation challenge was integrating the wafer starts control model with existing production control systems. The production control system establishes goals for each operation in terms of the amount and type of output, based upon previous shift performances as well as the schedule of planned wafer starts. However, the system pulls the planned wafer starts data for an extended period of time prior to the start of the shift, such that if any subsequent adjustments are made, it is not reflected in the goals
established for operations. Thus, during those instances when under-starts or over-starts are conducted, there is a mismatch between the stated goals and the available wafers for processing. (This mismatch is automatically corrected in the next shift as the production control system recognizes the actual level of inventory in the system.) To address this issue, we recommend that the wafer control starts model be integrated into the production control system so that this mismatch will cease to occur.
VI. Next Steps
Based upon the results of the three phases of experiments, F17 is planning to adopt the wafer starts control model as a permanent tool in its starts process. The most immediate step, which would generate the greatest impact, would be automating the process of executing the wafer starts control model. As discussed in the challenges section, the current process right now involves a high level of manual effort on behalf of the MPC team. This condition not only entails greater time demand from the team, but also allows more opportunities for error during the daily execution process. Manufacturing,
engineering, and planning departments should collaborate together to assess how to best provide resources towards this automation effort, so that wafer starts control becomes a sustainable process going forward.
The automation efforts can proceed in two stages. First, for the daily execution of the wafer starts control model, a higher level of sophistication could be incorporated into the current Excel model. Further built-in macros or VBA programming could streamline the execution process such that no inputs of cumulative under-starts or over-starts are
necessary and outputs of the type and products of adjustments are automatically provided to the MPC team on a daily basis. Communication with manufacturing staff would also be streamlined through the fab operation status site. We estimate that the resources required for this level of automation is moderate and this could be achieved in a relatively short period of time.
For the second stage, the wafer starts control model would either be linked to or built into the current fab-wide production control program. This would prevent the mis-goaling of production as discussed in the challenges section and the confusions caused in specific
operations. However, we recognize that this type of automation would require greater resources, as a higher level of complexity is involved with modifying the fab-wide production control program.
As F17 adopts this wafer starts control model, it is also critical for staffs from
manufacturing, engineering, and planning to continuously review the current parameters of the model and assess if modifications are necessary. As experienced throughout the three experiments, new insights into how this model impacts cycle time and operations are constantly discovered and incorporated into the model. This applies to both the theoretical and implementational aspects of this process. On the theoretical end, staff should consider the possibility of monitoring WIP in sections outside of Days 1 -X and Days 1 -U, such as the model utilized at F23, and base input release decisions on these other sections. The willingness-to-experiment attitude shared by the staff during this experience led to the group collaboration and development of the present model, and provides a strong foundation for further exploration going forward.
Lastly, the successes experienced at both F17 and F23 provide strong examples of how Little's Law and wafer starts control can impact cycle time variability and cycle time. The validity of this concept and the models at Fl7 and F23 would provide a strong basis for knowledge sharing across Intel's fabrication network. Details of the wafer starts control model, on both theoretical and implementation aspects, could provide an additional powerful tool to the other fabs. Furthermore, as implementations of these models are experimented with and proliferated throughout other fabs, F17 itself could benefit from further improvements opportunities through knowledge feedback loops.
VII. Lessons Learned
This internship experience at F17 provided several key personal insights on how to effectively impact operations in a new environment and lead a project through its changing phases. This section will provide a reflection of my experience at F17, from both personal and professional perspectives.
Prior to this internship, I had no previous exposure to the semiconductor industry and associated Intel only with its strong leadership position. This led to the personal assumption that processes within the fab had been long perfected and were
well-established practices. As a result, in the initial discussions of wafer starts control model design, I mostly accepted the status quo of fab process and strived to structure a model purely around the constraints of current operations. However, as I observed actual fab operations and began to engage in conversations with fab technicians, manufacturing staff, industrial engineers, planners, etc., it became apparent that processes were actually dynamic and consistently modified. In fact, the strong lean initiatives that had been implemented at F17 encouraged all employees to recognize improvement opportunities and to execute their ideas through "learning cards".4 This insight led to a fundamental shift in the approach to design and implement the experiment. I felt comfortable, and even in some sense mandated, to challenge certain processes and how they could be modified to incorporate the wafer starts control model. Furthermore, this allowed more candid discussions and debates with managers and group leaders on the design and performance of the model, which was critical for the continuous improvement of this experiment.
4 "Learning cards" is a tool at F17 through which all employees can share their improvement ideas with
It was interesting to observe that F17 employees also at times held the assumption that their current work processes or those employed by another department were
firm-standing and could not be modified. (An example of this was the timing of silicon delivery by outsider contractors, which had been assumed to be a non-negotiable standard, but was in reality flexible.) This meant that it was sometimes necessary to speak with multiple parties to gain a broader and deeper understanding of the issue or to challenge a long-standing practice. While this was daunting and required greater effort, the outcome was often positive for all parties involved.
The second personal insight gained from this experience is the importance of
teaching/mentoring in the implementation of a new concept. Whether I was engaged in a conversation with manufacturing, engineering, planning or finance personnel, it was critical to fully explain the new concept being developed and the involvement or impact for them on a personal level. The staff felt more empowered when they had as much understanding of the concept as possible and were more inclined to contribute and participate. This may be attributed to the fact that they were more cognizant of their potential roles and impact, rather than being surrounded with unfamiliarity and unknown changes.
As parameters and other aspects of the model changed throughout the experiment, BKMs (or Best Known Methods) were constantly updated and communicated to all departments. The continuous discussions on not only how the model and operating procedures have changed, but also why the model has changed created relationships of collaboration. By teaching and mentoring throughout this project, it was possible to keep everyone actively engaged, interested, and willing to provide feedback on model improvements.
Lastly, I learned that the various personal relationships which were established in the beginning outside the context of the internship were in fact pivotal to the success of the experiment. I was able to reach out to many of these individuals for advice and outside perspectives which were then often incorporated into model discussions and decisions. Furthermore, those employees who have had long experiences with F17 (previously DEC) provided great context of the fab culture and recommendations on how to best collaborate and gain support from peer groups.
VIII. References
Wein, L.M. "Scheduling semiconductor wafer fabrication," IEEE Transactions on Semiconductor Manufacturing, Volume 1, Issue 3, Aug 1988 Page(s):115 - 130.
2 Jongsoo Kim, Robert C. Leachman, Byungkyoo Suh. "Dynamic Release Control Policy for the Semiconductor Wafer Fabrication Lines". The Journal of the Operational
Research Society, Vol. 47, No. 12 (Dec., 1996), pp. 1516-1525
3 Leachman, Robert C.; Jeenyoung Kang; Lin, Vincent. "SLIM: Short Cycle Time and Low Inventory in Manufacturing at Samsung Electronics". Interfaces, Jan/Feb2002, Vol.
32 Issue 1, p61-77.
4 Ward, Matthew J. "Fab Cycle Time Improvement through Inventory Control: A Wafers
Starts Approach". Cambridge: MIT-LFM Thesis, 2007.
5 Subramanian, Nima. "Lean Manufacturing in a Semiconductor Environment: Production Leveling". Cambridge: MIT-LFM Thesis, 2007.
6 Little, J. D. C. "A proof of the queuing formula L=XW," Operations Research, vol. 9, pp. 383-387, 1961.