Customer Targeting and Micro-Marketing in a Retail Supply Chain
byJohn P. Sharkey
Bachelor of Science in Industrial Engineering, University of Illinois (1999) Submitted to the Department of Civil and Environmental Engineering and the Sloan School of
Management in Partial Fulfillment of the Requirements for the Degrees of Master of Business Administration
and Master of Science in Civil and Environmental Engineering In Conjunction with the Leaders for Manufacturing Program at the
Massachusetts Institute of Technology June 2004
©2004 Massachusetts Institute of Technology. All rights reserved.
Signature of Author
MIT Sloan School of Management kpartment of Civil and Environmental Engineering May 2004
Certified by_
Donald Rosenfield, Thesis Supervisor Senior Lecturer, MIT Sloan School of Management
Certified by
David Simchi-Levi, Thesis Supervisor Professor of Engineering Systems
Accepted by
Margaret Andrews, Executive Director of Masters Program Sloan School of Management
Accepted by - I
Ideidi Nepf, Chairman of Committee on Graduate Studies Department of Civil and Environmental Engineering
MASSACHUSETS INStfITUTE. OF TECHNOLOGY
JUL
0 1 2004
Customer Targeting and Micro-Marketing in a Retail Supply Chain
By
John P. Sharkey
Submitted to the MIT Sloan School or Management and Department of Civil and Environmental Engineering on May 7th, 2004 in partial fulfillment of the Requirements for the Degrees of
Master of Business Administration and
Master of Science in Civil and Environmental Engineering
Abstract
As most companies in the consumer products space develop operational capabilities to produce and distribute high-quality low-cost products, leading firms in the industry continuously seek new ways to increase profitability and provide value to their retail partners and end consumers. While firms such as Procter & Gamble (P&G) have developed lean and flexible supply chains, this innovation has not had significant impact on the actual sale of product to the customer in individual stores.
Analysis shows that large differences in the level of consumer demand for specific products exist across retail chains. However, current practices typically treat all stores across a chain the same. This thesis presents methods to target store-level marketing levers, including product mix, promotions, pricing, distribution and inventory management levels, based on shopper demographics and past purchasing behavior. Specifically, a framework to divide large retail chains into smaller "virtual chains" and subsequently develop targeted micro-marketing
strategies for these virtual chains is presented.
Research for this thesis was conducted during a six and a half month internship with P&G's Product Supply group at the Cosmetics division in Hunt Valley Maryland. The internship was affiliated with the Massachusetts Institute of Technology's Leaders for Manufacturing Program.
Thesis Supervisor: Donald Rosenfield
Title: Senior Lecturer, MIT Sloan School of Management Thesis Supervisor: David Simchi-Levi
Acknowledgements
I would like to thank Procter & Gamble for sponsoring this work and the many people at P&G
who made this project possible. In particular, I would like to thank Marc Pritchard and Carl Haney whose vision inspired this work. Bill Tarlton's daily guidance was invaluable throughout the project. Lori Ali's insights into cosmetics marketing were extremely helpful and Kelli Waldo and Aamir Mohatarem also provided invaluable assistance.
In addition, I would like to thank the Leaders for Manufacturing program for its support. In particular, I would like to acknowledge my thesis advisors Don Rosenfield and David Simchi-Levi for their insights and helpful comments.
I would like to thank my wife Amanda for her love and support throughout my time on this
internship and at MIT. I've learned as much from her during this time as I have from school and work, and look forward to continuing to learn and grow together. Finally, I would like to thank my family and friends whose support sustained me throughout this project.
Table of Contents
A bstract... 3
A cknow ledgem ents... 5
T able of C ontents ... 7 C hapter 1: Introduction ... 9 1.1 Project Background... 9 1.2 Project M otivation ... 10 1.3 Project Overview ... 10 1.4 Background ... 11
1.4.1 The Procter & Gamble Company ... 11
1.4.2 Procter & Gamble Cosm etics... 11
1.4.3 P&G Cosm etics Supply Chain... 11
1.5 Thesis Organization ... 12
Chapter 2: M icro-M arketing Overview... 13
2.1 The M icro-M arketing Business Case... 13
2.1.1 The Strategic Imperative of Value-Added Services ... 13
2.1.2 Shopper Diversity is Increasing ... 14
2.1.3 Sm art Custom ization is a Competitive Advantage ... 14
2.1.4 Point-of-Sale Data is Becoming W idely Available ... 16
2.2 M icro-M arketing Levers... 16
2.2.1 Product ... 16
2.2.2 Price ... 17
2.2.3 Prom otion... 17
2.2.4 Place... 18
2.3 Supply Chain Capabilities and M icro-M arketing ... 18
2.3.1 Leveraging Supply Chain Capabilities to Create Value ... 18
2.3.2 Supply Chain Evolution: A Comparison of the Retail and Auto Industries... 19
Chapter 3: Identifying Virtual Chains... 25
3.1 Segm entation Strategies... 25
3.1.1 Attribute-Based Clustering ... 25
3.1.2 Statistical Clustering ... 26
3.2 Cluster Analysis Overview ... 26
3.3 Cluster Analysis Example... 27
3.4 M easuring the Distance between Objects ... 29
3.5 Choosing the Number of Clusters... 30
3.6 Cluster Analysis Algorithm: The K-Median Integer Program ... 33
3.7 Validation of Cluster Analysis Results... 35
Chapter 4: M icro-M arketing Strategies ... 39
4.1 Product Strategies ... 39
4.2 Price Strategies... 42
4.3 Prom otion Strategies... 43
Chapter
5:
Procter & G am ble Case Study...
51
5.1 Case Study Introduction... 51
5.2 Preliminary Analysis... 51
5.3 M ass Retailer A Analysis... 54
5.3.1 Three Cluster Scenario... 54
5.3.2 Four Cluster Scenario ... 56
5.3.3 Ten Cluster Overview ... 57
5.3.4 Ten Cluster Performance Details ... 58
5.3.5 Ten Cluster Group Descriptions ... 58
5.4 Cluster Case Studies: Application of M icro-M arketing Strategies... 69
Chapter 6: Influence of Store Attributes on Sales ... 73
6.1 Retail Sales Drivers... 73
6.2 Store Size ... 74
6.3 Store Location... 76
6 .4 E th n icity ... 7 8 C hapter 7: Conclusions... 81
7.1 Hypothesis Revisited ... 81
7.2 Size of the Prize ... 81
7.3 Go-Forward Recommendations... 82
7.3.1 Data Infrastructure ... 82
7.3.2 Product M ix Customization... 82
7.3.3 Under-Performing Stores: In-Store Communications Recommendations... 83
7.3.4 Retail Inventory M anagement Policies... 84
7.4 General Conclusions ... 84
Appendix A - K-Median Cluster Analysis Example ... 85
Chapter 1: Introduction 1.1 Project Background
Procter & Gamble (P&G) has long been considered a leading innovator in the world of consumer packaged goods (CPG) supply chain management. In the mid-nineteen eighties, P&G and Wal-Mart popularized the concept of "channel partnerships", an arrangement in which the consumer products manufacturer and retailer worked together to drive cost out of the supply chain and increase customer service levels to the benefit of each party.1 At about the same time, P&G noticed the bull-whip effect and worked with retail partners to implement vendor managed inventory (VMI) processes and every day low pricing strategies to counter this phenomenon. In
1993, P&G redesigned its entire supply chain, a project credited with an annual savings of $250M.2 In recent years, P&G has pursued a variety of supply chain improvement initiatives
both internally and within the greater retail value chain that are aimed at improving cost, lead time, flexibility, and quality.
A basic premise of each of these innovations is that, by looking at the supply chain for its
products from a holistic viewpoint and focusing on improving the entire system, P&G and its supply chain partners can mutually benefit. This thesis attempts to extend this thinking to the management of individual retail locations.
Historically, consumer products manufacturers such as P&G have continuously striven to increase their shelf space in order to drive additional market share and sales within retail stores -the logic being that more space for P&G and less for competitors will allow more product(s) to be displayed and result in increased sales and market share. While shelf space is clearly an important factor in total sales to sales, obtaining additional space is a significant challenge because this space usually must be taken from other manufacturers who are following the same strategy. Given that seeking additional retail space can be a costly, time consuming, and
Buzzwell, Robert D. and Ortmeyer, Gwen. Channel Partnerships: A New Approach to Streamlining Distribution.
Cambridge, MA: Marketing Science Institute, 1994.
2 Simchi-Levi, David, Philip Kaminsky, and Edith Simchi-Levi. Designing and Managing the Supply Chain. New
potentially fruitless endeavor, consumer products manufacturers seek other methods to boost sales and profits by increasing the productivity of existing retail space.
One technique that has shown promise as a method to.increase the productivity of retail space is micro-marketing. "Micro-marketing refers to the customization of price, promotion, product assortment, and service to the store-level, rather than adopting uniform marketing policies for all stores."3 The basic hypothesis of micro-marketing is that by better aligning marketing and supply chain strategies in stores with the particular market environment of that store, retailers and consumer products manufactures can increase sales - a winning proposition for each. This thesis will discuss the use of such micro-marketing techniques in a retail supply chain and is based on research conducted at the cosmetics division of P&G.
1.2 Project Motivation
For P&G's cosmetics products, historical point-of-sale data shows that products and product lines sell at different rates in different stores throughout the United States. Many factors help explain this demand variation - shopper demographics such as age, ethnicity, and income level; geography, weather, and specific store location; retail channel type; and store size and traffic level are some explanations. Despite (increasingly) varying customer preferences, today the mix of P&G cosmetics sold in each retail chain is relatively homogenous across the chain. Micro-marketing provides a toolkit to customize Micro-marketing by store (or sub-set of stores) to maximize appeal to local shopper preferences in a way that will increase retail asset (space and inventory) productivity and ultimately sales and profits for both consumer products manufacturers and retailers.
1.3 Project Overview
To achieve this objective, historical point-of-sale data, demographic data, and other store level data are analyzed to identify groups of similar stores within the larger chain that can be managed based on their unique shopper attributes. Having identified such a "virtual chain" within the larger retail chain, strategies to customize the product mix and merchandising activity for this
3 Montgomery, Alan L. "Creating Micro-Marketing Pricing Strategies Using Supermarket Scanner Data." Marketing Science, 16 (4), 1997: 315-337.
subset of stores are discussed. Next, the design of a micro-marketing pilot program and issues related to adopting these processes as standard business practices are described. Finally, a case study describing the application of these processes at Procter & Gamble is presented.
1.4 Background
1.4.1 The Procter & Gamble Company
Procter & Gamble is a $43B manufacturer and marketer of consumer and household products. The company divides its operations into five business units including Baby and Family Care, Beauty and Feminine Care, Fabric and Home Care, Snacks and Beverages, and Health Care. In 2002, P&G conducted business in 160 countries and an estimated five billion customers used
P&G products. Currently, the company's product portfolio includes thirteen brand which each
boast over a billion dollars in sales per year, including such well-known brands as Bounty®, Charmin®, Crest®, Folgers®, Olay®, Pampers®, Pringles®, and Tide®.4
1.4.2 Procter & Gamble Cosmetics
P&G's Cosmetics Division develops, manufacturers, and markets products under the Cover Girl and Max Factor brand names. Cover Girl is primarily a North American brand that includes a full line of beauty products for "women of all ages who want a clean, fresh and natural beauty look but don't want to spend a lot of time and money achieving it."5 Max Factor is a global brand, has a strong association with the film industry, and is aimed at women who "want to look like a star."6 Together, these brands comprise over a billion dollars in annual sales and maintain a US market share of over 20%. In the US, Procter & Gamble cosmetics products are sold in three primary retail channels including mass retailers such as Wal-Mart and Target, drug stores such as Walgreen's and CVS, and grocery stores such as H.E.B. and Albertson's.
1.4.3 P&G Cosmetics Supply Chain
Procter & Gamble manufactures the majority of products sold in a single manufacturing facility in Maryland. The remainder of products, typically accessories that are not considered core 4 Procter & Gamble Corporate Website. P&G. 30 Oct. 2003 <http://www.pg.com>.
5 Ibid 6
products, are outsourced to firms who specialize in whatever manufacturing technology might be required. Products are then distributed from single distribution center located in close proximity to the Maryland manufacturing. As previously alluded to, significant efforts have been made to develop more lean manufacturing and distribution operations within P&G's cosmetics business. Point-of-use deliveries of raw materials, change-over time reductions, preventive maintenance, quality initiatives, and increased investments in training human resources have reduced minimum batch sizes and consequently more than halved the manufacturing cycle time required to produce the full breadth of the cosmetics product lines. Whereas P&G previously shipped full cases of cosmetics products to retailer's distribution centers, advanced logistics systems today allow P&G to ship as a few as two units. of a given product (often several weeks or more worth of store-level demand) in mixed cases destined for particular stores - enabling retailers to cross-dock P&G cosmetics and remove significant inventories from the system. These investments have paid off for P&G and their retail partners by drastically reduced the time and cost required to service customer demand. From a micro-marketing perspective, these systems provide the capabilities to cost effectively service the unique demand seen by individual stores.
1.5 Thesis Organization
The rest of this thesis aims to provide an introduction to micro-marketing in the retail field and a discussion of the methods and strategies that can be employed. To begin, the strategic implications and business case for micro-marketing will be discussed to help explain the motivation for CPG firms to pursue such strategies. Next, a general overview of how firms can micro-market is provided and the importance of supply chain capabilities required to support such programs is discussed. Analysis methods used to analyze and understand shopper demand and marketing strategies that can be used to better serve that demand are then presented. Finally, case studies on the application of these methods at Procter & Gamble and lessons learned from these experiences are discussed.
Chapter 2: Micro-Marketing Overview 2.1 The Micro-Marketing Business Case
There are several motivations for a retailer or consumer products manufacturer to micro-market. With the emergence of mass retailers such as Wal-Mart, the balance of power has shifted in the retail supply chain, therefore CPG firms must increasingly seek new ways to add value and defend their share of the retail pie. While the economies of scale and cost advantages of large firms such as P&G are an important advantage; CPG firms must also concentrate on meeting the needs of customers. Demographic data shows that the retail customer base is become increasingly diverse - leaving a fashion driven arena such as cosmetics open to competition from niche players that meet the needs of smaller market segments. P&G must sufficiently service these niches to fend off advances from these competitors and erosion of its market share. Finally, from a bottom line perspective, research on profitability shows that firms able to customize effectively are more profitable than those who do not.
2.1.1 The Strategic Imperative of Value-Added Services
Viewed from a broader strategic perspective, the development of micro-marketing capabilities is an opportunity for CPG companies to provide value and services that will be difficult for large retailers and their private label brands to replicate. A recent estimate by Private Label magazine estimates that 40% of sales at Wal-Mart are private label products - a percentage that has been increasing steadily over the past decade as the quality of private label products has improved.7 The growth of private label sales leads to the conclusion that the value of a brand name - the bread and butter for CPG firms such as P&G - is decreasing over time.
In order to maintain a strong strategic position in the retail value chain, CPG firms must continue to develop value-added services, such as vendor-managed inventory and quick-response programs, that benefit both the CPG firms and their retail partners. Micro-marketing provides a
unique opportunity for CPG firms to leverage their intimate knowledge of product markets to
both enhance the value of their brands and help develop and deliver products that will increase profits for both the firm's and their supply chain partners.
2.1.2 Shopper Diversity is Increasing
While a firm such as Procter & Gamble could historically produce cosmetics products targeting a Caucasian customer base and reach a larger percentage of the US population, census data and forecasts show that ethnically diverse customers are the fastest growing segment of the population - both as a percentage of the population and in terms of spending power. As shown in Figure 1, the US Hispanic population in particular is growing rapidly. As a whole, ethnic buying power increased 74% between 1990 and 1999 and a recent study of the ethnic skin care market predicts that the rate of ethnic spending on beauty care products will outpace inflation by 3% annually over the next 50 years. 8 If these trends play out as expected, cosmetics manufacturers
would be foolish to ignore the unique requirements of these customers.
1999 2050
Hispanic 11% 25%
African-American 12% 14%
Asian/Pacific Islander 4% 8%
Figure 1 - Ethnic Groups as a Percentage of US Population 2.1.3 Smart Customization is a Competitive Advantage
A recent Booz Allen Hamilton study on "smart customization" evaluated different companies
and their capability to serve fragmented demand. The study was conducted over six months with firms such as Unilever, Campbell Soup, Rohm & Haas, BP Castrol, Sprint, Ericsson, Time Warner, Hearst Magazines, Fleet, and Sun Trust.
Within the group of firms studied, the authors found varying levels of sophistication with respect to the firm's ability to identify attractive market segmentation opportunities and deliver value to
AZ~~ZZ~2
-attractive segments. While they caution against undisciplined customization processes, stating that "few companies are successfully trading off the value of customization with the cost of complexity", the authors found that firms able to customize "smartly" achieve better results. The most successful firms were able to both identify opportunities for customization and align fulfillment processes to seve these segments.
The study's findings with regard to how companies were divided amongst the categories of "Smart Customizers", "Average Customizers", and "Simple Customizers" and the relative performance of each of these groups are described in Figure 2.9
Customer Insights and Value Creation
301 4onpais
eo' Morol lihwit hv
profit mar bw
Aor sme Customizers ( B0z Ae ofcompanis)
*More Lkpty to harve
9 greelth and prof"t
0 j margins Wow'
a rinusry prng2s
I
Figure 2 - Smart Customizers vs. Simple Customizers'0
(Source: Booz Allen Hamilton)
9
Oliver, Keith, Leslie H. Moeller, and Bill Lakenan. "Smart Customnization: Profitable Growth Through Tailored Business Streams." Strategy+Business Magazine Spring 2004
2.1.4 Point-of-Sale Data is Becoming Widely Available
In terms of the information technology and data infrastructure required to implement a micro-marketing program, the widespread use of customer loyalty cards in the grocery chain has provided a significant amount of data that can be used to identify customer purchasing habits and design programs to better serve customer needs. Point of sale data for most retail chains is also available either from the retailers themselves or through information gathering and reporting firms such as IRI and AC Nielson. Indeed, studies of the retail channel show that most retailers have or are developing micro-marketing databases to track purchase, behavioral, and demographic data on customers." The insight this data provides can be a key competitive advantage for firms who know how to analyze and use the information.
2.2 Micro-Marketing Levers
There are many marketing tools available to reach the increasingly diverse and segmented customer base. In this paper, the marketing framework called the 4 P's will be used to describe some of the strategies available. Product, Price, Promotion, and Place, the P's that provide the 4 P's framework with its name, are described by Philip Kotler as "the set of marketing tools that the firm uses to pursue its marketing objectives in the target market."'2 In some cases, the target
market Kotler refers to may include an entire sales channel. In the context of micro-marketing, however, the target market is typically a sub-set of stores or even individual retail locations. To provide familiarity with this framework, an overview of the 4 P's will be provided in this section.
A more in-depth discussed of the potential strategies a micro-marketer might employ will be
provided in Chapter 4. 2.2.1 Product
The product variable of the marketing mix includes all aspects of the good or service being purchased by the end consumer. Product mix, variety, quality, design, features, brand, functionality, styling, packaging, sizes, services, and warranties all are part of the "Product"
"1 Lewis, Len. "Micro-Marketing." Progressive Grocer. Nov 1996. Vol. 75, Iss. 11; pg. 18
12 Kotler, Philip. Marketing Management: Analysis, Planning, and Control. Upper Saddle River, NJ: Pretence Hall,
marketing variable.' 3 While retail chains ultimately control the end decision of what to stock on
their shelves, consumer products manufacturers control the other aspects. On the most basic level, consumer product manufacturers must decide what to produce and which customers this product will be targeted to. On a more operational level, as channel partnerships become stronger, retailers and manufacturers have become much more collaborative with respect to tactical choices regarding display design, product presentation, and product mix.
2.2.2 Price
The second marketing variable is the retail price of the product being offered.'4 While the selling
price of a given product is typically set by the retailer making the sale, in many cases suggested retail price or wholesale price for a product has significant influence on the final price. The consumer products manufacturer also sets the wholesale prices for their products. Sometimes, as is the case with Procter & Gamble, the CPG manufacturer might provide different levels of service, for example full-case quantity shipments vs. mixed cases (for cross-docking). Historically the use of promotional wholesale prices has been prevalent in the retail industry. Depending on how wholesale prices are set, retailers are incentivized to take different courses of action.
2.2.3 Promotion
The third marketing variable is promotional activity. Promotional activity includes all actions taken to communicate with the target consumers and induce customers to purchase a firm's products.15 While retailers, especially in the drug and grocery channels, often promote products
by advertising sales, in an environment with strong channel partnerships the development of
promotional activities is often a mutual one. Additionally, in many cases the consumer products manufacturer's continued control of their brands and media advertising ensures that they still hold significant power with regard to the promotion of products.
13 Baker, Michael J.(ed.). The IEBM Encyclopedia ofMarketing. London, UK: International Thomson Business
Press, 1999.
14 Kotler, Philip. Marketing Management: Analysis, Planning, and Control. Upper Saddle River, NJ: Pretence Hall, 1997.
2.2.4 Place
Place, the final marketing variable, describes all supply chain activities taken to make a product available in the marketplace. As previously mentioned, channel partnerships have led to better coordination of the manufacturer-retailer relationship, and the improvement of operational capabilities within each organization have increased the ability to deliver and manage small amounts of product at individual retail locations. Inventory management policies at each echelon of the supply chain are also included in the "Place" marketing variable.
2.3 Supply Chain Capabilities and Micro-Marketing
A high degree of supply chain sophistication is required to control and execute a
micro-marketing program. Consider a micro-micro-marketing system in which each store stocks different products, has different inventory replenishment policies, and runs different promotions. The ability to manage both the complex flow of information and physical products is crucial in such a system.
2.3.1 Leveraging Supply Chain Capabilities to Create Value
In his Harvard Business Review article, "What Is the Right Supply Chain for Your Product?"
Marshall Fisher emphasizes the importance of aligning supply chain capabilities with product and demand characteristics. Fisher states "one should recognize that a supply chain performs two distinct types of functions: a physical function and a market mediation function. A supply chain's physical function invokes the traditional definition of supply chain management and includes converting raw materials into parts, components, and eventually finished goods, and transporting all of them from one point in the supply chain to the next. Less visible but equally important is market mediation, whose purpose is ensuring that the variety of products reaching the marketplace matches what consumers want to buy."16
16 Fisher, Marshall L. "What Supply Chain is Right for Your Product?" Harvard Business Review Mar/Apr97, Vol.
Micro-marketing represents an attempt to leverage supply chain capabilities to perform the market mediation function. The customized nature of a micro-marketing program - especially with respect to the "product" and "place" marketing levers - almost ensures an increase in supply chain complexity. Therefore, companies attempting to pursue such a strategy must also develop supply chains with the "physical function" capabilities to enable such a program. Dell Computer is perhaps the ultimate example of a firm whose physical supply chain and market mediation strategies are well aligned. The web-based sales of Dell's configurable personal computers allows Dell to shape demand by manipulating prices and promotions, and the short lead time of Dell's assembly process allows the firm easily deliver on the configured computers promised to customers.
Fortunately, many of recent cost savings initiatives pursued in the retail supply chains, such as vendor-managed inventory, quick-response replenishment systems, cross-docking, and lean manufacturing, provide the flexibility and speed capabilities firms will need to enable micro-marketing. These capabilities allow firms to develop new products quickly and distribute and manufacture products in low volumes. Beyond cost savings, the trick for consumer products firms will be to use these capabilities to increase revenues. Micro-marketing provides a framework by which retailers and manufacturers can leverage these operational capabilities not just to cut costs, but to drive increased top-line sales volume.
2.3.2 Supply Chain Evolution: A Comparison of the Retail and Auto Industries
The historical development of supply chain capabilities in the automobile industry provides an interesting parallel to the evolution of the retail supply chain. Many of the supply chain and manufacturing philosophies being applied today in retail supply chains - such just-in-time manufacturing - were first popularized in the automotive industry. In this section, the development of operational capabilities in the two industries and the potential future of retail supply chain evolution are discussed.
In the early days of the auto industry, craftsmen built individual cars in low volumes to custom specifications. Henry Ford soon realized that by taking advantage of massive economies of scale, he could produce comparatively high quality cars at an extremely low cost. When Ford unleashed these low-cost, acceptable quality cars on the market, prices fell dramatically and most craft production shops disappeared. While prices were lower, the disappearance of the craft production shop and rise of mass production also led to a marked decrease in the amount of variety available to customers. Henry Ford's famous quote that "you can get it in any color you want, as long as it's black" illustrates this point.
In a retail trend comparable to Fordism, Wal-Mart and other so called "big box" retailers have developed efficient supply chains and used huge economy-of-scale advantages to slash prices and dominate retail markets - driving many of their smaller "mom and pop" competitors, which were analogous in many ways to the craft production shops of the auto industry, out of business. "Historically, there has been a trend by retailers to consolidate stores into large national and regional chains. This move towards consolidation has been driven by the economies of scale associated with these larger operations." remarks Professor Alan Montgomery of the Carnegie Mellon Graduate School of Industrial Administration. However, similar to auto companies embracing Ford's version of mass production, Montgomery also notes that as they came to dominate the market "some of these large chains have lost the adaptability of independent neighbor hood stores." 17
As automobile buyers became used to the low-cost cars provided by Ford's mass production system, General Motors was eventually able to out compete Ford by combining Ford's massive production efficiencies with effective market segmentation strategies. The lineup of GM brands -Chevrolet, Pontiac, Oldsmobile, Buick, and Cadillac - was clearly based upon socioeconomic lines and allowed GM to capture market share in each segment. To maintain economies of scale,
GM combined many functions involved in the design and delivery of these different product lines.1 8
17 Montgomery, Alan L. "Creating Micro-Marketing Pricing Strategies Using Supermarket Scanner Data."
Marketing Science, 16 (4), 1997: 315-337.
18 Oliver, Keith, Leslie H. Moeller, and Bill Lakenan. "Smart Customization: Profitable Growth Through Tailored Business Streams." Strategy+Business Magazine Spring 2004
While GM's practiced a successful customer segmentation strategy, the firm's manufacturing strategy essentially retained the tenants of mass production. After the advent of Fordism and prior to the development and acceptance of Japanese manufacturing techniques, most American firms accepted the idea that trade-offs were an inherent part of production decisions - a choice had to be made between attributes such as quality, cost, variety and lead-time. However, as Japanese approaches such as Total Quality Management (TQM) and lean manufacturing were developed and popularized, firms began to realize that by looking at their problems differently, they could reduce or eliminate trade-offs.
These new strategies have allowed these auto companies to effectively meet the needs of smaller customer segments with increasingly customized products. To achieve these goals, a variety of techniques have been employed. From a design perspective, strategies such as postponement, the use of modular components, and design for manufacturability considered the production and inventory costs of a design up front and made efforts to eliminate this cost and increase manufacturing flexibility. In the realm of production, firms began to focus on identifying and removing constraints, as opposed to merely optimizing around them. By reducing set up costs and changeover times and reducing variability and uncertainty in production and logistics, firms were able to significantly reduce both inventories and lead times and be more flexible in meeting market demands. The end result, as depicted in Figure 3 is that auto firms using lean manufacturing techniques can cost effectively produce a wider range of products at lower volumes.
Mass Production (Ford), 1914 0 L_ Lean Production, 1970s E 0 Craft Production, 1900 Number of Products on Sale
Figure 3 - The Progression of Product Variety and Production Volume in the Auto Industry19
Recent studies have found that, "Increasingly, as the retail environment is dominated by the largest and best managed firms, these competitors are reaching a high level of competitive parity."2 0 Just as the American automobile industry came to be dominated by giants such as GM,
Ford, and Chrysler, so has the American retail industry transitioned from an era of locally-owned stores to an era Of domination by giants such as Wal-Mart and Target. Many of the Japanese manufacturing, quality, and product development techniques developed in the automotive industry have successfully been used to reduce costs in the retail industry. But as depicted in Figure 4, the question remains open as to what non-dollar benefits these improvements will provide to consumers.
'9 Adapted from Womack, James P., Daniel T. Jones, and Daniel Roos, The Machine that Changed the World, New York: Harper Perennial, 1991. pg. 126.
Mass Retailing (Wal-Mart), 1980s Micro-Marketing, ??? 0 0 a) a) E
Mom & Pop Shops, 1940
Number of Products on Sale
Figure 4 - The Progression of Product Variety and Production Volume in the Retail Industry
Keeping in mind the lessons learned in the auto industry, the case can be made that low costs will no longer be enough to win with retail consumers. This means that retailers will increasingly compete based on service, quality, product innovation, and cost. Just as improved capabilities in the auto industry heralded a return towards the product variety that had been available in the days
of craft production, Montgomery notes that "Micro-marketing represents an interest on the part
of managers to combine the advantages of these large operations with the flexibility of independent neighborhood stores."2 1
Montgomery, Alan L. "Creating Micro-Marketing Pricing Strategies Using Supermarket Scanner Data."
Chapter 3: Identifying Virtual Chains
As described previously, micro-marketing attempts to customize marketing efforts at the individual store level. While micro-marketing strives to reach this ideal, in practice taking customization to this level of detail can be both impractical and unnecessary. While the expected benefits of a micro-marketing program are increased sales and profits, in most cases the increased complexity that results from managing stores individually results in the increased costs.
Fortunately, within most large chains, the sheer number of stores means that there will be many subsets of stores for which the demand of the customer base is similar from store to store. One of the first jobs of the micro-marketer therefore becomes identifying these clusters or "virtual chains" of similar stores within the larger chain. Having identified these virtual chains, the marketing manager can then apply the micro-marketing strategies discussed in the following chapter.
3.1 Segmentation Strategies
Two general approaches are available to segment a retail chain into smaller virtual chains. Using the first method, attribute-based clustering, market researchers create groupings of stores based on store characteristics, such as demographic or geographic attributes, that are deemed to predict the sales patterns and preferences of the shopper base. The second method involves using statistical "Cluster Analysis" algorithms that look at historical demand and create groupings of stores that have experienced similar historical product demand profiles.
3.1.1 Attribute-Based Clustering
Attribute-based clustering has been a common practice in the retail industry for many years. Retail chains cluster stores based on shopper demographics, regional characteristics, weather patterns, and many other factors believed to influence consumer product demand. In cases where the attributes provide clear guidance on the types of products that should be offered, attribute based clustering has been used with great success. For example, a recent article in Discount
Merchandiser magazine described an Ames Department Store strategy of stocking beach
products near sea side locations and camping equipment at inland stores near popular camping vacation destinations.22 In this case, high level shopper behavior could easily be predicted based
on the store location.
3.1.2 Statistical Clustering
While effective in circumstances such as the Ames example where the segmentation attributes and drivers of different shopper behaviors are easily identifiable, attribute based clustering methods are, by definition, less effective when the relevant attributes cannot be identified. In these circumstances, statistical clustering methods, which are exploratory in nature, can be an
effective tool to segment the population.
When combined with analysis of the demographics and other factors of the clusters identified, statistical clustering methods provide a powerful exploratory tool to identify the attributes that drive differences in demand. Given the complexity present in the retail business - especially for fashion items such as cosmetics -statistical clustering methods were used in this project.
In most industrial applications of statistical clustering, commercial data mining software packages are used to conduct the analysis. Typically, these packages are designed for industry-specific applications and have interfaces designed to facilitate easy loading and analysis of data. However, even for the user of a commercial cluster analysis package, an understanding of the basic logic used to solve the clustering problem is useful. Therefore the remainder of this chapter explains the general steps and decisions involved in performing a cluster analysis. A relatively simple cluster analysis model that can be used for clustering stores in a retail chain based on historical sales is presented.
3.2 Cluster Analysis Overview
Cluster analysis refers to a broad set of mathematical techniques used to accomplish what in marketing is typically referred to as segmentation. Clustering data is an inexact science; however
22 "Different strokes for different folks." Discount Merchandiser. Bristol: Mar 1999. Vol. 39, Iss. 3; pg. 28
the mathematical approach of most algorithms is to minimize the variance within each cluster while maximizing the variance across groups to partition a set of data into distinct and relatively homogenous groups. Cluster analysis is not a specific mathematical procedure, but rather a range of different approaches ranging from statistically based heuristics to mathematical optimization techniques that all attempt to meet this objective. While the exploratory nature of clustering results in the process being relatively iterative, the basic steps in cluster analysis are:
1. Identifying and measuring the difference between objects to be clustered 2. Choosing the number of clusters
3. Choosing and applying a cluster analysis algorithm
4. Validating the cluster analysis results
After a brief conceptual example of how cluster analysis might be applied in the retail industry, the remainder of this chapter will be spent discussing each of these steps.
3.3 Cluster Analysis Example
As described previously, cluster analysis uses historical information to identify groups within a set of data. In a retail micro-marketing context, this typically involves using historical demand data to identify virtual chains of stores in a larger chain that have experience similar demand profiles. In the example presented here eight stores are divided into three different clusters based on the percent of sales for five different products. Without yet discussing the details of the cluster analysis algorithm, it is useful to understand the inputs and outputs of the analysis. A summary of the input data is presented in Figure 5.
23 Everitt, Brian S., Sabine Landau, and Morvin Leese. Cluster Analysis. New York: Oxford University Press Inc.,
Store Item I Item 2 Item 3 Item 4 Item 5 1 15% 2% 8% 8% 20% 2 8% 10% 15% 9% 15% 3 15% 3% 7% 10% 21% 4 2% 5% 6% 23% 10% 5 7% 12% 16% 9% 12% 6 16% 3% 8% 9% 19% 7 10% 2% 9% 8% 20% 8 2% 6% 5% 24% 14% Avg 9.38% 5.38% 9.25% 12.50% 16.38%
Figure 5 - Percent of Sales by Item by Store
The cluster algorithm will identify three groups of stores that have the most similar demand profile. As shown in Figure 6, in this example the clusters are A = {1, 3, 6, 7}, B = {2, 5}, and C
= 4, 8}.
Store Item 1 Item 2 Item 3 Item 4 Item 5 Group
1 15% 2% 8% 8% 20% A 2 8% 10% 15% 9% 15% B 3 15% 3% 7% 10% 21% A 4 2% 5% 6% 23% 10% C 5 7%, 12% 16%, 9%: 12%, B 6 16% 3% 8% 9% 19% A 7 10% 2% 9% 8% 20% A 8 2% 6% 5% 24% 14% C Avg 9.38% 5.38% 9.25% 12.50% 16.38% Avg
Figure 6 - Store to Cluster Assignments
In most cases, business decisions (which products to stock, how many facing to give each product, how much safety stock to hold, etc.) will be based on the average sales numbers for the entire chain. However, looking Figure 5, it is clear that there is a great amount of store to store variation that is not captured when average numbers are used. Figure 7, which shows the average demand, profile by cluster, further illustrates this point. For example, Item 1, which represents 9.38% of sales for the overall chain, represents from 2 to 14% of cluster sales when the chain is
Item I Item 2 Item 3 Item 4. Item 5.
GroupA Avg 14% 3% 8% 9% 20%
Group B Avg 8% 11% 16% 9% 14%
Group C Avg 2% 6% 5% 24% 14%
Overall Avg 9.38% 5.38% 9.25% 12.50% 16.38% Figure 7 - Cluster Averages by Item
Looking only at inventory management, the benefits of managing at more detailed level become apparent. If inventory levels are managed on a cluster basis, items with higher sales in a given cluster , such as item 2 in group B, will receive more inventory- thereby reducing lost sales and out of stocks. In other cases, such as item 1 in group C, managing at a cluster level will make the identification and removal of items that are not selling easier to identify.
3.4 Measuring the Distance between Objects
In a generic form, cluster analysis can be thought of as using a measure of "distance" of "difference" (typically denoted as dij) between each pair of objects to create groupings. 24 In the previous example, this distance is based on the differences in the percent of sales between
different stores. In the visual example in Figure 8, data is clustered into three groups based on the Euclidian distance between points.
a
e a e
Figure 8 - Visual Clustering Example
24 Everitt, Brian S., Sabine Landau, and Morvin Leese. Cluster Analysis. New York: Oxford University Press Inc.,
In cases in which multiple descriptive attributes are used to determine dij, the problem becomes how to weight the different attributes. A common approach is to weight each attributes by the inverse of some measure of variability in the attribute across all stores. The assumption in the approach, commonly referred to as "standardization", is that the relative importance of each attribute from a clustering standpoint is inversely proportional to the variability of that variable. However, while common, it can also be demonstrated that in some cases this method actually results in poorer results than using simply the un-scaled data. Numerous other methods of weighting for multi-attribute cluster analysis have been proposed in the literature; however the
choice of weights appears to be as much art as science at this point.25 3.5 Choosing the Number of Clusters
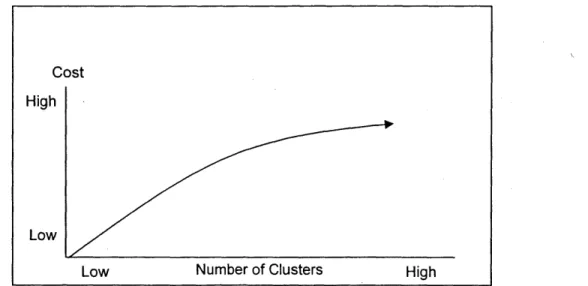
Having determined a distance matrix dij, the next step in a cluster analysis is to choose k, the number of clusters that will be created. The approach to this is often relatively informal. Typically, the clustering model will be solved for several values of k. The value of the objective function in then plotted versus k and "large" changes in the objective are taken as a suggestion that a particular number of groups are present in the data. In Figure 9, the "elbow" in the curve may represent a reasonable number of clusters. Everitt et al. are quick to note, however, that "this approach may be very subjective, with 'large' being often a function of the user's prior experiences."26
In most cases there is a trade-off associated with managing a larger number of clusters. In some cases, this trade-off can be quantified and evaluated analytically. Using the example of a retail chain, as more clusters are formed and each cluster becomes smaller and smaller, it would be expected that an increased sensitivity to local tastes would increase store sales. However, as depicted in Figure 9, it is expected that the most benefit will be derived with the first few clusters developed, and returns will be decreasing as the number of clusters k approaches the number of stores in the chain.
2 Ibid
Figure 9 - Expected Micro-Marketing Benefits as a Function of the # of Clusters
Likewise, as the number of clusters increases, it would also be expected that the additional complexity added to the system will increase costs due to additional management required for each cluster of stores. However, when compared with the benefits, costs will also continue to increase, but in a more linear fashion with respect to the number of clusters. Figure 10 illustrates the expected relationship between costs and the number of clusters. The reason for the higher costs as the number of cluster increases is that customizing merchandising activities, planograms, and displays by cluster requires additional labor.
Figure 10 - Expected Micro-Marketing Costs as a Function of the # of Clusters
Benefit High
Low
Low Number of Clusters High
Cost
High
Low
Given this relationship between costs, benefits, and the number of clusters, the optimal number of clusters can be calculated as depicted as in Figure 11. In essence, what this chart is saying is that looking at the extremes, while one marketing approach for all stores most likely leaves potential profit on the table, if a retailer was to manage each store completely individually the loss of economies of scale would remove any potential sales gains.
Optimal # of
NPV Clusters
High
Low Number of Clusters High
Figure 11 - Cost / Benefit Optimization as a Function of the # of Clusters
While analytically appealing, in the context of micro-marketing applications determining the optimal number of clusters may be both unrealistic and undesirable. Considering the feasibility of determining the optimal number of clusters, it.is possible but extremely difficult to predict the profits and costs that will result based on micro-marketing to a given number of clusters k. But even if it is possible to determine the cost and benefit curves as a function of the number of clusters, there is a second and more meaningful reason not to spend the effort required to identify the optimal number of clusters. The reason for this is that while cost/benefit analysis typically assumes the costs and benefits will be applied to all stores in a chain, in a micro-marketing campaign there is no requirement that all stores or clusters must be customized.
For example, if a retail chain is divided into ten clusters of stores, the micro-marketer may identify three clusters where it is believed that a significant micro-marketing opportunity is present, make changes in stores in those clusters, and make no changes in the other seven clusters. In order to strictly evaluate the optimal number of clusters that a micro-marketer should
create all possible scenarios would have to be evaluated. Given that the retail forecasts that provide the basis for this analysis are typically quite uncertain to begin with, it may not be worthwhile to pursue this analysis. A more practical approach is to set a minimum cluster size that ensures some reasonable economies of scale within each cluster. For example, if the cost of developing different displays is a major cost driver, the minimum batch size in which displays can be ordered might be used as lower bound on the minimum number of stores that can be assigned to a single cluster.
For the reasons described above, the determination of the theoretically optimal number of clusters will not be discussed in this paper. However, readers interested in more information on this topic are encouraged to review the work or Fisher and Rajaram, who present an optimization model for choosing the optimal number of clusters for a slightly different problem involving the retail testing of fashion goods.2 7
Given the lack of sound analytical methods appropriate for identifying the correct number of clusters to be formed in a pure micro-marketing campaign, the marketing manager is left to the use of subjective approaches. The recommended method for is to set a minimum cluster size as previously described and then develop solutions for several values of k. The analyst can then evaluate how the groupings of stores change as the number of groups increases. Validating a cluster model will be discussed further in the next section and in the P&G case studies.
3.6 Cluster Analysis Algorithm: The K-Median Integer Program
While a wide variety of cluster analysis methods are available, a relatively straightforward model that is appropriate for clustering a chain of retail stores will be discussed. This model uses a
specialized integer program developed to solve what is known as the k-median problem.28
2 7
Fisher, Marshall L. and Kumar Rajaram. "Accurate Testing of Fashion Merchandise: Methodology and Application". Marketing Science, Vol. 19, No. 3 266-278, 2000.28
Fisher, Marshall L. and Kumar Rajaram. "Accurate Testing of Fashion Merchandise: Methodology and Application". Marketing Science, Vol. 19, No. 3 266-278, 2000.
* Please note that the cluster analysis performed at Procter & Gamble and presented in Chapter 5 of this thesis was completed using a commercial software package. While the specifics of this software package will not be discussed here, the k-median model is presented to help the reader understand the logic and mathematics used by software packages to perform cluster analysis.
The number of clusters to be created is an input parameter into the k-median clustering model. As described previously, the model is typically solved several times for different values of k (the number of clusters created) to evaluate different clustering options. In the example provided in Appendix A, three clusters were created.
A second input into the clustering model is historical retail point-of-sale (POS) data. For the sake
of clustering stores, it is assumed that sales history is available for products comparable to those that will be sold in the future. If seasonality is of any concern, the POS data should be from period comparable to the time frame in which the micro-marketing activities will be implemented.
The mathematical model of the integer program is as follows:
K-Median Model Parameters
k = the number of clusters n = the number of stores
m = the number of products for which we have sales history I= (1,.. .n) = store index set
P = (1,.. .m) = product index set
UP =the per-unit cost of buying less than demand for product p OP =the per-unit cost of buying more than demand for product p Sip= the observed sales at store i for product p
Sp = E(i=l,n) Sip= the total sales of product p in all stores
wi = 1(p6P) Sip = the total sales of all products in store i
Bip = Sip / E(psP) Sip, isI, pcP = the percent of sales of product p in store i
dij = E(pFP) [Up max (Bip - Bjp, 0) + Op max(Bjp - Bip, 0)] = the total "distance" between
store i and store
j
for all products. This distance is calculated as the difference in the percent of sales between the two stores weighted by the cost of having too little or too much product on hand. This value is calculated for all store pairs prior to running the integer program. Note: the matrix Dij is always symmetric with respect to the diagonal because the cumulative difference in percent of sales is always zero (i.e. if one product sells percentage-wise more in one store, it must follow that another product will sell percentage-wise less.)Variables
yj = 1, if store
j
is a cluster centroid; 0, otherwise xij= 1, if store i is assigned to cluster j; 0, otherwiseInteger Program
Minimize Z(icI) E(jcI) wi*dij*xij (1)
Subject to:
Z(isI) xij= 1,
jI
(2)ZojcI) yj= k (3)
0 <= xij <= yj, i~jEI (4)
xij and yi are binary, i,jI (5)
The first constraint (2) ensures that each store i is assigned to one and only one cluster
j.
The second constraint (3) ensures that k stores are chosen as a cluster centroid - meaning that k clusters are created. The third constraint (4) ensures that store i is only assigned to a cluster with a centroid of storej
if and only if storej
is chosen as a cluster centroid.The objective function seeks to minimize the total variation within the clusters, which is calculated as the percent of sales "distance" between each store i and the cluster centroid
j
weighted by the total sales of all products in store i.The result of the k-median algorithm is k groups of stores each assigned to a one central "median" store. This result is especially useful if pilot program will be run, as the median store is the most representative of the other stores in the group and the preferred location for testing the effectiveness of micro-marketing strategies in the cluster.
3.7 Validation of Cluster Analysis Results
Given that clustering algorithms will mathematically identify clusters even when none are truly present in the underlying data, validating the cluster model is a critical step in the analysis. As is likely clear at this point, while cluster analysis is a powerful tool for identifying patterns in data, there are few clear cut rules on the application of cluster analysis and, as Everitt, Landau, and Leese note, there "is no optimal strategy for either applying clustering or evaluating results."29 The validation techniques presented aim to assure that the clusters identified are truly present in the underlying data and not merely results of algorithms searching for patterns where none exist.
29 Everitt, Brian S., Sabine Landau, and Morvin Leese. Cluster Analysis. New York: Oxford University Press Inc.,
The first validation technique proposed focuses on determining whether the clusters identified in the data are stable using different clustering techniques. This method is called split-sample validation. In a split-sample validation, the sample data (stores) is first divided in two, and a cluster analysis is performed on one sample. Next, the centroids of each cluster (yi = 1 in the k-median model) are determined and the distances between the objects in the second sample and the centroids of each cluster are computed. The cluster centroid to which each object in the second group is closest is then recorded and the second sample of data is then clustered independently of the first. Finally, the two clustering solutions are compared for the second set of data to determine whether the cluster solutions remained fairly stable - meaning that most stores typically are placed in the same cluster regardless of the order.30
The second validation technique proposed evaluates the degree of cohesiveness present within each cluster. For a given cluster solution, this method compute the "tightness" of each cluster. This measure is essentially the average distance between each object in the cluster and the cluster's centroid, using the notation from the k-median model previously discussed, for each cluster
j
= 1 to k, compute the average tightness in cluster J = Z(icI) dij=j*xij=j / Z(isI) xij=i. Comparing the relative tightness of the different clusters gives a measure of the similarity of the objects within each group.In the context of retail store clustering, perhaps the most useful validation feature typically available in commercial software packages is the ability to characterize clusters based on demographic data from the US census. In most cases, demographic data is attributed to each store based on the zip code in which the store resides. A statistical test comparing each cluster's mean demographic attributes with the overall population mean values for factors such as ethnicity, income, family status, and education levels is used to identify which attributes that characterize each cluster. For example, a given cluster may be characterized as heavily Caucasian, urban, with residents who typically have high school education levels, and who earn lower than average income levels. In addition to demographic analysis, commercial clustering packages typically provide visual mappings of the stores in each cluster, which allow the user to easily identify the role that geography plays in the development of store clusters. Cluster
demographic attributes and geographical information, clearly useful in the development of micro-marketing strategies, also provide another method to subjectively evaluate the cohesiveness and validity of clusters.
Chapter 4: Micro-Marketing Strategies
Having identified a virtual chain of stores where a micro-marketing opportunity is available, the next decision to be made is which marketing mix variables can be manipulated to increase sales and profitability at these stores. The decision of which marketing lever to customize is often a subjective one, therefore the objective of this section is to outline some of the choices available. As described previously, the 4 P's of Marketing - Product, Price, Promotion, and Place - will be used as a general framework of the different options.
4.1 Product Strategies
Within the product category, several options are available to the potential micro-marketer. Product mix, variety, design, styling, features, functionality, brand, packaging, and sizes all provide opportunities to customize the product offering to a local market.
Many of the opportunities to customize the Product variable result from improvements non-marketing functional areas of P&G. As manufacturing, distribution, and R&D organizations increase the flexibility and speed with which they can develop, introduce, and manufacture products, the costs and time required to introduce new products goes down. In a fashion driven business such as cosmetics, variety and "product freshness" are important sales drivers, therefore as the capability to handle a wider range of products is developed, product proliferation should be expected. Micro-marketing provides a framework to target this ever widening array of products to the right consumer.
Product Mix
Procter & Gamble currently produces on the order of 700 different cosmetics SKUs. This number will increase as P&G pursues a strategy of more frequent product introductions to maintain product freshness. A given mass market retailer will typically carry approximately 500 of these SKUs per store and a drug retailer may carry approximately 250 SKUs per store. This leads to the question of which SKUs should be carried at each store. Currently product mix decisions are made at a chain level, meaning that all stores in a given retail chain carry the same mix of products. However, the product mix demanded varies from store to store and region to