THE CREEP OF FROZEN SANDS: QUALITATIVE AND QUANTITATIVE MODELS
by JOHN MEI-MING TING
B.Eng., McGill University Montreal, Canada (1975)
M.S., California Institute of Technology Pasadena, California (1976)
Submitted to the Department of Civil Engineering in partial fulfillment of the
requirements for the degree of Doctor of Science
at the
Massachusetts Institute of Technology January 1981
©
Massachusetts Institute of Technology 1981Signature of Author
Dep tent of Civ,'l Engineering J4puary 16, 1981
Certified by
_,v
Charles C. Ladd Thesis Co-supervisor Certified by~
, _
.X
R
re
ce
r
/jThesis
/o
UP4
u
s
Accepted by ARCHIVES C. A I? 'THE CREEP OF FROZEN SANDS:
QUALITATIVE AND QUANTITATIVE MODELS by
John Mei-Ming Ting
Submitted to the Department of Civil Engineering on January 16th, 1981 in partial fulfillment of the
requirements for the degree of Doctor of Science in Civil Engineering
ABSTRACT
This thesis develops better qualitative and quantitative models for the time-dependent mechanical behavior of frozen sands. By drawing upon an extensive literature survey, uncon-fined creep data for frozen sand, and a series of creep tests on glass beads made wetting and nonwetting, various physical mechanisms controlling the strength and deformational behavior of frozen soil are proposed, discussed, evaluated and quantified. These mechanisms are: ice strength, soil strength, and
mechan-ical interaction through structural hindrance and dilatancy effects. Based on these mechanisms, a qualitative model is proposed which can consistently explain the existing obser-vations regarding the influence of relative density, ice sat-uration, temperature, confining stress and time on the strength and creep behavior of frozen sand.
The nature of the linear relationship between the logarithm of the minimum strain rate and the logarithm of the time to this minimum observed from creep tests on ice, soil and frozen soil is examined and explained. This relationship is shown to be due to the existence of an approximately constant strain at the minimum strain rate, and the relative insensitivity of this log-log plot to small deviations from this constant strain value.
Two qualitative models for fitting and predicting the min-imum strain rate and time to this minmin-imum for unconfined creep of frozen sand are developed and evaluated. Each can typically predict the minimum strain rate and time to minimum to within 44 times the actual values using a limited experimental program.
New empirical relationships capable of describing the entire strain rate-time and strain-time data for the unconfined creep *of frozen sands from the primary stage through the tertiary stage
are also developed. The parameters for each model can be eval-uated from a simple technique to yield excellent fits of the data. Reliable predictions of the creep behavior can also be obtained with a relatively small number of tests. The models typically predict the minimum strain rate to izhin +_3 times and the strain at the minimum to within 70% of the actual values.
Thesis Co-Supervisor: Dr. Charles C. Ladd
Professor of Civil Engineering Dr. R. Torrence Martin
ACKNOWLEDGEMENTS
There are many people whom I wish to thank for their part in making this thesis possible. I would like to express my my gratitude to the U.S. Army Cold Regions Research and
Engin-eering Laboratory and the U.S. Army Research Office for their generous funding of this research. Special thanks go to all
the staff of USA CRREL, who provided the technical support and scientific interaction during my stay in Hanover, N.H.
I would especially like to thank (alphabetically): David Carbee, for his help anytime that something needed
needed fixing; David Cole, for his assistance in running strength tests during the initial research project, and for supplying ice samples for our testing program; Gary DeKoff, for his aid in programming and helping me use the CRREL comput-ers; Dr. Malcolm Mellor, for his constructive comments on the initial literature review; William Quinn, for his thoroughly congenial administrative supervision and aid; Frank Sayles, for his constructive review of the initial literature survey, and for his support throughout the project; and Al Tice, for carrying out the NMR unfrozen water content determinations. Also, I thank the undergraduate students who assisted in run-ning many of the creep tests on Manchester Fine Sand for the
initial research project: John Benedict, John Currier, Jim Metherall, John Quackenbush and Mike Woodward.
I also wish to express my sincere gratitude to each of my thesis supervisors, who were initially responsible for my wor-king on this project. Prof. Charles Ladd provided a great deal of guidance and encouragement, especially through his
extreme-ly thorough and constructive comments on all of the drafts of this thesis. Dr. Martin was responsible for helping shape many of my ideas and concepts in this thesis during our many talks. Working with each has sincerely been a rewarding, enjoyable
and treasured experience.
Thanks go especially to Dr. and Mrs. Martin for generously allowing me to stay with them while in Hanover (truly an act above and beyond the call of duty for each of them).
Finally, I wish to thank my parents, who raised me in an environment which allowed me to develop in the fullest (and who saved me months of additional drudgery by allowing me the
use of their computer), and to my wife Christine, for her pat-ience and understanding throughout my experpat-ience at M.I.T.
TABLE OF CONTENTS
TITLE
...
ABSTRACT... ACKNOWLEDGEMENTS ... TABLE OF CONTENTS ... LIST OF FIGURES ... LIST OF TABLES ... LIST OF COMMONLY USED SYMBOLS.... .e.e..1 ... eee...2 ... 3 .· eeee e·... ... 4 ..'. :: : ..eeee...e...·6 ... 13 ... 15 1. INTRODUCTION ... 17
2. REVIEW OF THE NATURE AND MECHANICS OF ICE.. 2.1 Nature of Ice... 2.2 Mechanics of Ice... 2.2.1 Mechanisms of deformation... 2.2.2 Strength of Ice... 2.2.3 Ductile-to-brittle transition... 2.2.4 Deformation of ice... 2.2.5 Quantitative models of ice stren deformation... Rate Process Theory... ... 20 ... 20 ... 29 ... 31 ... 34 ... 44 ... 48 gth , * * a * -Quantitative models of strength.... Quantitative models of deformation. 2.3 Summary of the Nature and Mechanics of Ice. nd ... 63 ... 64 ... 69 ... 71 ... 77
3. REVIEW OF THE NATURE AND MECHANICS OF UNFROZEN SOIL. 3.1 Nature of the Unfrozen Soil System... 3.2 Mechanics of Unfrozen Soil ... 4. REVIEW OF THE NATURE AND MECHANICS OF FR 4.1 Nature of the Frozen Soil System... 4.1.1 Nature of ice nucleation and frozen soil... Frost heaving ... Ice adhesion ... 4.1.2 Structure of the frozen soil 4.2 Mechanics of Frozen Soil... 4.2.1 Strength of frozen soil... Effect of confining stress. Effect of temperature ... Effect of time... 4.2.2 Deformation of frozen soil... Effect of stress level... Effect of temperature... Effect of confining stress. Other factors ... 4.2.3 Qualitative models of strengt mation ... Summary of the mechanics of Qualitative models .OZEN SOIL ...88
...
interaction in .88 ... ... 88 .. ·... ... ·.. system. .. · ·... ... · ·. ... * . . . . * . . . h a nd * . . fro·z ·. e.· · ··.. oeo·. .ooe. .eoe· .e.·o h and illel fr oz · · · · . -d e. en...
90
... 94 ... 97 ... 103 ... 104 ... 104...
111
...
... 115 ... 121 ... 123 ... 125 ... 132 ... 134 efor-...139
soil...140 of behavior ...1434.2.4 Quantitative models of strength and defor-....80
.... 80
mation t.o... 148
4.3 Summary of the Nature and Mechanics of Frozen Soil ... 160
5. QUALITATIVE MODELS FOR THE MECHANICS OF FROZEN SAND. .½ he Linear lg m- lo tm Correlation... echanisms o Strengt and De ormation... 5.2.1 Proposed mechanisms ... 5.2.2 Discussion of the mechanisms of strength and deformation ... . . 164
. .17
...
177
5.2.3 Summary and implications of testing program.194 5.3 Proposed Qualitative Model for Frozen Sand Behavior ...208
5.4 Conclusions . ...214
6. QUALITATIVE MODELS FOR THE CREEP OF FROZEN SAND ...218
6.1 Prediction of the Minimum Strain Rate ... 223
6.2 Prediction of tm ...237
6.3 Proposed Creep Models ...241
6.4 Conclusions ... 6...0...260
7. SUMMARY AND CONCLUSIONS ...266
APPENDICES A.1 Properties of Glass Beads ... A.2 Sample Preparation and Testing for Unconfined Creep o Saturated Frozen Glass Beads .... ... A.3 Results of Creep Tests on Glass Beads... A.4 Results of Unfrozen Water Content Determinations of .272 f .283 .296 MS-M Glass Beads ... 309
A.5 Results of Testing on Frozen Manchester Fine Sand ...314
A.6 Results of Creep Testing on Ice . ... 340
B.1 Details on the Nature Correlation... B.2 B.3 B.4 Details Details Details of m of tm on the of the Linear log
¢m-...
.344
Prediction for Prediction for Proposed Creep Manchester Manchester Models.... REFERENCES... Ice ... Unfrozen Soil Frozen Soil.. .···..e·.ee·O·eeeee·e·· · · e . . . · e· e e e·e e and Particulate Composites s·.·...*....·eee··e··.·. BIOGRAPHICAL NOTE . ... 432 log t m Fine Fine ·· · · e Sand. Sand. · . . . . . .. 355 ...383 ..391 .. .420 ..426 .. 428 .. - _ ^ A...
...
...
...
LIST OF FIGURES
2.1 Phase diagram for Ice... 2.2 Structure of Ice Ih... 2.3 Corte's experiment: a particle floating on a
heav-ing ice surface... 2.4 Deformation mechanism map for polycrystalline ice
of 1 mm grain size... 2.5 Uniaxial compressive strength of ice at -9.5 °C... 2.6 Uniaxial compressive strength of ice as a function
of temperature... 2.7 Typical stress-strain curves for granular ice at
- 9.5 °C ... 2.8 Effect of sand concentration on the strength of a
sand-ice system...
2.9 Triaxial strength of polycrystalline ice... 2.10 Typical creep data for ice... 2.11 Effect of sand concentration on the creep of a
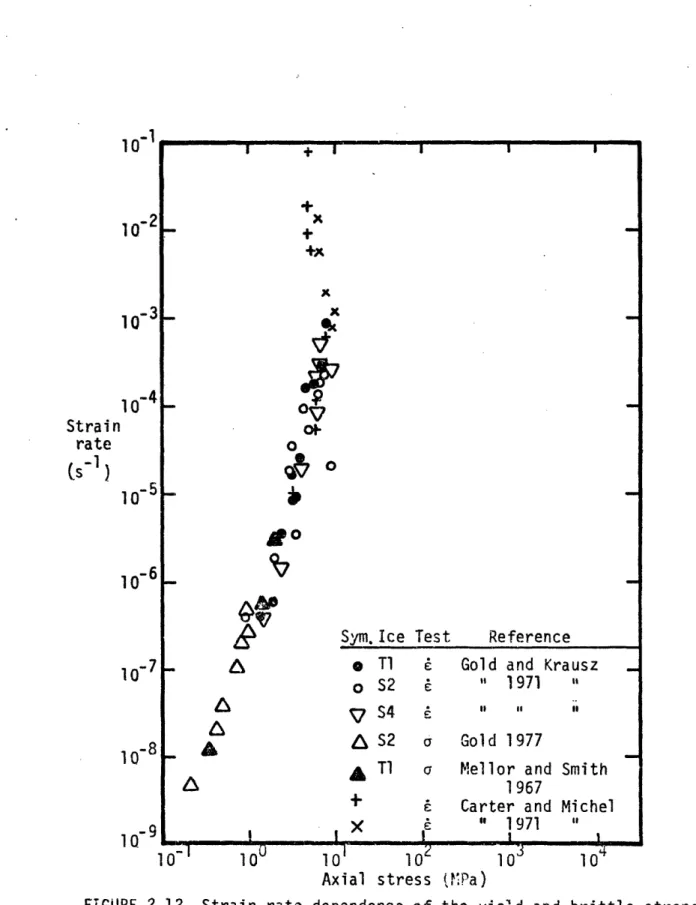
sand-ice system ... .... ... ... 2.12 Strain rate dependence of the yield and brittle
strength and stress dependence of the "secondary" strain rate of ice... 2.13 Linear log £m- log tm correlation for ice... 2.14 Components of the Andrade equation... 3.1 The physico-chemical effective stress equation... 3.2 Components of strength of sand as determined by
Rowe (1962)... 4.1 Two-dimensional schematic of the proposed structure
of the frozen sand system... 4.2 Effect of confining stress on the strength of ice
and frozen soils ... 4.3 Results of strength testing on frozen soils at low
confining stresses... 4.4 Stress-strain curves for frozen Ottawa Sand ...
4.5 Mohr envelopes for Ottawa sand 20-30 and columnar-grained ice at -3.8 °C... 4.6 Effect of temperature on the uniaxial compressive
and tensile strenqths of silt and sand ... 4.7 Effect of confining stress on the temp
endence of strength... 4.8 Effect of strain rate on the uniaxial
strength of frozen soils ... 4.9 Effect of strain rate on the triaxial
frozen soils...
4.10 Linear og m- log tm correlation for chester Fine Sand ... 4.11 Strain rate vs. applied stress ratio f
materials.
4.12 Stress dependence of creep for ice and Fine Sand at various degrees of ice
erature dep-··.. ·. ·.. s·· compressive strength of frozen Man-or various Manchester saturation.. ..21 .22 ..25 ..33 ..35 ..37 ..38 ..40 ..42 ..49 ..57 ..59 ..61 ..74 ·.82 ..85 .101 .105 .108 .109 .110 .112 .114 .116 .118 .120 .122 .124
4.13 Effect of minor fluctuations in applied stress on
the creep of frozen soils ...126 4.14 Effect of temperature on the uniaxial creep of
frozen Manchester Fine Sand ... 127 4.15 Determination of the apparent activation energy E
for frozen partially saturated MFS ... 129 4.16 Variation of E with stress level .... ... 1....30 4.17 Effect of confining stress on the creep of frozen
sand...133
4.18 Effect of relative density on the creep of frozen
MFS ... 136
4.19 Effect of ice saturation on the creep of frozen MFS..137 4.20 Typical creep models ...149 4.21 Variation of failure envelopes with time for Ottawa
Sand ... 155 4.22 Strength and creep data for frozen soils as a
function of strain rate and stress ... ...157 4.23 Energy surface for frozen silt ... 157 5.1 Summary of m - tm correlations for various
materials ...165 5.2 Lines of constant strain based on secondary creep
model ... 167 5.3 Lines of constant strain based on Singh-Mitchell
(1968) creep model ...168 5.4 Minimum creep data for 40% Si 55% Dr MFS with
constant strain contours from Singh-Mitchell
creep model ... 70 5.5 Buckling of a slender column in air and with an
elastic foundation ... 176 5.6 Comparison of frozen and unfrozen soil strength for
Ottawa Sand 100-200 ... 181 5.7 Effect of surface treatment on the creep behavior of
MS-M size glass beads .... ... 196 5.8 Results of creep testing on MS-M (wetting) glass
beads
...
197
5.9 Comparison of creep behavior of frozen saturated MS-XPX size glass beads (wetting and nonwetting)
and fine polycrystalline snow ice ... 198 5.10 Effect of a change in friction angle on the observed
axial strength ... 202 5.11 Tentative mechanism maps for uniaxial compression of
frozen sands .... ... ...209 6.1 Results of creep testing on 40% Si MFS at 0.3 stress
level .. ...220 6.2 Typical uniaxial (unconfined) creep behavior for
frozen sand ... ... ...222 6.3 Comparison of fitted and actual m using the
mod-ified RPT equation for 55% Dr MFS at various
levels of saturation ... ... 226 6.4 Frequency histogram indicating quality of fit using
one modified RPT equation for describing Si, Dr,
~1 and T variation ... ...227
6.5 Use of ultimate strength for fitting constant load creep data for 40% Si and 100% Si MFS ... 229
6.6 Frequency histogram of data fits using ultimate strength ... 230
6.7 Frequency histogram of quality of fit using ultimate strength to account for temperature dependence, data at varying dgrees of ice saturation Si ...232
6.8 Comparison of predicted and actual m using modified RPT and stress ratio methods ...235
6.9 Histograms of fitted tm using log m- log tm correlations ... 238
6.10 Proposed determination of parameters for Assur-Ting model ... ...243
6.11 Comparison of actual and fitted creep curves for 40% Si 55% Dr MFS data at a1 = 4.8 MPa from Assur-Ting model ... ...245
6.12 Comparison of actual and computed strain-time curves for 40% Si 55% Dr MFS at = 4.78 MPa ... 246
6.13 Comparison of Assur-Ting, Singh-Mitchell creep models with actual test data ...247
6.14 Comparison of predicted and actual -m and E Tnusing Assur-Ting model for 40% Si 55% Dr MFS using data from 8 creep tests... 250
6.15 Comparison of log - log t curves from Assur-Ting model predictions and actual data ... 251
6.16 Comparison of strain-time curves from predictions and actual data ... ... 252
6.17 Results of creep testing on saturated 55% Dr MFS at s1 = 10.6 MPa, various temperatures ... 253
6.18 Determination of parameters for modified creep model for saturated frozen MFS ... 255
6.19 Comparison of modified creep model and actual data for saturated Manchester Fine Sand ...256
6.20 Comparison of strain-time curve from modified creep model with actual test for saturated MFS ... 2..57
6.21 Comparison of predicted and actual _ and m using modified creep model for saturateS MFS using 10 tests to predict others .. ...259
A.l.1 Grain sizes of tested materials .. ...276
A.1.2 Results of CIDC tests on MS-M glass beads ...277
A.1.3 Results of CIDC tests on MS-M WP lass beads ...278
A.1.4 Scanning electron micrographs of MS-M glass beads..279
A.1.5 Scanning electron micrographs of MS-M WP (non-wetting) glass beads ... 280
A.1.6 Scanning electron micrographs of MS-XPX glass beads .28...281
A.1.7 Scanning electron micrographs of MS-XPX WP (non-wetting) glass beads .28...282
Schematic of compaction mold... Schematic of evacuation/saturation apparatus Schematic of apparatus for freezing samples. Schematic of creep testing apparatus... Schematic of cold stage apparatus... Typical plots of creep data from one test... Water content profiles of frozen glass bead
samples... ... 290 ... 291 ... 292 ... 293 ... 294 ... 29 5 A.3.1 Results of constant load creep testing on glass beads ... A.3.2 Results of c beads... A.3.3 Results of c glass beads A.3.4 Results of c glass beads A.3.5 Results of c glass beads A.3.6 Results of c: beads... A.3.7 Results of c glass beads A.3.8 Results of c beads... A.3.9 Results of c glass beads reep testing on MS-M (wetting) glass ... 301
reep testing on MS-M WP (nonwetting) ... 302
reep testing on MS-XPX (wetting) ... 303
reep testing on MS-XPX WP (nonwetting) ... 304
reep testing on MS-M (wetting) glass ... 305
reep testing on MS-M WP (nonwetting) ... ... 306
reep testing on MS-XPX (wetting) glass . ... 307
reep testing on MS-XPX WP (nonwetting) ... 308
A.4.1 Unfrozen water contents of MS-M glass beads from pulsed NMR ... 311
A.4.2 Unfrozen water contents of MS-M wetting and MS-M WP nonwetting glass beads from pulsed NMR (warming curves) ... ...312
A.4.3 Unfrozen water content as a function of ice con-tent for MS-M wetting glass beads ...313
A.5.1 Results = 4 A.5.2 Results 1 = 4 A.5.3 Results -18.8 A.5.4 Results at a A.5.5 Results T = -1 A.5.6 Summary densit, of ice A.5.7 Results Dr.... of creep testing on 40% Si 55% Dr .78 MPa, various temperatures... of creep testing on 40% Si 55% Dr .78 MPa, various temperatures... ,of creep testing on 40% Si 55% Dr C, various stresses ... of creep testing on saturated 55% = 10.6 MPa, various temperatures.. of creep testing on saturated 55% 8.4 C, various stresses ... of minimum creep data for 55% rel y Manchester Fine Sand at various
saturation...
MFS at .MFS at MFS at MFs at .Dr MFS Dr MFS Dr MFS ative degrees of creep testing on 40% Si MFS at varying ... ...328 ...329 ...330 . .331 . .332 A.2.1 A.2.2 A.2.3 A.2.4 A.2.5 A.2.6 A.2.7 ... 333 .334in
n
- --A.5.8 Results of creep testing on saturated MFS at
varying Dr ...335 A.5.9 Results of creep testing on 40% Si MFS at varying
Dr ... 336 A.5.10 Results of creep testing on saturated MFS at
varying relative density ...337 A.5.11 Water content profiles of MFS at 55% relative
dencity ... 3...333
A.5.12 Unconfined strength tests on saturated MFS at 55%
relative density ...339 A.5.13 Unconfined strength tests on 40% Si 55% Dr MFS ... 339
A.6.1 Results of creep testing on fine polycrystalline
snow ice ... 343
B.l.1 Summary of m - tm correlations for various
materials ...349 B.1.2 Lines of constant strain based on secondary creep
model ...350
B.1.3 Lines of constant strain based on Singh-Mitchell
(1968) creep model ...351 B.1.4 Minimum creep data for 40% Si 55% Dr MFS with
constant strain contours from Singh-Mitchell
creep model ... 352 B.1.5 Comparison of actual creep data with m
pred-iction with m - tm correlation and
Singh-Mitchell creep model ...353 B.1.6 Use of the Singh-Mitchell creep model for fitting
actual creep data ... ...354 B.2.1 Fit of constant load single stage creep test data
for 40% Si 55% Dr MFS with variable apparent
activation energy E fits ... 366 B.2.2 Fit of constant load single stage creep test data
for 40% Si 55% Dr MFS with constant apparent
activation energy E ... 3....367 B.2.3 Use of exponential function to describe stress
dependence
...
368
B.2.4 Use of power function to describe stress
dep-endence ... ... 369
B.2.5 Quality of fits of data ... 370 B.2.6 Quality of fits of 10% Si 55% Dr data ...371 B.2.7 Frequency histogram indicating quality of fit
using one modified RPT equation for descibing
Si, Dr, o and T variation ... 372 B.2.8 Fit of selected constant load single stage creep
test data for 100% Si 55% Dr MFS with constant
apparent activation energy ... 373 B.2.9 Fit of selected constant load single stage creep
test data for 40% Si 55% Dr MFS with constant
B.2.10 Fit of selected constant load single stage creep test data for 20% Si 55% Dr MFS with constant
apparent activation energy ... 375 B.2.11 Summary of stress dependence of creep for selected
constant load creep tests at varying degrees of
ice saturation Si ... 376 B.2.12 Frequency histogram of quality of predictions using
one modified RPT equation and the results from 25 tests to predict all single stage constant load
creep test data .. ... 377 B.2.13 Use of ultimate strength for fitting constant load
creep data for 40% Si and 100% Si Mfs ... 378 B.2.14 Frequency histogram of data fits using ultimate
strength . ...379 B.2.15 Frequency histogram of quality of fit using ultimate
strength to account for temperature dependence,
data at varying degrees of ice saturation Si ...380 B.2.16 Frequency histogram of quality of fit using ult and
results from 18 tests to predict all MFS data ...381 B.3.1 Histograms of fitted t using log m - log tm
correlation ... 387 B.3.2 Correlation between m and mr ... 388
B.3.3 Histograms of tm fit using m model with m fits....389 B.3.4 Histograms of tm prediction using results from 8
tests to predict others, with log-m - log tm
correlation ... 390
B.4.1 Typical normalized creep curves for 40% Si 55% Dr
MFS
...
405
B.4.2 Proposed determination of parameters for
Assur-Ting model ... ... 406 B.4.3 Comparison of actual and fitted creep curves for
40% Si 55% Dr MFS at ai = 4.8 MPa ... 407 B.4.4 Comparison of actual and computed strain-time
curves for 40% Si 55% Dr FS at a1 = 4.78 MPa ... 408
B.4.5 Comparison of actual, Singh-Mitchell and
Assur-Ting creep curves ... 409 B.4.6 Comparison of predicted and actual m and Cm
using Assur-Ting model for 40% Si 55% Dr MFS
using data from 8 creep tests ...410 B.4.7 Comparison of log - log t curves from Assur-Ting
model predictions and actual data .... ...411 B.4.8 Comparison of strain-time curves from predictions
and actual data ... 412 B.4.9 Determination of parameters for modified creep
model for saturated frozen MFS ...413 B.4.10 Comparison of modified creep model and actual data
for saturated Manchester Fine Sand ... 414 B.4.11 Comparison of strain-time curves from modified
creep model with actual test for saturated MFS .... 415 B.4.12 Correlations between co and (.l/ult) ...416
B.4.13 Correlations between slopes of log - log t
curves for saturated MFS and stress ratio ... 1
B.4.14 Comparison of predicted and actual m and m using modified creep model for saturated MFS
LIST OF TABLES
2.1 Unfrozen water content and estimated film
thick-ness in various soils . ...27 2.2 Possible creep mechanisms in ice ... 68 2.3 Values of n and Q from constant strain rate tests ....70 2.4 Values of n and E from constant stress creep tests...72 5.1 Results of testing on glass beads ...199 6.1 Summary of modified RPT model parameters for MFS ....225 6.2 Summary of C
m
prediction methods ... 236A.l.1 Properties of glass beads ... 274 A.1.2 Summary of CIDC loading triaxial tests on unfrozen
glass beads ...275 A.3.1 Results of creep testing - MS-M series glass
beads...
A.3.2 Results of creep testing - MS-XPX series glass
beads...
A.3.3 Summary of creep testing on glass beads...
..297 ..298 ..299 A.5.1 Results of constant load creep
ated MFS samples, nominal w = A.5.2 Results tially A.5.3 Results tially A.5.4 Results Dr MFS A.5.5 Results testing 25%.... of constant load creep testing saturated MFS samples, nominal of constant load creep testing saturated MFS samples, nominal of constant load creep testing samples... of temperature stage creep test saturated MFS with computed experiment ation energy... on satur-... 318 on par-w = 10% ....319 on par-w = 5, 3%..320 on varying ... 321 .s on .al activ-... 322 A.5.6 Results of temperature stage creep tests on
partially saturated MFS with computed experi-mental activation energy ... A.5.7 Results of temperature stage creep tests on
partially saturated MFS with computed experi-mental activaiton energy... A.5.8 Results of stress stage creep tests on
sat-urated and partially satsat-urated MFS... A.5.9 Summary of observed and computed quantities for
MFS at 55% Dr ...
A.5.10 Summary of unconfined strength testing on MFS at 55% nr... ..323 ..324 ..325 ..326 ..327 A.6.1 Results of creep testing on fine polycrystalline
B.2.1 Parameters for equation B.2.7 for 55% Dr MFS ...364 B.2.2 A parameters for 55% Dr MFS using avg. n = 10,
-(E/R) = 30000...364 B.2.3 Summary of tests used for determining model
param-eters for predictions ... 365
B.4.1 Summary of Assur-Ting model parameters for indivi-dual constant load creep tests for 40% Si MFS ....400 B.4.2 Summary of Assur-Ting model parameters using creep
data from 8 tests only for 40% Si MFS ...401 B.4.3 Summary of modified model parameters for individual
constant load creep tests for 100% Si MFS creep
data ... 402 B.4.4 Summary of modified model parameters for saturated
MFS
...
403
B.4.5 Summary of modified model parameters using creep
LIST OF COMMONLY USED SYMBOLS a unit area
a contact area
A long range attractive force
A fitting constant for various models, including Singh-Mitchell (1968), Assur-Ting, modified RPT, etc. B Skempton's (1954) pore pressure parameter ( Au/Auc) c cohesion intercept
Dr relative density (also D )
e void ratio
E experimental activation energy based on creep testing (kJ/mole)
E elastic modulus
f applied shear force on a flow unit AF free energy of activation (kJ/mole) G specific gravity of mineral 34
h Planck's constant ( 6.624 x10 -2 J-s) k Boltzmann's constant ( 1.38 x10 J/ K)
m slope of log - log t curve ( -n(g )/Dan(t)) m fitting constant in SM, AT, modified AT models
n fitting constant in mod. RPT, stress ratio models describing stress dependence 23
N Avagadro's number (6.02 x10 ) p mean normal stress ( al+ 3/2) q shear stress ( - 3/2)
Q experimenal activation energy based on strength testing r2 coefficient of determination
R long range repulsive force
R Universal Gas constant ( 8.30 J/ K-mole) S number of flow units per unit area
S degree of saturation of pores with water
Si degree of saturation of pores with ice (also Si)
t time
t time of break A
t time to the minimum strain rate (min) tm arbitrary initial tame
T ° temperature ( C or K) u pore pressure (also up) w water content
w unfrozen water content (weight of unfrozen water/weight solids)
a tan- qf /pf )
a stress dependence of creep (ng/a )
B fitting constant in SM, AT, stress ratio models
B stress dependence of creep (E = AF - ca)
fitting constant in AT, mod. RPT, Andrade models y fitting constant
Yd dry density
CA strain at break A
em strain at minimum strain rate Co strain at initial time t
strain rate
tA strain rate at break A «m minimum strain rate
So strain rate at time to
A indicates break in log - log t curve; also time of stress or temperature change in stage test
X displacement of flow unit
v frequency of activation friction angle
grain size diameter
Oi sliding friction
OQv friction angle at constant volume P1 specific gravity of ice
a normal stress
a' effective normal stress ( a = a - u )
al major principal stress ( deviator stress when 3 = 0 ) o3 minor principal stress
aF confining stress
ac effective confining stress af normal stress at failure
0at
octahedral
normal
stress
oat ultimate strength (also au) a" contact attraactive stress ar contact repulsive stress
8 temperature ( -T in C)
T shear stress
Tf shear stress at failure
( sf )m ratio of fitted to actual minimum strain rate
Sact
(act )M ratio of predicted to actual minimum strain rate
(act m
(tf )m ratio of fitted to actual time to minimum t
CHAPTER 1 - INTRODUCTION
Knowledge of the time-dependent stress-strain-strength behavior of frozen soil is of great importance for civil
eng-ineering construction involving naturally and artificially frozen ground. This field has received increasing attention due to the heightened oil-related construction activity in North America and from the use of artificial ground freezing
for soil stabilization under difficult conditions. Much of the recent research has centered on empirical engineering sol-utions rather than theoretically based models, with relatively
little work devoted to the fundamental mechanisms controlling the mechanical behavior of frozen soils. Among the notable exceptions to this are the papers by Goughnour and Andersland
(1968) and Chamberlain et al. (1972), as well as by Sayles (1974) and Vyalov (1973), each of which attempted to provide some fundamental explanation for their observed behavior.
This Report, in a broad sense, attempts to provide a better qualitative understanding of the mechanics of frozen soil. In addition, various quantitative models for the behavior are proposed. Specifically, the Report focuses on the physical mechanisms controlling the strength and deformation behavior of frozen soil systems and proposes methods for quantifying various aspects of creep behavior.
Frozen soil is a complex multiphase system consisting of soil, ice, unfrozen water and air. In order to properly
At-first examine the nature and behavior of its various components. Chapters 2, 3 and 4 summarize the results of an extensive
evaluation of the literature on the mechanics of ice, soil and frozen soil. Chapter 4 also reviews and evaluates the avail-ible explanations and models for frozen soil behavior.
Based on the information in Chapters 2 through 4, Chapter 5 presents a physical model developed to provide a qualitative picture of the principal physical mechanisms controlling the
time-dependent strength-deformation characteristics of frozen sand. Some conclusions are made concerning the validity and relative importance of the proposed mechanisms by drawing upon:
(a) the previously described synthesis of the known behavior of frozen soil systems, (b) data obtained from the extensive creep testing program performed on Manchester Fine Sand (Mar-tin et al. 1981), and (c) results from creep tests conducted on glass beads of various sizes which were made wetting or non-wetting. The resulting probable mechanisms of strength and deformation are discussed in Chapter 5. Appendix A presents details of the testing procedures and results of pertinent creep tests carried out on the glass beads, MFS and ice, together
with the accompanying support data on the glass beads.
While these qualitative models of deformation and strength should be considered in any theoretically based nstitutive relationship, it was not possible to incorporate this knowledge into proposed new quantitative creep models. Instead, emphasis. was placed on developing relatively simple empirical models for
fitting and predicting important aspects of creep behavior, specifically the minimum strain rate,im , and the time to the minimum strain rate, tm . New simple creep models capable of describing the strain - time behavior from the primary through the tertiary stages of creep are proposed and evaluated for saturated and partially saturated frozen sand. These quantita-tive models are described in Chapter 6 and are developed in greater detail in Appendix B. Both Chapters 5 and 6 contain suggestions for additional avenues of research for qualitative and quantitative modelling. The summary and conclusions for Chapters 5 and 6 are reiterated in Chapter 7.
CHAPTER 2 - REVIEW OF THE NATURE AND MECHANICS OF ICE 2.1 Nature of Ice
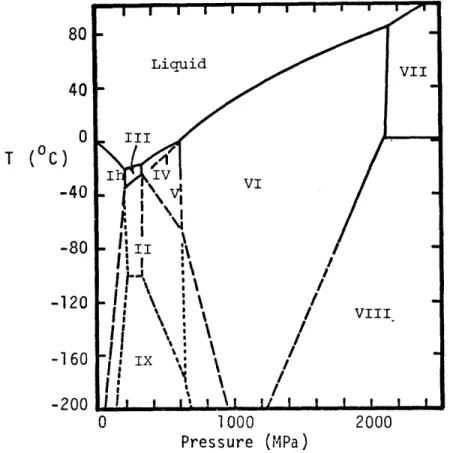
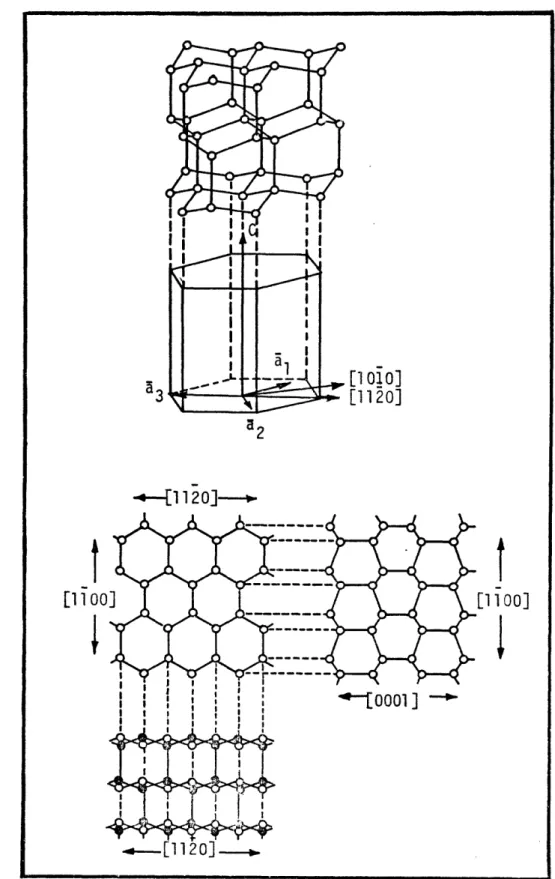
Ice forms an important, possibly controlling, structural component of the frozen soil system. At temperatures between 0 C and -130 C and at ordinary pressures, the thermodynamic-ally stable form of water is Ice Ih (see figure 2.1). Overall, this ice is slightly less dense than liquid water, with a spec-ific gravity of about 0.91, and hence has a greater average molecular spacing than the liquid phase. The crystal structure of ice Ih is distinctly planar with H20 molecules forming puck-ered sheets consisting of hexagonal rings, as shown in Figure 2.2. The plane of the sheets is termed the basal plane, with the axis perpendicular to this plane called the c-axis.
Slip occurs most readily along the basal plane, referred to as basal or easy glide. Slip not along these planes, term-ed non-basal or hard glide, can only be inducterm-ed at stresses greater than ten times that for easy glide (Higashi 1969). One such nonbasal mechanism is dislocation climb, in which a line defect climbs from one glide plane to the next. However,
it has been shown that when attempts are made to produce slip in nonbasal plane directions, the ice often fractures before slip occurs (Gold 1962, 1966(b), Weeks and Assur 1969).
As with most crystalline solids, ice does not necessarily form under favorable thermodynamic conditions. Nucleation is first required, possibly with the aid of existing ice crys-tals, chemical impurities or foreign particles. Nucleation
1000
Pressure (MPa)
FIGURE 2.1 Phase diagram for Ice (after Whalley et al. 1968)
80 40 0 T (C) -40 -80 -120 -1 60 -200 Liquid VII
!II\
I
\
/
V
I I ! IV1\ !
L
/
\
VIII
I I I I I:, 0 2000[11 [1o010 [11201 a2 .-- [1120 ]-o00] 100
FIGURE 2.2 Structure of Ice Ih (in Weeks and Assur 1969)
_ LI
- --
I
may also be induced by mechanical agitation, sonic waves or electrical fields. If no foreign particles or pre-existing
ice are present, then pure water can undergo a great deal of supercooling before ice forms. Experimentally, temperatures
o
as low as -40 C have been obtained before homogeneous nuclea-tion occurred. However, if foreign particles or ice are pre-sent, heterogeneous nucleation occurs at temperatures far clo-ser to 0°C.
Ice typically exists in nature in polycrystalline form. The various types of naturally occurring ice have been des-cribed and classified by Michel and Ramseier (1971). One common form is granular or snow ice, which is associated with freezing under turbulent conditions and the freezing of
slush. The individual grains in snow ice are roughly equi-dimensional and randomly oriented, resulting in generally
isotropic mechanical behavior. Because of the polycrystalline nature of such naturally occurring ice systems, the deformat-ional mechanisms are vastly different from monocrystalline ice.
The nature of ice in frozen soils is generally not well known. While it is possible to distinguish between general types of frozen soil structures (Tsytovich 1975), such as fused, laminar and cellular, details of the nature of the ice in frozen soil are difficult to obtain. For example, the relative hardness of soil particles compared with ice makes it very difficult to obtain clean thin sections (Rein and Sliepce-vich 1978). However, some thin section data by Gow (1975) for
a silt-ice system appear to indicate that pore ice is poly-crystalline in nature.
Nevertheless, it is possible to infer that the nature of this ice and the structure of the frozen soil system are depen-dent on:
(1) soil properties, such as pore size, grain size, permeab-ility, specific surface area, surface activity and surface charge,
(2) pore water properties, such as degree of saturation and amount of impurities, and
(3) nature of the freezing process, such as magnitude of the freezing temperature and rate of freezing relative to the rate of possible pore water migration in the soil.
It is generally accepted that a liquid-like layer of un-frozen water exists at the ice to soil mineral interface. Strong indirect evidence suggests this interfacial water to be fluid and continuous. This evidence includes observed solute movement under an electrical field, conductance meas-urements within samples of frozen soil and ion diffusion (An-derson 1968). Corte (1962) also observed that ice growing
upward can carry soil particles "floating" on the surface of the freezing front. This observation suggests that a thin layer of unfrozen water exists around the soil particles,
whose molecules are constantly replenished by the water in the adjacent reservoir (see Figure 2.3).
The total amount of unfrozen water content for a given soil can be determined by a variety of methods, such as
dila-FIGURE 2.3
,
Corte's experiment: a particle floating on a heaving ice surface (Corte 1962)
Water
Soil
Particle
.,I F-A
tometry, adiabatic calorimetry, x-ray diffraction, heat capa-city, differential thermal analysis and nuclear magnetic
resonance. The results obtained from different methods on similar soils yield reasonably consistent values (Anderson and Morgenstern 1973). For each soil, the amount of unfrozen water typically decreases between 0°and about -50C. At lower temperatures, the amount of unfrozen water remains approxim-ately constant but is finite and appreciable in quantity.
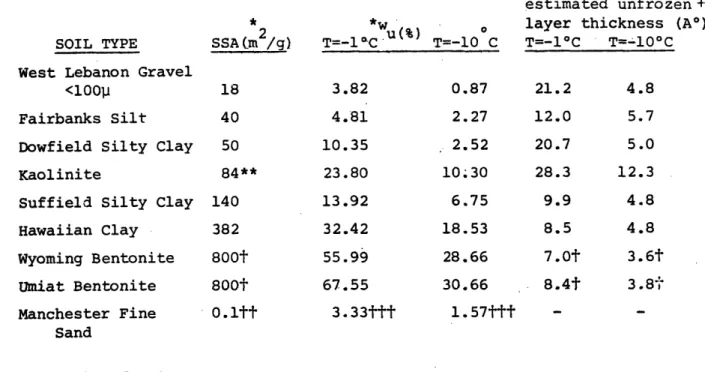
If all of the unfrozen water at low temperatures exists in this soil interfacial layer, then the thickness of this liquid-like layer equals the unfrozen water content, wU , div-ided by the specific surface area, SSA, of the soil. Based on data for several soils (Anderson and Tice 1972, Tice et al. 1978), this procedure yields estimated thicknesses in the tens of Angstroms, as seen in Table 2.1. However, recent work by Martin, Ting and Ladd (1981) indicates that a significant por-tion of the total unfrozen water may in fact be associated with the ice phase, rather than solely with the soil particles.
Consequently, the computed thicknesses of the unfrozen water films in Table 2.1 represent upper bounds.
The nature of the ice in frozen soil is undoubtedly influ-enced by this unfrozen water layer, together with other struc-tural factors such as the nature of the freezing process and soil structure. For example, the nature of the freezing process in a soil system determines the location and structure of the
freez-estimated unfrozen 4
*2 *W(%) o layer thickness (A°) SOIL TYPE SSA(m /g) T=-l C T=-10 C T=-l°C T=-10°C West Lebanon Gravel
<1001 18 3.82 0.87 21.2 4.8
Fairbanks Silt 40 4.81 2.27 12.0 5.7
Dowfield Silty Clay 50 10.35 2.52 20.7 5.0
Kaolinite 84** 23.80 10.30 28.3 12.3
Suffield Silty Clay 140 13.92 6.75 9.9 4.8
Hawaiian Clay 382 32.42 18.53 8.5 4.8
Wyoming Bentonite 800t 55.99 28.66 7.0t 3.6t
Umiat Bentonite 800t 67.55 30.66 8.4t
3.8-Manchester Fine 0.ltt 3.33ttt 1.57ttt -
-Sand
+upper bound values
*SSA and w from Anderson and Tice (1972); SSA mainly from direct ethylene
u
glycol retention measurements or grain size Computations from method des-cribed by Dillon & Andersland (1966); w using isothermol calorimetry.
**Mitchell (1976) reports SSA for Kaolinite as 10-20 m /g; this gives a thickness of 159A at -10C and 69A at -100C.
tValues of SSA are secondary values; for primary SSA (with domain formation), Mitchell (1976) gives 50-120 m2/g; this results in alOx increase in
un-frozen layer thickness.
ttComputed from grain size curves using method by Dillon and Andersland (1966), without due consideration of any clay fraction.
tttw from Tice et al (1978) using pulsed NMR techniques. u
Table 2.1 - Unfrozen Water Content and Estimated Film Thickness in Various Soils.
ing is not fully understood, considerable insight can be ob-tained by studying the nucleation phenomenon as viewed in cloud physics, as well as the mechanism of frost heaving in soil. Details of the results from such studies are presented later in this Chapter.
Generally, the results from such studies indicate that ice nucleates initially in areas away from the silicate surface, probably adjacent to the adsorbed water layer (Anderson 1968). This information, together with the thin section data on a silt-ice system, suggest that the ice in a frozen soil is polycrystalline in nature and exists within the pores of the soil adjacent to the adsorbed water layer, not directly in contact with the soil particles. This topic will also be discussed in greater detail later in this Chapter.
2.2 Mechanics of Ice
Although the mechanical behavior of ice is similar to that of most crystalline materials, ice is unusual in that it com-monly occurs in nature at temperatures near its melting point. Consequently, the bulk of engineering and scientific interest
centers on the behavior of ice at very high homologous temper-atures. The effect of temperature in the typical range of interest (0°to -20°C) is very important because of its large influence on the deformational mechanisms and amount of unfro-zen water present.
Ice exhibits a very time dependent mechanical behavior; it will creep continuously under very low deviatoric stress
levels but presumably possesses a finite, albeit small, limiting longterm strength. Typically, the multiplicity of experimental problems which occur with longterm testing of a frozen material limits the effective length of time over which a test can be carried out. As a result, the actual limiting longterm
strength of ice remains unknown.
In addition, the behavior of ice is very dependent on the level of applied stress or strain rate. At sufficiently high levels of either, brittle failure modes can be induced, whereas at lower levels, apparently ductile failures occur. The struc-ture of the ice also greatly affects its mechanical behavior.
Depending on the nature of the granular structure of the ice, the overall sample behavior can be isotropic or anisotropic, with widely varying rates and modes of deformation.
To better understand the mechanical behavior of ice, researchers have used a variety of different tests. These
include uniaxial (unconfined) and multiaxial compression and and tension tests, Brazil (diametral compression), indentation and beam tests, and ring shear and torsion tests. Of these, the most common are the uniaxial compression and tension tests. Multiaxial testing (such as triaxial, plane strain and biaxial) has recently increased as experimental techniques and apparati become increasingly sophisticated. The remaining tests each have the advantage of convenience, but possess serious inter-pretation problems.
While it is desirable to formulate one generalized equation of state relating strain rate, stress, temperature, deformation, time and structural parameters, this has not yet been accomp-lished. Instead, an arbitrary division between strength and deformation is usually made. Typically, strength data are generated from strain or stress rate controlled tests. Time dependent effects and long term strengths are usually deter-mined from constant load creep tests. In addition, various
rheological models of creep have been evaluated from stress relaxation, stress stage and temperature stage tests.
In order to examine the mechanics of ice, the mechanisms of deformation in ice mono- and polycrystals will first be presented. Then, the strength and deformation behavior of ice will be discussed, together with the effects of various factors such as temperature, stress system, strain rate,
im-purities and structure. Attempts at quantifying this behavior are also presented.
2.2.1 Mechanisms of deformation
A variety of deformational mechanisms occur in polycrys-talline ice. The relative importance of each depends on the applied stress or strain rate, temperature and ice structure. The mechanisms may be loosely grouped into the following
categories.
(i) Microcreep (movement of defects). At low temperatures, stress and strain rates, the movement of point and line defects are important mechanisms of deformation. These mechanisms
include the diffusion of point vacancies and defects, and the dislocation of line defects along basal and nonbasal directions. These mechanisms dominate below about -100C and 0.50 MPa
(Shoji and Higashi 1978). At higher temperatures and stresses, these mechanisms are probably still present, but no longer as rate-controlling processes.
(ii) Microcracking. At stresses or strain rates slightly higher than present in (i), microcracking can occur. This cracking results from dislocation pileups at the grain boun-daries and stress concentrations within the crystal due to defects or impurities. These cracks are primarily transcrys-talline and intercrystranscrys-talline in nature and usually involve only one or two grains at a time (Gold 1966(b), 1970, Hawkes and Mellor 1972). This mechanism is essentially a brittle
phenomenon, but can result in an overall behavior which is ductile in appearance. This mechanism is considered to be the primary deformational mechanism for ice, and can be detected
by viewing the ice sample through crossed polarizers and by pickup of the accompanying acoustical emissions. For poly-crystalline snow ice, Hawkes and Mellor (1972) report that initial cracking activity occurs at between 2 and 4 MPa at
-7 C, while Gold (1977) reports that cracking occurs at stresses above about 1 MPa.
(iii) Grain boundary effects. These include grain boundary sliding, formation of unfrozen water at the grain boundaries, grain boundary migration and growth, and pressure melting and surface regelation. In the region above -100C, Barnes et al.
(1971) suggest that the first four grain boundary mechanisms may occur. Above -3°C, pressure melting and surface regela-tion are also present at the grain boundaries.
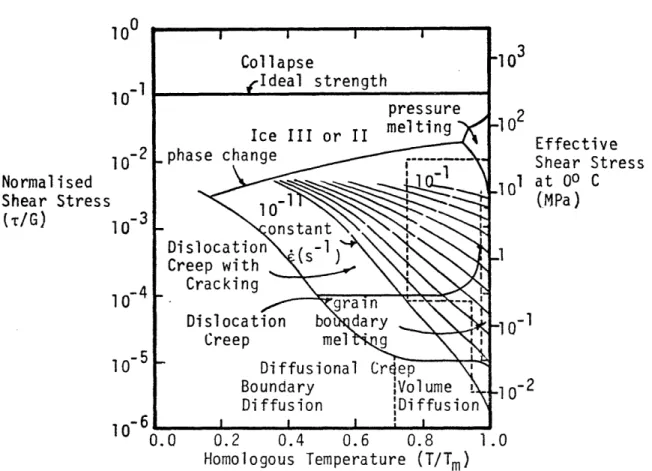
Based on data from various sources, it is possible to construct a deformational mechanism map for a given ice as a function of stress level, temperature and strain rate. Such a mechanism map is shown in Figure 2.4 as constructed by Goodman
100 10-2 Normalised Shear Stress (T/G) 10-3 10- 4 1n-6 Iu 0.0 0.2 0.4 0.6 0.8 Homologous Temperature (T/Tm) Effective Shear Stress 01 at 00 C (MPa) -1 -2 10 1.0
FIGURE 2.4 Deformation-mechanism map for polycrystalline ice of 1 mm
2.2.2 Strength of Ice
The most common tests employed for determining the
strength of ice are the uniaxial unconfined compression and tension tests. Due to the importance of strain rate and
temperature on strength, these are usually the test parameters varied in any test program. However, the apparently minor
testing details such as end restraint conditions and end cap compliance, sample shape and aspect ratio often affect the results. The same applies to the sample variables such as the nature of the ice structure, grain size and the type and amount
of impurities. These typically cause a large scatter in strength values and make it difficult to compare data from different
researchers.
Results from deformation rate controlled compression tests on bubbly snow ice at -9.5C reported by various researchers are plotted in Figure 2.5 and indicate a strong dependence of the uniaxial compressive strength on the applied strain rate. The exact numerical value of this dependence at a given tem-perature varies with the test procedures used, as well as the
strain rate level.
Similarly, the uniaxial compressive strength of ice exhibits a large temperature dependence. As before, difficulty exists in attempting to determine the exact numerical value of this dependence, as the strength values at each temperature are
functions of the applied deformation rate, testing apparatus and the nature of the ice specimen. Kovacs et al. (1977)
2Q 15 peak strength (MPa) 10 5 0 10-7 lO- 6 10 (5 1 104 10 3 10-2
FIGURE 2.5 Uniaxial compressive strength of ice at -9.5 C (+) (Note: numbers beside data points indicate duplicate results;
large variation in results by Haynes 1978 attributed to experimental problems) I I
0
sO I I I Ir 0 columnar 1-5 mm Frederking 1977. 0 columnar <20 mm Gold and Krausz 1971
* · columnar Gold 1970
A granular •<5 mm Gold and Krausz 1971 & granular 1 mm Haynes and Mellor 1977 0
urethane platens V granular 1-2 mm Frederking 1977 O granular 0.6 mm Haynes 1978 / / average ./ curve O
A
32
V
-1 lO _I I A/ . a OV Ir OeIFV
B I I I I Iestimate the temperature coefficient of uniaxial compressive strength for snow ice to be about 0.076 MPa/°C in the range -20°to -400C, based on data from several researchers. Data from Goughnour and Andersland (1968) indicate a rate of in-crease of ice strength of 0.14 MPa/°C between -40and -120C at an applied strain rate of 4.4 x 10⁻⁶ /sec. Data from Haynes
(1978), plotted in Figure 2.6, indicate rates of increase of about 0.7 MPa/0C for the relatively high applied strain rates of 2x10 and lxlO /s. This variation in the reported tem-perature coefficient of ice strength can be attributed to several factors. For example, it is possible that past at-tempts at high strain rate tests resulted in lower strength values due to problems with sample alignment and end restraint; the more recent data of Haynes (1978) suggest that the previous-ly thought drop-off in strength at the large strain rates may not exist.
The various types of naturally occurring ice each possess slightly different strength and deformation behavior. Of these, polycrystalline granular (snow) ice is probably the most repres-entative of the ice in frozen soil. Figure 2.7 illustrates typ-ical stress-strain curves for snow ice at -9.50C subjected to unconfined compression at fairly low strain rates. These curves indicate a typically ductile behavior, with peak strengths at around 1 % axial strain.
The effect of impurities depends on their type and amount. Work by Peyton (1966) on the compressive strength of single
Peak 40 60 50 Strength (MPa) 30 20 10 (I 0 Figure 2.6 -10 -20 -30 -40 Temperature (OC) -50 -60
Uniaxial compressive strength of ice as a function of temperature (from Haynes 1978)
- I ' I I ' I I 2x10 s lxlO- 1-1 o £ l l sx O
0
0 ® O O*~I
%
·
*
:
o
d
V r --I-1Q Axial Stress (MPa) 5 0
FIGURE 2.7 Typical stress-strain curves for granular ice at -9.50C (from Gold and Krausz 1971)
crystals of sea ice indicates that as the brine volume increases, the strength decreases. The effect of particulate impurities contrasts with that of chemical impurities. Goughnour and Andersland (1968) found that the peak strength of 20-30 Ottawa sand imbedded in a polycrystalline ice matrix increases with increasing sand concentration, as shown in Figure 2.8. Above a critical level (42% in the case of Ottawa sand), the rate of increase of strength rises sharply, most likely due to dir-ect interaction between the sand grains. In effdir-ect, the sand--ice mixture becomes a frozen soil, rather than impure ice. Volumetric measurements during shear confirm this hypothesis
as they indicate that the samples above this level dilate similar to dense unfrozen sand.
Unlike the behavior of ice under compressive loading, the tensile strength of ice is almost independent of temperature and strain rate above 10-5 /sec, although a slight increase in strength does occur with decreasing temperature. Failure is essentially a brittle event, with little evidence of internal cracking prior to fracture and separation. The results of
var-ious researchers indicate that bubbly snow ice with an average grain size of 1 mm has an uniaxial tensile strength of abouL
2 MPa in the temperature and strain rate ranges of interest. Note that this value is lower than for compressive loading under the same conditions.
As with compressional behavior, the presence of impurities can influence the tensile behavior of ice. Of the various
10 Peak Strength (MPa) 5 tO FIGURE 2.8
Volume fraction of sand
Effect of sand concentration on the strength of system (from Goughnour and Andersland 1968)
000
psi
chemicals in a study by Nakumura and Jones (1973), only HF demonstrated any significant effect on the observable behavior of the ice. At -110C, an applied strain rate of 1.6x10⁻⁶
and with a 0.8 ppm concentration, the observed peak strength for the HF-doped ice was about half that of the pure ice crys-tal. Jones and Glen (1969(b)) also reported similar trends.
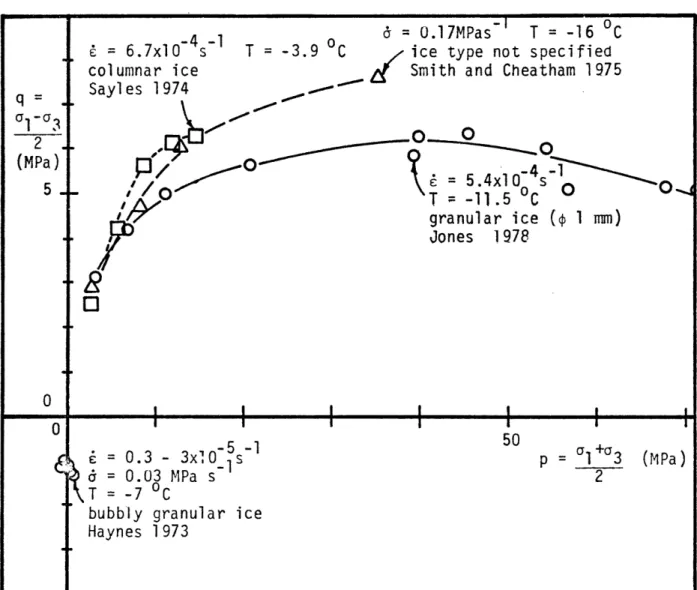
While the bulk of conventional strength testing in ice has used uniaxial (unconfined) loading, some workers have studied the influence of confining stress. Figure 2.9 plots data from Haynes (1973), Sayles (1974), Smith and Cheatham (1975) and Jones (1978). The triaxial compression data, when considered
collectively, indicate an initial increase in strength with confining stress up to a maximum. Jones (1978) reports that above a confining stress of about 40 MPa, the strength decreased with further confinement.
At the lower stresses, confinement reduces cracking activ-ity and compresses any existing air bubbles. Jones reports that for his tests at 0.1 MPa and 33.5 MPa carried out to 60% true strain, the sample at atmospheric pressure was very highly cracked, opaque and chipped, whereas the high pressure sample was uncracked and even clearer than at the start of the test.
At the higher confining stresses, localized pressure melting probably explains the measured decrease in compressive strength with increasing confinement. Global pressure melting, assoc-iated with the water-ice phase transition, is expected above a confining stress of about 110 MPa at -100C.
= 6.7xlO -4s1
-columnar ice Sayles 1974
n = 0.17MPas- I T = -16 °C
T = -3.9 C ice type not specified Smith and Cheatham 1975
0
0
°0 : 5.4x10⁻⁴s O T -11.5 C 0 granular ice ( 1 mm) Jones 19780
I i I I I I J -5 -1 50 =l +Pa S = 0.3 - 3x10_ s p = 1 3 (MPa) = 0.03 MPa s-' 2 T = -7 0Cbubbly granular ice Haynes 1973
_~~~~~~ , I..I
~
~~~~~~~~~~~~~~~~~~~~~~~~~~~~~~~~~~~~~~~~~~~~i
FIGURE 2.9 Triaxial strength of polycrystalline ice
q a1 -a3 2 (MPa) 5-0 0 -I I I I I I
Triaxial tensile testing results from Haynes (1973), also plotted in Figure 2.9, were used to indicate that
polycrystal-line ice follows neither the Mohr-Coulomb nor Griffith's fail-ure criteria.
Frederking (1977) carried out plane strain tests on colum-nar and snow ice. For polycrystalline snow ice, his data
indicate little difference between uniaxial and plane strain strengths as a function of strain rate.
Other tests that have been used to test ice in the labora-tory and field include the Brazil (diametral compression), ring tension and beam tests. Each of these possess
severe interpretaton problems, associated with non-uniform
stress states, large stress gradients, and the use of elasticity theory for a non-elastic material. Consequently, they are not valid as accurate strength tests, but should be regarded as strength index tests at best.
2.2.3 Ductile-to-brittle transition
According to the classical descriptions of mechanical behavior, ductile failure occurs after appreciable plastic deformation, whereas brittle fracture occurs after little or no plastic deformation. While it is not clear what amount of plastic deformation constitutes "appreciable" plastic deformation for ice, it is possible to qualitatively
differ-entiate between these types of observed fi!Ies. The transi-tion from ductile to brittle behavior for the shear of poly-crystalline ice has been noted by various workers, and is use-ful in defining a reference strength for a given deformational mode, ie. ductile behavior.
In tension, Gold (1977) states that this transition occurs abruptly at the strain rate which does not allow sufficient time for dislocations to contribute significantly to the strain prior to the initiation of fracture.
For compressive loading, the ductile to brittle transition is much more gradual. While many researchers have discussed a ductile yield to brittle fracture transition zone, it is often difficult to ascertain the criterion used to determine this transition in each case. In the range of compressive stresses and strain rates of engineering interest, the pri-mechanism of deformation, cracking, is a brittle event.
How-ever, the overall behavior is ductile for ice loaded in uni-axial compression at reasonably low strain rates (below 10O /s). Shear zones develop in areas approximately parallel to
the planes of maximum shear stress. This is usually assoc-iated with a barrelling failure (Gold 1970). However, if the ends are laterally restrained, cataclastic failure usually results, with conical wedges retained at the ends (Hawkes and Mellor 1972). At high applied strain rates, more abrupt
fail-ures occur, usually by the formation of a fault zone with little plastic straining.
Based on the observed change-over in overall stress-strain behavior, Gold and Krausz (1971) quote a ductile-to-brittle transition at about 2x10⁻⁴ /s for a type of columnar-grained ice. It should be noted that granular ice does not exhibit well-defined overall brittle behavior due to its inherent structure. At comparable strain rates, Gold and Krausz were not able to obtain brittle mechanical behavior for granular ice. It is possible that at higher strain rates, a change in mechanical behavior can be observed; however, data from Hawkes and Mellor
(1972) indicate that even at 2x10⁻³ /s, a substantial amount of ductility still exists. Consequently, it may be difficulty
to determine a ductile-to-brittle transition for granular ice based on an observed change-over in mechanical behavior.
By observing the failure mode, one can also attempt to clas-sify the behavior as brittle or ductile. Gold (1970) reported that brittle failure occurred by the abrupt development of a fault zone, while ductile failure was associated with barrelling or f the development of zones of crack concentration. In
failure types. As the applied strain rates increase, the times to failure decrease, as does the ability to identify the failure mode. Also, it is sometimes difficult or impossible to determine the exact mode of failure based on the remains of a ruptured
sample.
When the ends are not laterally restrained, failure may occur by axial cleavage. In this case, the remains of the failed specimen differs greatly from one which failed by a ductile mode, and this can be used to differentiate between the failure modes. However, it is not altogether clear whether axial cleavage necessarily represents a truly brittle event characteristic of the ice sample. Instead, it may merely reflect the amount of restraint provided at the ends and the nature of the contact stresses at the platen/sample interface. Hawkes and Mellor (1972) took this position and disregarded
all of their data exhibiting axial cleavage.
Hawkes and Mellor used a third method for determining the ductile-to-brittle transition. Basing their criterion on the belief that strength initially increases with strain rate,
then reaches a maximum at the ductile-to-brittle transition, and thereafter possibly decreases to some asymptotic limit for very high strain rates, they plotted their peak strengths against applied strain rate. Because of the apparent maximum in strength at about 10 /s, this was cited as possibly beirg the ductile to brittle transition zone. However, preliminary data from Haynes (unpublished) seem to indicate that no
drop-off in strength or in strength increase with increasing strain rate occurs at strain rates up to 10-1 /s.
Slight errors in sample alignment and deficiencies in end restraint become magnified at higher strain rates. Also, exper-imental difficulties exist with measurement, loading and control systems. Consequently, some researchers have reported decreases in strength at high strain rates which subsequently disappeared with improved testing techniques.
With all of this uncertainty, it is difficult to arrive at a unique ductile to brittle transition value for a given ice type based on the results of different researchers. For columnar-grained ice, Gold and Krausz (1971) report the beginning of the transition at 2x10- 3 /s, with the transition for granular ice probably at a higher rate. Jones (1978) observed a change in mechanical behavior for granular ice at 10 /s, together with
a measured slope change in the peak strength vs. strain rate plot at this strain rate. With a 33.5 MPa confining stress, however, this transition disappeared, as the cracking activity was suppressed and only ductile behavior resulted.
Neverthe-less, a fairly consistent ductile-to-brittle transition zone has been reported for granular ice tested in unconfined com-pession by various researchers at a strain rate of 10- 3 /s.
2.2.4 Deformation of Ice
Ice exhibits significant instantaneous recoverable (elastic) deformation as well as instantaneous permanent and recoverable time-dependent deformations under load. By far the greatest portion of the total deformation, however, is the time-dependent
irrecoverable deformation. Typically, polycrystalline ice under constant stress exhibits a deformation-time behavior similar to that shown in Figure 2.10(a). Classically, the initial or primary stage of creep denotes decreasing strain rate, the sec-ondary or "steady state" stage reflects a constant strain rate, and the tertiary stage an increasing strain rate. The tertiary stage of creep terminates by the failure of the sample due to "creep rupture". As will become evident, in most cases the sec-ondary stage is not a "steady state" condition, but merely a point of inflection in the strain-time plot. This is partic-ularly evident when the data are plotted using log strain rate and log time, as in Figure 2.10(b).
Creep deformation behavior exhibiting all stages of creep is typical also of monocrystalline ice constrained to deform in hard glide orientations (Butkovich and Landauer 1959, Hig-ashi 1966). For monocrystalline ice deforming along basal planes, recent data indicate that primary (strain hardening) creep is also present at strain levels less than 0.25% (Ramse-ier 1971).
Almost all of the mechanisms of deformation described in Section 2.2.1 on deformational mechanisms exhibit some time
dep-5 4 3 2 1 0 0 10Q time (s x 103) (a) 1 -5 strain rate (s-1) 1 0- 6 10 102 (b)
FIGURE 2.10 Typical creep data
strain
£ C(%)
I I I
Fine polycrystalli'ne Ice
o=1.3 MPa T=-4.50C Kuo 1972 Test 10B Primary Secondary Tertiary
creep creep I creep
I
II
-
III
actualI~~~~
~
da
ta
point
l~~~~
I
- -- . I
I
I
I
2Q 30 Kuo 1972 TestKuo 1972 Test 1OB
-, .-. I Ill--I --1n-7 104 time (s ) -E_ I
endence. Point and line defect motions are controlled by time dependent diffusion and dislocation processes. Grain boundary
sliding may involve viscous shear mechanisms. Formation, trans-port and regelation of unfrozen water require time dependent liquid transport and heat flow. Cracking, while itself not a
time dependent phenomenon, is the result of a time dependent buildup of dislocations at the grain boundaries and other points of stress concentration. Only the limited elastic compression
and extension of the ice crystal lattice itself might truly be considered to be time independent phenomena.
Of these deformational mechanisms, some tend to soften the structure of the ice crystal, while others tend to harden the crystal. In a single crystal of pure ice, dislocation and point defect motion along the basal planes will marginally
reduce the strength of the crystal by reducing the number of bonds acting along a given glide plane. Similarly, at higher stresses, microcracking in a pure ice monocrystal would also decrease the sample strength and cause an increase in the observed strain rate.
For monocrystals which possess impurities or are constrained to deform in hard glide, however, strain hardening does occur. The presence of certain chemicals, such as NH3, or particulate impurities serves as a barrier to dislocation motion, resulting in a strain hardening behavior (Jones and Glen 1969(b), Hooke et al. 1972). Tensile tests of ice monocrystals which were oriented so that the resolved shear stress on the basal planes was zero