Critical Assessment of Techniques, Markets and Overall Economics of
Generation III+ and IV Reactors
by
Lucas Thorley Rush B.E., Chemical Engineering (2015)
B.S., Mathematics (2015) University of Queensland
SUBMITTED TO THE DEPARTMENT OF NUCLEAR SCIENCE AND ENGINEERING IN PARTIAL FULFILLMENT OF THE REQUIREMENTS FOR THE DEREE OF
MASTER OF SCIENCE IN NUCLEAR SCIENCE AND ENGINEERING AT THE
MASSACHUSETTS INSTITUTE OF TECHNOLOGY September 2018
2018 Massachusetts Institute of Technology All rights reserved
Signature of Author...Signature
red acted
Lucas Thorley Rush Department of Nuclear Science and Engineering, MIT
I F
June 8, 2018Certified by...Signature
redacted
C ertified by ...
\j
J opo BuongiornoProfessor of Nuclea Science and ngineering, MIT 32 i Thesis Supervisor
Signature redacted
...
C rles Forsberg
Principal Research Scientist, MIT Thesis Reader A ccepted by ...
Signature redacted
MAY 062019
LIBRARIE$
ARCHIVES
Ju Li
Battelle Energy Alliance Professor of Nuclear Science and Engineering, MIT TITUTE
IProfessor
of Material Science and Engineering, MITY Chair, Department Committee on Graduate Students
MASSACHUSETTS INS OF TECHNOLOG
77 Massachusetts Avenue Cambridge, MA 02139 http://Iibraries.mit.edu/ask
DISCLAIMER NOTICE
Due to the condition of the original material, there are unavoidable
flaws in this reproduction. We have made every effort possible to
provide you with the best copy available.
Thank you.
The images contained in this document are of the
best quality available.
Page Left Intentionally Blank
Critical Assessment of Techniques, Markets and Overall Economics of
Generation III+ and IV Reactors
By
Lucas T. Rush
Submitted to the Department of Nuclear Science and Engineering on June 8, 2018 in Partial Fulfillment of the
Requirements for the Degree of Master of Science in Nuclear Science and Engineering
ABSTRACT
This thesis performs a high-level assessment of the economic potential of Generation III+ and IV reactors. It examines both a market and product-based approach for the cost of new nuclear installations. It is the contention of this author that the support of the economic benefits for Generation IV reactors is unwarranted. Based on the uncertainties and lack of detailed design engineering completed, there is not sufficient evidence to suggest that Generation IV reactors, solely by virtue of their different design, will have higher economic potential than current LWRs.
A market-based approach was initially taken to determine the upper bound for the cost of nuclear power. In every case, except when the Generation IV reactors had a low operating cost, their capital cost had to be lower than that of a LWR, due to their higher enrichment requirements. It was found that a change of
~0.1 c/kWh in the operation cost corresponded to a cost differential of~200 $/kW in the capital cost.
Due to the high capital costs and relatively low revenue streams of new nuclear plants it was found that their commercial success was highly sensitive to the capital cost with even mild increases in cost having a significant effect over the entire project. This lead to the conclusion that the ability to guarantee returns on an investment potentially limits nuclear projects to regulated markets.
A product-based approach was then used to assess the real and estimated costs of Generation III+ and IV reactors. It was found that the cost breakdown of each Generation III+ reactor was similar, however, the overall cost varied significantly by region. The installation costs where the most significant portion of the costs, ranging from 40-50%, with the nuclear and turbine island equipment costs only represented
between 17-25% of the total overnight cost. The estimated costs for the different Generation IV designs from modern estimates were all localized around 4,750 $/kW, while earlier estimates place the cost much lower, around 1,750 $/kW.
The uncertainty in cost estimation, both its effects and its sources, was examined. It was found that when cost information over five years old was used, then the uncertainty in cost escalation was significant. A major factor that was found to have an effect on the reliability of cost estimates was also the design maturity. Novel projects with lower design maturity projects systematically under-predict the final cost resulting in cost escalation with time.
A common proposition for Generation IV reactors is that they are used for process heat applications. A study of all industrial sites in the United States, and extended to the world, found that the number of potential sites are lower than expected due to two major reasons. Firstly, the consumption of by-product streams for heat generation in major energy users, i.e. refineries, form a major component of their heat supply. Secondly, the commercial development of technologies that can actually utilize the process heat for high temperature products, such as hydrogen, have not been completed.
A major potential strength would be the requirement of CO2 free heat for the transportation sector. This
would also require the development of other significant technologies, such as biofuels, to be feasible. Should a transition to hydrogen and/or synthetic fuels occur in the transportation sector, the economic opportunity to use nuclear reactors to generate those fuels would be substantial.
Thesis Supervisor: Jacopo Buongiorno
Title: TEPCO Professor of Nuclear Science and Engineering
ACKNOWLEDGEMENTS
I would like to thank the Future ofNuclear Energy in a Carbon-Constrained World study and its
sponsors (Sloan Foundation, EDF and Shell) for being able to give me an opportunity to work on this project. All of the team members have been kind and supportive of my work and my growth as an engineer.
In particular, I would like to thank the leadership team: Prof. Michael Corradini, Prof. Jacopo Buongiorno and Dr. David Petti. Prof. Michael Corradini was always very supportive of any student coming to him for help. Dr. Petti was always available to hear me whine and always offered a supportive hand in response.
Special thanks to my academic supervisor, Jacopo Buongiorno. I know that it can't be easy dealing with me but he was always kind and available to hear my outlandish ideas. I hope one day to shout him a beer at the Prairie Hotel in Parachilna.
TABLE OF CONTENTS
Abstract ... 3 Acknowledgem ents ... 5 Table of Contents ... 6 List of Figures... 10 List of Tables ... 12 1 Introduction... 151.1 Expected Outcom es of M aster's Thesis... 16
1.2 Im portant Term s and Concepts ... 17
1.2.1 Overnight and Total Costs ... 17
1.2.2 Levelized Cost of Electricity (LCOE)... 17
1.2.3 Discount Rate... 18
2 Nuclear Energy Econom ics... 18
2.1 Required Capital Cost... 19
2.1.1 Operations, M aintenance and Fuel Costs... 19
2.1.2 A ssum ptions...23
2.1.3 Analysis...24
2.2 Energy Return on Energy Invested ... 27
2.3 Cost Indexing for Nuclear Reactors... 28
2.3.1 Five Y ear Rule... ... 31
2.4 Research and Developm ent Investm ent ... 31
2.5 Effect of uncertainty on Cash Flow ... 33
2.5.1 Discount Rate ... 34
2.5.2 Capital Cost... 35
3 Generation II Reactors ... 36
3.1 Generation II Reactor Costs ... 36 6
3.2 Breakdow n of Generation II Reactor Costs ... 38
4 Generation III+ Reactors... 41
4.1 W estinghouse AP1000...41
4.1.1 A P 1000 N uclear Regulatory Com m ission Fillings... 42
4.1.2 U S A P 1000 Cost Estim ates... 43
4.1.3 Com parison of U S AP 1000 Cost Estim ates... 46
4.1.4 N on-U S AP1000 ... 48
4.2 K EPCO A PR-1400 ... 48
4.2.1 Current D eploym ent... 48
4.2.2 APR-1400 Costs... 49 4.3 EPR ... 50 4.3.1 O lkiluoto 3 ... 50 4.3.2 Flam anville 3 ... 51 4.3.3 H inkley Point C... 51 4.3.4 Taishan I & 2...51
4.3.5 Overview of EPR Costs ... 51
4.4 Com parison of AP1000, APR 1400 and EPR ... 52
4.5 Breakdown of a Pressurized W ater Reactor Capital Cost... 53
4.5.1 U S AP1000 ... 53
4.5.2 Chinese AP1000... 54
4.5.3 South Korean APR 1400... 54
4.5.4 U A E APR 1400... 55
4.5.5 European EPR ... 55
4.5.6 Chinese EPR ... 56
4.5.7 Com parison of Capital Cost Breakdown... 56
5 Generation IV Reactor Concepts ... 59
5.1.1 Spectrum /M oderator ... 60
5.1.2 Coolant ... 61
5.1.3 Fuel ... 61
5.1.4 Technical Readiness...62
5.2 Sodium -cooled Fast Reactor ... 62
5.3 H igh Tem perature G as Reactor... 63
5.4 M olten Salt Reactor ... 64
5.5 Fluoride-salt-cooled High-tem perature Reactor ... 65
5.6 Com parison of Generation IV Designs ... 66
5.7 Underestim ation of First-of-a-K ind Plant Cost... 67
5.8 Independent Cost Estim ation ... 72
5.8.1 NuScale Aspen Econom ic Analyzer M odel... 75
6 N on-traditional N uclear Power Plant M arkets ... 77
6.1 Previous W ork ... 77
6.1.1 Integration of High-Temperature Gas-Cooled Reactors into Industrial Process Applications 78 6.1.2 High Temperature Gas-Cooled Reactor Projected Markets and Preliminary Economics .. 78
6.1.3 Survey of HTGR Process Energy Applications ... 79
6.1.4 Lim itations of Previous W ork and Know ledge Gap ... 80
6.2 A ssum ptions...80
6.2.1 H eat and Electricity Co-G eneration... 81
6.2.2 D ifferential Tem perature Requirem ent ... 82
6.2.3 Technology Readiness ... 82
6.2.4 Heat Availability ... 83
6.2.5 Pre-heating ... 84
6.3 United States of Am erica ... 85
6.3.1 Overall Energy M arket in the United States ... 85 8
6.3.2 Site Specific Greenhouse Gas Em issions... 86
6.3.3 Overall Process Heat M arkets in the United States... 110
6.4 Rest of the W orld... 114
6.4.1 Capacity Factors... 114
6.4.2 W orld-wide Nuclear Process Heat Capacity... 115
6.5 Fuel M arkets ... 116 6.5.1 Electrification... 117 6.5.2 Hydrogen... 117 6.5.3 Biofuels ... 119 6.5.4 Comparison... 119 6.6 Desalination ... 120
6.6.1 Reverse Osm osis ... 121
6.6.2 M ulti-Stage Flashing... 121
6.6.3 M arket Capacity and Growth of W ater Desalination... 122
7 Conclusion ... 124
7.1 M arket-Based Analysis ... 124
7.2 Product-Based Analysis ... 125
7.3 Process Heat Analysis...125
7.4 Future W ork ... 126
LIST OF FIGURES
F igure 1. Scope of W ork ... 17
Figure 2. Average Power Plant Operating Expenses for Major U.S. Investor-Owned Electric Utilities in 2015 (EIA, Table 8.4. Average Power Plant Operating Expenses for Major U.S. Investor-Owned Electric Utilities, 2005 through 2015 (Mills per Kilowatthour), 2017)...20
Figure 3. O&M Low Case with LCOE of 60 $/MWhr ... 25
Figure 4. O&M Medium Case with LCOE of 60 $/MWhr...26
Figure 5. O&M High Case with LCOE of 60 $/MWhr ... 26
Figure 6. EROEI Energy Cliff (WeiBbach, et al., 2013)...28
F igure 7. C ost Indexes ... 29
F igure 8. P C C I C ost Index ... 30
Figure 9. Cumulative Discounted Cash Flow for varying Discount Rate... 35
Figure 10. Cumulative Discount Cash Flow for varying Capital Cost ... 36
Figure 11. Overnight Construction Cost of Nuclear Power Plants by Date of Construction (Lovering, Yip, & N ordh au s, 20 16)...37
Figure 12. Overnight Construction Cost of Nuclear Power Plants by Construction Duration (Lovering, Y ip , & N ordhaus, 20 16)...38
Figure 13. EEDB Best Case Breakdown of PWR... 39
Figure 14. EEDB Median Case Breakdown of PWR ... 40
Figure 15. EEDB Improved Case Breakdown of PWR ... 40
Figure 16 The Westinghouse AP 1000 Plant (Westinghouse, 2016)...42
Figure 17 Comparison of API000s, APR1400s and EPR worldwide ... 53
Figure 18 Black & Veatch Breakdown of Cost for a Modern PWR... 54
Figure 19 KEPCO Breakdown of APR-1400 ... 55
Figure 20. ED F B reakdow n of EPR ... 56
Figure 21. Capital Costs of Advanced Nuclear Plants (Energy Options Network, 2017) ... 67
Figure 22. AACE Cost Estimation Classes: Black band represents the higher uncertainty bound and the red band represents the lower uncertainty bound...69
Figure 23. Cost Increase with Design Maturity. N.B. that the estimate classes have changed with time, the original class estimates went from 0-4 and now go from 5-1 ... 70
Figure 24. Ratio of Estimated to Actual Costs of Reactor Projects ... 71
Figure 25. Influence of Design Decisions with Accumulation of Costs (Towler & Sinnott, 2013)...72
Figure 26. N uScale R eactor D iagram ... 75 10
Figure 27. Break-Even Natural Gas Prices Calculated for four HTGR-Integrated Processes (Nelson, et al., 2 0 10 ) ... 7 8 Figure 28. High Temperature Gas-Cooled Reactor Projected Markets and Preliminary Economics Results ( N L , 2 0 1 1)...7 9 Figure 29. Number of 500 MWt HTGR Modules at 85% Capacity Required to Meet Demands (Konefal &
R ack iew icz, 200 8)...79
Figure 30. Ethene production Hess Diagram... 85
Figure 31. 2014 Primary Energy Consumption by Source and Sector ... 86
Figure 32. Process Gas Temperatures Along Radiant Coils (Zimmermann & R, 2012)...95
Figure 33. U S N uclear Process H eat Potential ... 114
Figure 34. Fundamentals of Reverse Osmosis Operation (GBP, 2016)... 121
Figure 35. Multi-Stage Flash Desalination (SV, 2016)... 122
Figure 36. Breakdown of Desalination Plants per Geographical Area (Zotalis, Dialynas, Mamassis, & A ngelak is, 2 0 14 )... 124
LIST OF TABLES
Table 1 Nuclear Reactor Generations (Goldberg & Rosner, 2016)... 15
Table 2. WACCs of various industrial companies (Focus, 2017)... 18
Table 3. Estimated Operation and Maintenance Cost of Generation IV Reactors... 20
Table 4. Fuel cycle costs for PWR - Once Through - U02 fuel (Kim, 2015) ... 21
Table 5. Raw Uranium and SWU Ratios for LWR and Generation IV Reactors ... 23
Table 6. Fuel Costs for Generation IV Reactors ... 23
Table 7. System Specific A ssum ptions... 24
Table 8. Effect of Construction Period on Available Capital ... 24
Table 9. 2,500 $/kW in Years 1980 and 2000 in 2014 Dollars... 31
Table 10. R&D Spending by Industry (PwC, 2018)... 32
Table 11. R&D Expenses for Areva and Toshiba in 2014... 33
Table 12. Constant Parameters for Cash Flow Calculations... 34
Table 13 B reakdow n from EED B ... 39
Table 14. AP 1000 Combined License Applications (Nuclear Regulatory Commission, 2016)...42
Table 15. Estimated Total Construction Cost for Turkey Point Units 6 and 7 (Florida Power and Light) 44 Table 16. Turkey Point U nits 6 and 7 ... 44
Table 17. Vogtle Units 3 and 4 (Adjusted to account for the whole project) (Georgia Power, 2016)...45
Table 18. Virgil C. Summer Units 2 and 3 (Adjusted to account for the whole project) (SCANA, 2016) 46 Table 19. Construction Cost Estimates for the AP 1000 Reactor ... 47
Table 20. KEPCO APR-1400 Design Parameters (Lee, Kim, & Suh, 2009) ... 48
Table 21. APR 1400 under construction worldwide (WNA, 2016) (WNA, 2016)... 49
T able 22. A PR 1400 C osts... 50
Table 23. EPR Design Parameters (UK-EPR, 2007)... 50
Table 24. European EPR Cost Estim ates ... 52
Table 25 Comparison of Capital Cost Breakdowns between geography and design... 56
Table 26. AP1000 and APR1400 Lang Factor ... 58
Table 27. Common Installation Factors (Towler & Sinnott, 2013) ... 59
Table 28. Material Cost Factor (Towler & Sinnott, 2013)... 59
Table 29 Reactor Designs by Country and Coolant Selection (Verma, 2016) ... 60
Table 30. SFR Cost Estimate (Boardman, Hui, Carroll, & Dubberley, 2000)...63
T able 31. H T G R C ost Estim ates...64
T able 32. M SR C ost E stim ates ... 65 12
T able 33. FH R C ost E stim ates...66
Table 34. G eneration IV R eactor Costs ... 66
Table 35. AACE Cost Estimation Classes ... 68
Table 36. Effect of level of design maturity on nuclear projects ... 71
Table 37. R esults of N uScale A nalysis... 74
Table 38. Aspen Economic Analyzer Containment Vessel Parameters... 76
Table 39. Aspen Economic Analyzer Reactor Pressure Vessel Parameters ... 76
Table 40. Aspen Economic Analyzer Steam Generators Parameters ... 76
Table 41. Aspen Economic Analyzer Results...77
Table 42. Overall Assumptions for Process Heat Markets ... 81
Table 43. 2015 Co-Generation Fuel Consumption Breakdown Analysis (EIA, 2017)...82
Table 44. Maximum Process Heat Temperature availability by Reactor type...84
Table 45 2014 US Primary Energy Consumption and Equivalent Number of AP 1000 ... 86
Table 46. Overview of Sectors in EPA GHG Dataset ... 88
Table 47. Assumptions related to GHG Emissions Analysis...89
Table 48. CO2 Content by Fuel Source (EIA, 2016)... 90
Table 49. Co-generation Nuclear Process Heat Potential...91
Table 50 Petroleum Refinery Major Units with Heat Requirements (Hydrocarbon Publishing Company, 2 0 12 ) ... 9 2 Table 51 Stand Alone Refineries Nuclear Process Heat Potential...94
Table 52 Refineries Nuclear Process Heat Potential... 95
Table 53. Ammonia Production Reactions ... 96
Table 54. Acrylonitrile Nuclear Process Heat Potential ... 97
Table 55. Styrene Nuclear Process Heat Potential...98
Table 56. Ethylene Glycol Nuclear Process Heat Potential...99
Table 57. Vinyl Chloride Nuclear Process Heat Potential...99
Table 58. H igh N ylon Production Em itters ... 100
Table 59. Nylon Nuclear Process Heat Potential... 100
Table 60. US Soda Ash Production Facilities... 102
Table 61. Soda Ash Nuclear Process Heat Potential... 102
Table 62. Breakdown of Fuel Type Usage at ArcelorMittal Steelworks at Burns Harbor ... 104
Table 63 Pulp and Paper Nuclear Process Heat Potential... 106
Table 66. Specialty Plastics and Chemicals Required Temperatures ... 109
Table 67. Other - Specialty Thermoplastics Nuclear Process Heat Potential ... 109
Table 68. Other - Universities Nuclear Process Heat Potential... 110
Table 69. Other - Brine Nuclear Process Heat Potential... 110
Table 70. Nuclear Process Heat Potential - 150MWth... .... ... 112
Table 71. Nuclear Process Heat Potential - 300MWth...1 13 Table 72. World-wide Nuclear Process Heat Capacity Estimation for 300MWth Reactors... 116
Table 73. Fuel M arket A ssum ptions ... 117
Table 74. Electrification Reactor Requirements ... 117
Table 75. Hydrogen - Electrolysis Reactor Requirements ... 118
Table 76. Hydrogen - Thermochemical Reactor Requirements ... 118
Table 77. Biofuels Reactor Requirements ... 119
Table 78. Comparison of Fuel Reactor Requirements ... 120
Table 79. 100 Million Cubic Meters of Desalinated Water Energy Requirements ... 123
1
INTRODUCTION
The need to decarbonize our energy production has been made abundantly clear and nuclear power plants offer a potential pipeline to do so. The current fleet of aging nuclear reactors in the United States (U.S.) comprises Generation 1I reactors with the first of the Generation III+ reactors currently under construction at the Vogtle site in Georgia. New advanced reactors, Generation IV, claim to offer greater safety, higher efficiency and greater cost reduction than the previous generations of nuclear reactors. Table 1 outlines the broad definition for each generation of nuclear reactors.
Table I Nuclear Reactor Generations (Goldberg & Rosner, 2016)
Generation Description Years Examples
Generation I Includes prototype, test and early power 1950's-1960's Shippingport reactors which began the civil nuclear program. Dresden-1
An evolution from Generation I which were Late 1960's - LWR-PWR/BWR Generation II planned to be economic and reliable. They Present VVER
compose most of the current operating fleet CANDU
Very similar to Generation II reactors however 1990's -Present AP-600
Generation III with evolutionary and modernized design ABWR
improvements. CANDU 6
Generation An evolutionary design from Generation III 2000's - Present AP-1000 III+ however with significant improvements in ACR-1000
safety
A revolutionary design that are inherently safe 2030's + SFR
Generation IV and with numerous benefits that were MSR
unavailable to the previous generations; HTGR
actinide burnup, high temperature outlet FHR
The onset of relatively low cost natural gas along with the increasing penetration of solar and wind have led to a highly competitive electricity marketplace. The major cost component of nuclear power is the capital cost and so an in-depth review and analysis of the economics of nuclear power plants are required. Both current and future reactor technologies will be analyzed along with broader market economics. This analysis will involve the assessment of currently installed Generation II U.S. reactors along with the AP 1000, APR1400 and EPR, three Generation III+ pressurized water reactors, along with a comparison and review of potential next generation nuclear reactors; the sodium fast reactor (SFR), molten salt
reactor (MSR), high temperature gas-cooled reactor (HTGR), and the Fluoride-salt-cooled High-temperature Reactor (FHR).
1.1 EXPECTED OUTCOMES OF MASTER'S THESIS
This thesis forms part of the MIT's Future of Nuclear Energy in a Carbon-Constrained World. The study's goal is to identify the prospects for innovative nuclear technologies, policy and business models, and regulatory governance mechanisms to accelerate the transition to a lower-carbon global energy system in the United States and around the world.
The scope of work defined within this master's thesis is outlined in Figure 1 with the major sections being;
* Advanced light water reactor assessment * Cost estimation for advanced reactors
* Potential missions and markets for advanced reactors
It became clearly evident in the early stages of the work that the information and assumptions related to cost estimation of nuclear reactors, both Generation III and IV, contained underlying uncertainties that had not been fully propagated and understood. These underlying uncertainties became of particular focus for this thesis.
L Compliance with 213 Century
Candidate Advanced Reactor Technologies regulatory requirements and
public expectations
Choose reference ALWR
Determine Determine cost structure: what are Identify possible missions Establish cost range for readiness timeine
the largest cost contributors? for each advanced reactor each advanced reactor for each advanced
(e.g. Process Heat) reactor
Does nuclear I Determine target cost required
Delaevitoy Yes (either A LWR nr I for nuclear to be competitive In
and move on to (ete-_WRo
next market advanced) meet I various markets (for given
No cost target? I carbon constraints)
How to reduce nuclear cost
- Prefab concrete structures and adv excavation techniques
- Modularity strategies (including factories and shipyards)
- EPC T&Cs designed to control costs
- Adopt deployment paradigm from other Industries
- Power cycles with storage or peak power capability
Figure 1. Scope of Work
1.2
IMPORTANT TERMS AND CONCEPTSThere are important terms and concepts that will be referred to throughout this report. These terms are defined below and include the difference between overnight and total costs, the levelized cost of electricity and discount rate.
1.2.1 Overnight and Total Costs
Overnight costs refer to the total costs of a building a power plant without considering financing or escalations costs, i.e. no time-effect on the cost, being built "overnight". The total cost in comparison refers to all costs invoked for construction i.e. includes escalation and financing costs. Commonly the overnight cost is used to compare differing plant designs and competing technologies. However, an issue with simply using the overnight cost is that a significant proportion of the cost of a nuclear power plant is the financing costs due to the long construction time.
1.2.2 Levelized Cost of Electricity (LCOE)
While this report will focus mostly on the capital cost of nuclear power plants, the levelized cost of electricity (LCOE) is also a commonly-used figure of merit. The LCOE expresses the levelized cost of producing the electricity over the lifetime of the plant. It is determined by the ratio between the total costs of the plant and the total electricity generated;
n It+Mt+Ft
LCOE t= (1+r)t
(
En Et
t=1 (1+ r)t
Where It is the investment cost in year t, Mt is the operations and maintenance cost in year t, Ft is the fuel cost in year t, Et is the electricity produced in year t, r is the discount rate and n is the expected lifetime of the power station. It should be noted that there are issues with LCOE, in particular, it does not take into account the dispatchability and availability of the electricity.
1.2.3 Discount Rate
The discount rate is used in a discount cash flow to determine the present value of future cash flows. It considers both the risk and uncertainty in the analysis along with the time value of the money, i.e. inflation. Another value that can be used as a discount rate is the weighted average cost of capital (WACC). Businesses use their WACC as the discount factor as it is the weighted average between the cost of equity and the cost of borrowing for their projects. Table 2 details the WACCs of various utility, energy and chemical companies. It should be noted that while the WACC for Southern Company as a whole is quite low the cost of capital for a specific project may be higher based on the risk profile of the project.
Table 2. WACCs of various industrial companies (Focus. 2017)
Company Industry WACC
Southern Company Utility 2.47%
Exelon Corp Utility 3.26%
ExxonMobil Corp Energy 7.13%
Chevron Corp Energy 9.99%
E. I. du Pont de Nemours and Co Chemical 14.95%
Dow Chemical Co Chemical 11.45%
2
NUCLEAR ENERGY ECONOMICS
Electricity grids are highly complex network of electricity suppliers and users. Any new nuclear capacity that is installed will compete and participate in markets that have varying types of generating facilities. Examination of this broad market and broad trends will lead to a better understanding of the role that nuclear energy must fulfil if nuclear energy will be part of the future energy mix.
2.1
REQUIRED CAPITAL COSTThe levelized cost of electricity (LCOE), see Section 1.2.2, is a commonly used criterion when comparing different electricity sources. If assumptions are made over the operations, fuel and maintenance costs and the expected lifetime of a power station then, for a set LCOE and discount rate, the capital cost can be back calculated from Equation (1) above. This section will determine a maximum allowable capital cost for current LWR and future Generation IV reactors in order to be competitive with coal-fired power stations and gas turbines.
2.1.1 Operations, Maintenance and Fuel Costs
Each year the U.S. Energy Information Administration publishes the average power plant operating expenses for major investor owned electric utilities. The power plants included are nuclear, fossil steam, hydroelectric and gas turbines. The operating expenses are broken down into operation, maintenance and fuel costs. The values from have been plotted below in Figure 2. There are four key takeaways from Figure 2;
* The operations costs for nuclear are double that of coal and quadruple that of gas * The nuclear maintenance costs are comparable to that of coal.
* The fuel costs of nuclear reactors are approximately a quarter of that of gas turbines and coal fired power stations
* The total operating expenses of nuclear power stations are approximately 69% and 77% of coal fired power stations and gas turbines respectively
40
35
30
25
20
15
10
5
0
Operation
Maintenance
Fuel
0 Nuclear N Fossil E Hydro
UGas
Total
Figure 2. Average Power Plant Operating Expenses /br Major US. Investor-Owned Electric Utilities in 2015 (EIA, Table 8.4. Average Power Plant Operating Expenses/fbr Major U.S. Investor-Owned Electric Utilities, 2005 through 2015 (Mills per
Kilowatthour). 2017)
These values will be used in the further analysis as the operating expenses for the different sources of electricity. Generation IV reactors generally claim to have different operating and maintenance expenses when compared to the current light water reactors. For further analysis, a low, medium and high factor will be applied to the LWR operating and maintenance costs to provide a potential range for Generation IV systems. The low, medium and high factors will be 0.8, 1.0 and 1.2 respectively, see Table 3.
Table 3. Estimated Operation and Maintenance Cost of Generation IV Reactors Operations and
Low Medium High
Maintenance Cases Factor 0.8 1.0 1.2 Generation IV Operation Cost 8.94 11.17 13.40 ($/MWh) Generation IV Maintenance Cost 5.65 7.06 8.47 ($/MWh) 20
The fuel costs for Generation IV reactors are able to be calculated with a higher confidence. The breakdown of the LWR fuel costs will be taken from Kim's paper on the cost of the nuclear fuel cycle, see Table 4 (Kim, 2015). These costs will be then modified to account for the enrichment and bum-up of Generation IV systems. It will be assumed that the fabrication and spent fuel costs will be the same for Generation IV systems as the LWR costs.
Table 4. Fuel cycle costs for PW R - Once Through -U02 Juel (Kin, 2015)
Process Cost ($/MWhe) Percentage (%) Weighted to EIA Cost ($/MWhe)
Uranium 3.07 37.05 2.77 Conversion 0.20 2.46 0.18 Enrichment 1.67 20.22 1.51 Fabrication 0.55 6.69 0.50 Spent Fuel 0.43 5.20 0.39 Transportation
Spent Fuel Storage 0.38 4.54 0.34
Spent Fuel Disposal 1.97 23.83 1.78
Total 8.28 100% 7.48
The uranium and conversion costs will be proportional to the amount of raw uranium required per unit of electricity. The amount of raw uranium required per unit of electricity will be a function of the bum-up, the enrichment and the thermal efficiency. As the bum-up and thermal efficiency increases the amount of raw uranium per unit electricity will go down while as the enrichment increases then so does the amount of raw uranium. The amount of raw uranium required for a nuclear reactor is proportional to;
1 1 Feed to Enrichment
F oc
- x x7th BurnUp Product from Enrichment
1 1 (x, - xt)
F
oc-xx
'th
BurnUp (xf - xt)Where F is the amount of raw uranium ore required for a reactor, 77th is the thermal efficiency, Burnup is the bumup of the reactor, xP is the reactor fuel enrichment, xt is the tailings enrichment and xf is the feed enrichment. The equation developed to compare the amount of raw uranium for a LWR compared to a Generation IV system is then given by;
FLWR _ (Xp,LWR - Xt ) (BurnUPGenIV (77th,GenIV FGenIV \Xp,Gen IV - Xt \ BurnUpLWR \ 1th,LWR /
The enrichment costs will be proportional to the required Separative Work Units (SWU) per unit of electricity produced. The SWU's will be proportional to;
1 1 SWUs
SWU oc - x x
qth BurnUp Unit of Product
1
1
xix-
Xt
SWU Oc x u x V(x) +
("
) V(xt) - - V(xf))77th BurnU p xf - xt xf - xt
Where SWU is the amount of SWUs required for a reactor, 77th is the thermal efficiency, Burnup is the burnup of the reactor, xP is the reactor fuel enrichment, xt is the tailings enrichment and xf is the feed enrichment and V(x) is a value function defined by;
1-x
V(x) = (1 - 2x) In
The relationship between the SWUs required for a LWR and a Generation IV system is then given by;
V(X LWR p,LWR - Xf t-(Xp,LWR ~tv(Xf))
SWULWR _ th,GenIV BurnUpGenIV Xf - Xt
)Xf
- XtSWUGenIV (Ith,LWR BurnUPLWR V(XpGenIV ,GenIV Xf) VXt (XpGenIV - Xt) V (Xf
These two ratios require the thermal efficiency, burnup and enrichment for LWR's and the Generation IV reactors. Certain assumptions have to be made for the tailings and feed enrichments. In this analysis it will be assumed that the enrichment of U-235 in the tailings and feed is 0.003 and 0.0072 respectively.
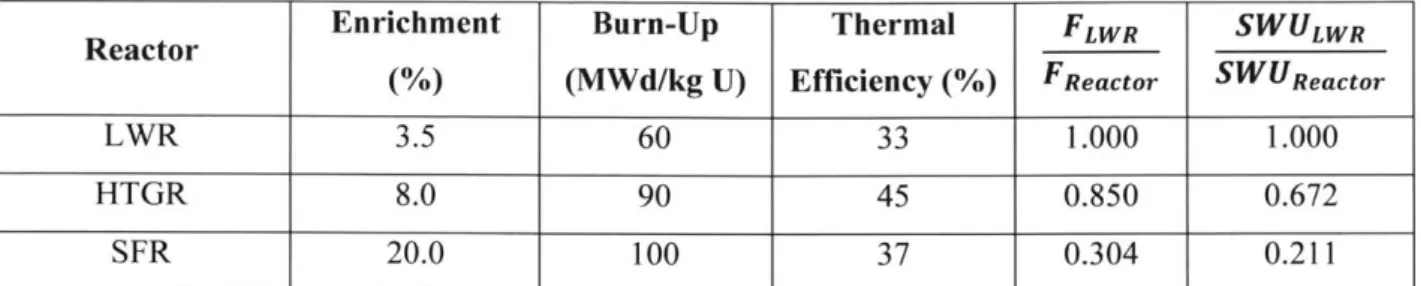
The raw uranium ratio and the SWU ratio will be calculated for two different Generation IV reactors. The High Temperature Gas Reactor (HTGR) and the Sodium Fast Reactor (SFR). It should be noted that one of the primary purposes for the SFR concept is for breeding fuel. The breeder reactor concept is a design that the nuclear reactor produces an equivalent, or more, amount of fuel than it consumes. The production
of the fissile material is by the transmutation of Uranium-238 to Plutonium-239 by neutron capture and subsequent beta decays. The reason that breeder reactors was initially considered was due to the apparent lack of natural uranium resources at the time. It is now known that there are ample natural uranium resources available and as such it will be assumed that the fuel is once-through, i.e. no reprocessing is
Table 5. Raw Uranium and SWU Ratiosfor L WR and Generation IV Reactors
Enrichment Burn-Up Thermal FLWR SWULWR
Reactor____
(%) (MWd/kg U) Efficiency (%) FReactor SWUReactor
LWR 3.5 60 33 1.000 1.000
HTGR 8.0 90 45 0.850 0.672
SFR 20.0 100 37 0.304 0.211
The raw uranium factor was applied to the Uranium and Conversion costs and the SWU factor was applied to the enrichment stage. All other costs for HTGR and SFR were assumed the same as a LWR. Table 6 outlines the final estimates for fuel costs for the HTGR and the SFR. Table 6 shows how the price of HTGR fuel is approximately 17% more than LWR fuel and the SFR fuel is approximately 2.7 times
higher than LWR fuel.
Table 6. Fuel Costs fbr Generation IV Reactors
Process LWR Weighted to HTGR Fuel Cost SFR Fuel Cost
EIA Cost ($/MWh) ($/MWh) ($/MWh)
Uranium 2.772 3.261 9.131
Conversion 0.184 0.217 0.607
Enrichment 1.513 2.253 7.173
Fabrication 0.501 0.501 0.501
Spent Fuel Transportation 0.389 0.389 0.389
Spent Fuel Storage 0.340 0.340 0.340
Spent Fuel Disposal 1.782 1.782 1.782
Total 7.480 8.741 19.922
Fraction of LWR 1.000 1.169 2.663
2.1.2 Assumptions
Other assumptions are required for this analysis to be completed. The system specific assumptions, lifetime and construction period, have been outlined in Table 7. The IAEA recommended discount rate of 3.5% will be used (IAEA, Discount Rate, 2016). The analysis will be completed assuming a LCOE of 60 $/MWh, this is approximately the estimated LCOE cost of an advanced combined-cycle natural gas plant entering operation in 2022 (EIA, Levelized Cost and Levelized Avoided Cost of New Generation
Resources in the Annual Energy Outlook 2017, 2017). Included in the analysis will be the effect of extending the construction of a LWR to 10 years to determine the effect of delays on the limit for the total
Table 7. System Specific Assumptions
System Lifetime (years) Construction Period (years)
Gas Turbine 20 2
Coal Fired Power Station 40 4
LWR Nuclear 60 6
Generation IV Nuclear 60 6
2.1.3 Analysis
Using the above assumptions and input three cases were calculated, the O&M low case, medium case and high case. The results from these three cases are shown in Figure 3, Figure 4 and Figure 5 respectively.
The lower total operating costs of LWRs compared to natural gas and coal lead to a higher base capital cost available, approximately 6,900 $/kW for LWR compared to 4,000 $/kW for coal and 3,300 $/kW for gas turbines. Due to the higher fuel costs associated with the HTGR and SFR fuel the maximum available capital is lower than that of the LWR, except for the low operating cost HTGR case.
In Figure 3 the effect of extending the construction period from 6 years to 10 years for a LWR is shown. It shows that by extending the construction from 6 years to 10 years decreases the available capital from 6,864 $/kW to 6,387 $/kW, a decrease of 477 $/kW. There is a clear decrease in the available capital due to longer projects due to the effect of the discount rate. If the discount rate is increased, then the effect of project length would have a more dramatic effect. The full effect from a project ranging from 5 to 10 years is shown in Table 8.
Table 8. Effect of Construction Period on Available Capital
Construction Period Available Capital Difference from 6-year Construction Period
(years) ($/kW) ($/kW) 5 6,986 122 6 6,864 0 7 6,742 -122 8 6,622 -242 9 6,504 -360 10 6,387 -477
The major takeaway from this analysis is the strength of nuclear power reactors is their low operating cost. This low operating cost allows for the construction of capital intensive plants while maintaining a
similar LCOE to natural gas and coal plants. If Generation IV reactors are to have more expensive fuel, and in turn higher operating cost, then they will have to counteract this with a lower capital cost designs. The benefits of minimizing the total operating cost of new nuclear power plants may be substantial in releasing additional available capital. For example, using the above assumptions for the LWR every 1 $/kWhr reduction in the total operating cost would contribute approximately an additional 200 $/kW to the maximum allowable total capital cost.
Please note that in Figure 3 (Low O&M Case), Figure 4 (Medium O&M Case) and Figure 5 (High O&M Case) the ovals around LWR, fossil steam and gas turbines represent 10% of the relevant value.
Low Case
8000
6000
U (U4000k
2000
0
2.4
2.6
2.8
3.0
3.2
3.4
3.6
3.8
Operating Cost (c/kWhr)
Figure 3. O& A Low Case with LCOE o160 $iMWhr
lclear
- 10 Year Construction
SFR
Medium Case
Fossil
Steam.
3.0
3.2
3.4
3.6
Operating Cost (c/kWhr)
Figure 4. O&M Medium Case with LCOE o/6( $ i'hr
High Case
Fossil Steam
3.5
Operating Cost (c/kWhr)
Figure 5. O&M high Case with LCOE o/60 $/AIJ'Vhr
-j
7000
6000
5000
4000
3000
2000
Ile 0SFR
91000
0
2.6
2.8
3.8
.HTGR
7000
6000
5000
4000
3000
2000
1000-('3 0 (U (U
SFR
0
3.0
4.0
2.2 ENERGY RETURN ON ENERGY INVESTED
The energy required to produce energy has been increasing over time as the easily extracted energy is used up. For example, as the conventional oil wells are depleted increased production of the energy
intensive tar sands is increasing. This concept, known as the energy return on energy invested (EROEI), will be examined and is given mathematically by;
ER OF! = Energy Delivered
Energy Required to Deliver Energy
The EROEI is an important concept as it determines the energy feasibility of different fuel and energy sources with experts predicting that a minimum sustainable EROEI is approximately 7 for advanced economies. WeiBbach published a full review of EROEI of different technologies including nuclear. A major factor in accurately determining the EROEI for nuclear was the method of enrichment. Two values were determined in WeiBbach's review, a EROEI of 75 and a EROEI of 105 (WeiBbach, et al., 2013). The higher EROEI of 105 represents a system that is using solely centrifuge enrichment technology while the lower EROEI system represents a system with 80% centrifuge and 20% diffusion based enrichment. With all the gaseous diffusion plant having been shut down and decommissioned in the United States this improves the energy economics of nuclear (NRC, 2017). The EROEI value of 105 is shown in Figure 6 along with the EROEI of other fuel sources. Figure 6 also demonstrates why a minimum EROEI of 7 is required. There is a clear energy cliff where for a low EROEI the majority of your energy is used to simply produce the delivered energy. Nuclear having a high EROEI shows clearly that, in terms of an energy Life-Cycle Analysis, that is an energy sustainable source of electricity.
-o 100 ydro Nucleqr Economic Limit w 80 Bi ass (Com) 0 - 40 40. 0 --'0 20 40 60 80 100 EROEI
Figure 6. E ROEI Energv Clif1 (Weilpbach, et al.. 2013)
2.3
COST INDEXING FOR NUCLEAR REACTORSA major issue in cost estimation is bringing previous cost estimation to today costs. This is done by the use of cost indexes. Cost indexes take standards year to year and then compare them to modify a cost;
Cost in Year Y Index in Year Y Cost in Year X Index in Year X
The most commonly used method for cost indexing is inflation. Inflation is based off the consumer price index (CPI) between different points in time. The CPI is based off goods and services from eight major groups; Food and beverages, housing, apparel, transportation, medical care, recreation, education and communication and other goods and services. Due to the broad range of products used to develop the CPI it may not be the most applicable metric for cost indexing in the nuclear industry.
An examination of other potential cost indexes will be used to determine a potential optimal cost indexing strategy for nuclear components. It should be noted that cost indexes are typically produced and published by consulting companies or industry-funded research organizations. This leads to the potential for some indexes to be behind paywalls.
Four different cost indexes were examined; Nelson-Farrar (NF), Chemical Engineering Plant Cost Index (CEPCI), Engineering News Record Construction Cost Index (ENRCCI) and Power Capital Cost Index (PCCI).
Nelson-Farrar Indexes are published in the Oil and Gas journal and are used for refineries and petrochemical plants. The Chemical Engineering Plant Cost Index is published by Chemical Engineering and is comprised of a four sub-indexes; Equipment, Construction Labor, Buildings and Engineering & Supervision. The CEPCI is used for adjusting process plant construction costs. The Engineering News Record Construction Cost Index is an index published by ENR and is based off a set number of man-hours along with structural steel, concrete and lumber. The Power Capital Cost Index is a proprietary cost index produced by CERA IHS. It is used to index costs based off coal, gas, wind and nuclear power plants. The PCCI is provided both with and without nuclear.
Due to the use of indexes the values can range significantly dependent upon the indexing year, i.e. NF in 2014 is 2555 while the PCCI is 227 in 2014. Due to this effect the different cost indices were divided by their previous year's value. This will show the actual change in value from year to year, see Figure 7. Figure 7 shows that most indexes hover around the 3% change per year.
1.4000 -,~~C'~4.J'NAL~ --CPI Inflation -Nelson-Farrar -- 3% -- CE -ENRCCI -PCCI
-PCCI without Nuclear
1980 1985 1990 1995 2000 2005 2010 2015 2020
Year
Figure 7. Cost Indexes
1.3000 1.2000 1.1000 1.0000 I" 0 cc E 0.9000 0.8000 1 1975
Of particular interest is the PCCI as this directly measures power plants. The PCCI index is proprietary and as such the knowledge of what forms the index is unknown. The PCCI index both with and without nuclear is shown in Figure 8. Figure 8 shows that there is a massive spike in the cost of nuclear between 2006 and 2008. This is roughly the same time as the beginning of the nuclear renaissance and when Toshiba purchased Westinghouse. This confidence in the nuclear sector may have led to 23.5% increase in the index. Nuclear only forms part of the index and as such when compared to the PCCI - without Nuclear it is clear that the costs in the nuclear industry must have risen a higher percentage than the index.
260 240 220 200
180
--
PCCI
-With Nuclear160 --- PCCI -Without 140 -Nuclear 120 - - --100 2000 2005 2010 2015 Year
Figure 8. PCCI Cost Index
While Figure 7 shows the indexes oscillating around 3% they may lead to different outcomes when used for cost manipulation over long time periods. Take for example a reactor that cost $2,500 in 1980 and $2,500 in 2000, what would they cost in 2014? Table 9 shows what it would cost in 2014 using the different cost indexes discussed above. Table 9 shows that the indexes result in a broad range of
predictions for the new cost with standard deviations of $892 from 1980 to 2014 and $799 from the 2000 to 2014. Of particular note is the difference between the PCCI and the CPI from the year 2000 to 2014. The CPI predicts an increase of 37.5% where the PCCI predicts and increase of 130.5%. This is a massive difference caused primarily by the increase of costs in the PCCI in the 2006 to 2008 period. This shows that if CPI is used for the difference in cost between years that it may introduce significant errors to the cost estimation.
Table 9. 2.500 $/kW in Years 1980 and 2000 in 2014 Dollars Index 2,500 $/kW 1980 to $/kW 2014 2,500 $/kW 2000 to $/kW 2014 CPI Inflation 7183 3437 Nelson-Farrar 7764 4141 3% 6830 3781 CE 5514 3655 ENRCCI j75 7 4 3941 Average 6973 4204 Standard Deviation 892 799
2.3.1 Five Year Rule
Of particular importance is the use of cost escalation over extended periods. Due to the long time frames and lack of continual construction, real-world nuclear cost information and detailed cost studies are generally old (5+ years), if even available at all. In industry it is recommended to observe the five-year rule (Vatavuk, 2002). The five-year rule is a rule of thumb which limits the use of cost escalation to five years. The reason for this is because over time periods of less than five years the error between actual equipment and labor and the cost escalated estimate have been small relative to most budget-level estimates (h 20 to 30%). Over five years these deviations become much larger. Reasons for these deviations include:
- Inherent process changes
- Health, safety and environmental changes
- Escalation of different components at different rates
Due to these issues it is recommended only to use cost escalation up to five years as the error in the escalation may become significant.
2.4 RESEARCH AND DEVELOPMENT INVESTMENT
It is commonly accepted that the development costs of Generation IV reactors are going to be significant investments for either the government or private capital. The question becomes whether the current established nuclear industry has the available expendable income to fully develop a Generation IV reactor
investigated the research and development (R&D) spending of the 1000 top worldwide publically traded companies. An outline of the percentage of R&D of the revenue for these companies broken down by industry is shown in Table 10. The industry sectors of note are in bold. These sectors; Industrials, Energy and Utilities, all spend a low percentage of their revenue on R&D when compared to the Technology, Information Technology and Healthcare sectors. This is presumably due to the lower margins associated with noted industries.
Table 10. R&D Spending by Industry (PwC, 2018)
Industry sector Total R&D Expense Total Revenue Percentage of R&D of
(USD Billion) (USD Billion) Revenue
Consumer 148.75 3393.83 4.38 Discretionary Information 230.33 2552.80 9.02 Technology Healthcare 161.29 1426.62 11.31 Industrials 84.02 2649.45 3.17 Financials 6.57 197.59 3.33 Telecommunication 10.12 713.77 1.42 Services Materials 29.79 1213.26 2.45 Consumer Staples 14.60 1038.21 1.41 Energy 10.79 1936.11 0.56 Communications 1.81 48.22 3.75 Utilities 2.49 374.20 0.67 Technology 0.17 3.03 5.56 Consumer, Non- 0.32 57.56 0.56 cyclical Industrial 0.23 2.96 7.79 Basic Materials 0.11 14.76 0.73 Financial 0.11 7.14 1.47 Consumer, Cyclical 0.10 10.38 0.94
Two major companies that are involved in the nuclear industry are Areva SA and Westinghouse. Areva is directly on the list of companies. Westinghouse however is a subsidiary of Toshiba, the Japanese
conglomerate. Toshiba is itself on the list, however, the R&D and revenue figures are a function of all of 32
its business assets. An assumption will be made on the fraction of R&D and revenue attributed to Westinghouse directly. In 2014 Toshiba spent 64.7 billion yen on their Energy & Infrastructure R&D, equivalent to 19.7% of their total. The Toshiba Energy and Infrastructure R&D includes a lot of non-nuclear related areas however in this analysis we will assume that all 19.7% of R&D funding is spent by Westinghouse on nuclear related topics. An estimate of the total nuclear related R&D funding by Areva and Westinghouse can then be determined. See Table 11 for the results of this analysis.
Table 11. R&D Expensesfor Areva and Toshiba in 2014
Total R&D Total Nuclear
Percentage Nuclear
Expense Revenue Weighted
Company (USD of R&D of Percentage Total R&D
Revenue of R&D
Billion) Billion) Expense
Areva SA 0.29 9.57 3.01 100 0.29
Toshiba/Westinghouse 2.67 51.24 5.21 19.7 0.53
While hotly debated, the development cost of a Generation IV reactor system is unknown. The SEAB Report of the Task Force on the Future of Nuclear Power estimates that such development would require approximately 11.5 billion dollars' for the full project, with 8.5 billion dollars required before the First-of-a-Kind (FOAK) power plant. Examining the current R&D expense of Areva and Westinghouse it shows that it would require approximately 29 and 16 years to reach the required development. This is not to mention that 100% of the R&D budget would be sunk into a singular project.
This analysis would suggest that it is highly unlikely for the current nuclear industry to develop a
Generation IV reactor organically. As such either significant government or private capital support would be required. Whether private capital would be willing to support a project to an expense of 8.5 billion dollars pre-revenue is another question but it is highly unlikely unless philanthropic investment is involved. As such in order for Generation IV systems to succeed then significant government support is required. The balance of private and public funding will be the focus of much future discussion.
2.5 EFFECT OF UNCERTAINTY ON CASH FLOW
Section 2.3 touched on the uncertainty involved with cost estimation. This section will examine the effect of uncertainty in costing information on the cash flow of a nuclear power plant. It should be noted that this is to show broad trends and not specific information. As such some details of the cash flow
calculation have been omitted, e.g. working capital, taxes and start-up. Some constant values that will be used for all calculations are listed in Table 12.
Table 12. Constant Parameters for Cash Flow Calculations
Parameter Value Units
Size of Reactor 1000 MW
Construction Period 6 years
Operating Period 60 years
Capacity Factor 0.92
Price of Electricity 36.14 $/MWh
Operating Cost of Nuclear Power 11.17 $/MWh
Plant
Note that the price of electricity is the average wholesale price of electricity in the United States in 2015 and the operating cost using the information shown in Section 2.1.
2.5.1 Discount Rate
The first factor that will be assessed is how the uncertainty in the discount rate can affect the cash flow. Using the above assumptions Figure 9 was developed. It shows a 5000 $/kW reactor with three different discount rates; the IAEA recommended discount rate, discount rate such that the break-even point is at the end of life and using the WACC for Southern Company. This shows clearly that any nuclear project will have a long payback period with the Southern Company WACC only reaching break-even point after 43 years.
A difference of approximately 1% in the discount rate has a difference in net present value of $1.2 billion at the end of the project. Considering the length of this project and required capital this would be
considered an unattractive investment by many investors. The Break-Even Point at Life of Plant, also known as the Internal Rate of Return (IRR) is only 3.27%. There are very few companies with cost of
capital being lower than this IRR, luckily Southern Company is one such company. From examination above, Table 2, it is clear that companies like ExxonMobil and Dow would never be able to undertake the ownership of a nuclear power plant due to their higher costs of capital.
1.0
0.0
-1.0
-20 - IAEA Recommended
Discount Rate -3.5%
-3.0 -- Break-Even Point at Life
of Plant -3.27%
-4.0
-
Southern Company-5.0
WACC - 2.47%
a
-6.0
0
20
40
60
Time (Years)
Figure 9. Cumulative Discounted Cash Flow fbr varving Discount Rate
2.5.2
Capital Cost
As mentioned above cost estimation is highly dependent on current, relevant experience. If projects start to go over-budget due to inexperience and poor scoping, then this can lead to serious effects on the cash
flow. In the example shown below, Figure 10, only a 17.7% increase in the cost of the nuclear power plant would lead to a negative net present value at the end of the project. Going 10% over budget would
lead to an extra 8 years until the break-even point is reached.
Clearly this is a simplistic and structured example but it shows clearly that any uncertainty, even as low as +20%, can lead to serious effects on the entire budget. These effects are caused by the large capital outlay
coupled to the relatively low revenue. A potential implication of this analysis is that capital intensive electricity projects, either nuclear or integrated gasification combined cycle (IGCC), is only sensible in markets where the cost of the project can be guaranteed to be recovered, i.e. in regulated markets. This
implication is supported by the fact that the only recent nuclear construction projects have been in
regulated markets (SCANA and Southern Company) with the only IGCC project also being in a regulated market (Southern Company).
It should be known that the discount rate in this example is the same as the Southern Company WACC, 2.47%.
0
CU
Q 0 -Cu 20 40Time (Years)
60Figure 10. Cumulative Discount Cash Flow for varving Capital Cost
3
GENERATION
II
REACTORS
Generation II reactors were built extensively in the United States during the 1970's and 80's. The current operational US fleet is comprised exclusively of Generation II reactors. Common Generation II reactors around the world include the LWR-PWR/BWR, VVER and CANDU designs. The economics of Generation II reactors will be used as a baseline for comparison to the newer Generation III+ reactors currently being installed. Investigation into the overall economics and breakdown of plant costs has been completed below.
3.1 GENERATION
II REACTOR COSTS
Extensive work has been completed on the costs of nuclear reactors in the past and why the costs of said reactors escalated out of control. This report will not attempt to analyze why the cost of nuclear reactor skyrocketed, however, it will organize the conclusions and output from other reports that will give insight relevant to the Generation III+ reactors.
Figure 11 and Figure 12 show the overnight cost of nuclear power plants in the United States, sorted by either date of construction start or the construction duration (Lovering, Yip, & Nordhaus, 2016). It is clear that there are two times of interest, pre- and post-Three Mile Island accident (TMI). The Three Mile Island accident was a loss-of-coolant accident at Unit 2 at the Three Mile Island Nuclear Generating
36 0
1.0
0.0
-1.0
-2.0
-3.0
-4.0
-5.0
-6.0
-7.0
-8.0
5000 $/kW
-
0%
Overbudget-5500
$/kW
-
10%
Overbudget-7500
$/kW
-
50%
Overbudget-
5887 $/kW
-
17.7%
Overbudget 0Station in Pennsylvania in 1979. This accident led to reformation in the nuclear industry and increased regulation from the Nuclear Regulatory Commission (NRC). The major takeaways from Figure 11 and Figure 12 is that pre-TMI the overnight cost ranged from 800 to 2,500 $2010/kW and post-TMI the overnight cost ranged from 2,000 to 8,000 $20 10/kW.
11O -10000 -emo -.. 7000 4000. ..0 0 em00-
-~
9. 8 oj, a00 100 0-a 0 C 0 0 0 0 . 30 1950 1i0 1970 1960Dat of Construcion Start
-1 0 Demanufron Sb *M)a500 C) TUriMY
Sime (MW) o o looo 1000 Ers a 0 Compwtsd ~bf butte Tee heFI a ite sWl eaddent0*
o
1300 0 Completed after Three mes letend accidentFigure 11. Overnight Construction Cost of Nuclear Power Plants by Date of Construction (Lovering, Yip, & Nordhaus, 2016)