Dendritic biophysics and evolution by
Lou Beaulieu-Laroche B.Sc., McGill University (2015)
Submitted to the Department of Brain and Cognitive Sciences in Partial Fulfillment of the Requirements for the Degree of
DOCTOR OF PHILOSOPHY IN NEUROSCIENCE at the
MASSACHUSETTS INSTITUTE OF TECHNOLOGY February 2021
©2020 Massachusetts Institute of Technology. All rights reserved.
Authored by ______________________ Department of Brain and Cognitive Sciences
January 6, 2021
Certified by ______________________ Mark Harnett
Associate Professor of Neuroscience Thesis Supervisor
Accepted by ______________________ Rebecca Saxe
John W. Jarve (1978) Professor of Brain and Cognitive Sciences Associate Head, Department of Brain and Cognitive Sciences
Dendritic biophysics and evolution
byLou Beaulieu-Laroche
Submitted to the Department of Brain and Cognitive Sciences on January 6, 2021 in Partial Fulfillment of the Requirements for the Degree of
DOCTOR OF PHILOSOPHY IN NEUROSCIENCE
Abstract
The biophysical features of neurons are the building blocks of computation in the brain. Dendrites are the physical site of the vast majority of synaptic connections and can expand the information processing capabilities of neurons. Due to their complex morphological attributes and various ion channels, dendrites shape how thousands of inputs are integrated into behaviorally-relevant outputs at the level of individual neurons. However, several long-standing issues limit our understanding of dendritic biophysics. In addition to distorted electrophysiological measurements, prior studies have largely been limited to ex vivo preparations from rodent animal models, providing little insight for computation in the awake human brain. In this thesis, we overcome these limitations to provide new insights on biophysics at the intersection of dendritic morphology and evolution. In chapter 1, we demonstrate that voltage-clamp analysis, which was employed to derive much of our understanding of synaptic transmission, is incompatible with most synapses because they reside on electrically-compartmentalized spines. We also develop new approaches to provide accurate measurements of synaptic strength. Then, in chapter 2, we directly correlate somatic and distal dendritic activity in the awake mouse visual cortex to show an unexpectedly high degree of coupling in vivo. In chapter 3, we perform dendritic recordings in large human neurons to reveal distinct integrative properties from commonly studied rat neurons. Finally, in chapter 4, we characterize neurons in 10 mammalian species to extract evolutionary rules governing neuronal biophysics and uncover human specializations. Together, these four thesis projects expand our understanding of the influence of dendritic geometry and evolution on neuronal biophysics.
Thesis Supervisor: Mark Harnett
Acknowledgements
I want to start by thanking my thesis advisor, Prof. Mark Harnett, for taking me as his first graduate student, for teaching me how to patch dendrites, and for providing support and guidance
throughout my PhD.
I would like to acknowledge the rest of my thesis committee, Prof. Michale Fee, Prof. Mriganka Sur, and Prof. Sydney Cash for their constructive advice and insightful comments. I also thank
Prof. Troy Littleton who was a member of my qualifying exam committee.
This thesis would not have been possible without the help of four research technicians who I have had the chance to work with and befriend: Norma Brown, Marissa Hansen, Quique Toloza,
and Derrick Barnagian.
Finally, I want to thank my parents, Renée Beaulieu and Marc Laroche, as well as my two sisters, Marie-Rose and Charlie Beaulieu-Laroche, for their love and support.
Table of contents
Chapter 1. Introduction 6
1.1 Electrical compartmentalization 6
1.2 Dendritic spine biophysics 9
1.3 Contribution of dendrites to visual processing 11
1.4 Evolution of neuronal biophysics 13
Chapter 2. Dendritic spines prevent synaptic voltage-clamp 15
2.1 Introduction 15 2.2 Results 16 2.3 Discussion 21 2.4 Methods 24 2.5 Figures 32 2.6 Supplementary figures 39
Chapter 3. Widespread and highly correlated somato-dendritic activity 51 in cortical layer 5 neurons
3.1 Introduction 51 3.2 Results 52 3.3 Discussion 56 3.4 Methods 57 3.5 Figures 65 3.6 Supplementary figures 73
Chapter 4. Enhanced dendritic compartmentalization in human cortical neurons 81 4.1 Introduction 81 4.2 Results 82 4.3 Discussion 89 4.4 Methods 91 4.5 Figures 100 4.6 Supplementary figures 112 4.7 Supplementary tables 127
Chapter 5. Allometric rules for cortical neuron biophysics 131
5.1 Introduction 131 5.2 Results 132 5.3 Discussion 139 5.4 Methods 142 5.5 Figures 156 5.6 Supplementary figures 164 5.7 Supplementary tables 178
Chapter 6. Conclusions and future directions 186
Chapter 1. Introduction
Neurons express themselves electrically. They communicate with one another at specialized sites called synapses. The cell body or soma of neurons sends signals to nearby and distant neurons through the axon. Synaptic inputs distributed along complex dendritic trees must ultimately influence the axon to effect changes in activity. The complex and nonlinear electrical properties of dendrites control this input-output transformation and, as such, play a central role in shaping information processing in the brain. The morphology of dendrites, i.e., the girth and length of these cylindrical antennas, provides the first simple layer of processing. Currents mediated by ion channel proteins add an additional highly nonlinear layer of processing. These currents, which typically open or close in response to specific voltages or stimuli, can amplify and dampen electrical signals. Morphological and ionic mechanisms together govern the biophysical features of neurons, but they are incompletely understood. Interestingly, morphology is not conserved across species, with human neurons having very large dendritic trees. However, how ion channels and biophysical features vary across species is virtually unexplored. In this thesis, I evaluate neuronal biophysics at the intersection of dendritic geometry and evolution.
1.1 Electrical compartmentalization
A key feature of dendritic processing is electrical compartmentalization. Because of the cable properties of dendrites, electrical signals get smaller and slower as they propagate from one point in space to another (Rall et al., 1995; Williams, 2004; Williams and Stuart, 2002). This filtering causes synaptic inputs to strongly attenuate as they propagate towards the soma, such that more distal inputs have a weaker influence. This electrical compartmentalization occurs at different scales (Hausser and Mel, 2003). Considering a whole neuron, different sections of the
dendritic tree, for instance apical and basal dendrites, are electrically isolated. Individual dendritic branches also exhibit compartmentalization, and even segments of an individual dendrite can be electrically independent. Finally, dendritic spines, small dendritic protrusions where synapses reside, are also compartmentalized from adjacent dendrites.
In addition to distance-dependent electrical filtering, (Rall et al., 1995; Williams, 2004; Williams and Stuart, 2002), dendrites possess numerous voltage-activated ion channels that can either enhance filtering or boost local dendritic signals (Harnett et al., 2015; Harnett et al., 2013; Johnston et al., 1996; Kole et al., 2006; Larkum et al., 2009; Larkum and Zhu, 2002; Losonczy and Magee, 2006; Magee, 1998, 1999, 2000; Magee and Johnston, 1995; Major et al., 2013; Nevian et al., 2007; Schiller et al., 2000; Schiller et al., 1997; Sivyer and Williams, 2013; Spruston, 2008). While often correlated, the amplitude and shape of the signals in distinct compartments can vary substantially, and result in non-uniform voltage waveforms across the neuron. Compartmentalization is believed to be important because it endows individual neurons with the ability to perform subcellular computations (e.g. coincidence detection, pattern recognition, and logical operations). Theoretical studies have suggested that electrical compartmentalization produces semi-independent computational subunits that can perform key operations on their inputs (Behabadi and Mel, 2014; Hausser and Mel, 2003; Jadi et al., 2014; London and Hausser, 2005; Major et al., 2013; Poirazi et al., 2003; Polsky et al., 2004; Spruston, 2008). This compartmentalization could effectively enhance the computational power of individual neurons (Jadi et al., 2014; Polsky et al., 2004). By creating multiple subcellular computational units, compartmentalization can turn single neurons into small networks (Behabadi and Mel, 2014; Hausser and Mel, 2003; Jadi et al., 2014; London and Hausser, 2005; Major et al., 2013; Poirazi et al., 2003; Polsky et al., 2004; Rall et al., 1995; Spruston, 2008). Thus, different subcellular
compartments can experience distinct voltage waveforms simultaneously and potentially perform independent operations.
Based on theoretical analyses, dendritic compartmentalization could enable individual neurons to produce more selective outputs, but experimental evidence is still lacking. Electrical compartmentalization results from morphological and ionic mechanisms that are incompletely understood and very challenging to perturb. To gain insights into the contribution of dendritic compartments to neural computation, scientists have assayed dendritic activity in vivo. In the last decade, imaging and recording techniques have shown that dendritic activity can be correlated with behaviorally-relevant features (Cichon and Gan, 2015; Harnett et al., 2013; Lavzin et al., 2012; Sheffield and Dombeck, 2015; Sivyer and Williams, 2013; Smith et al., 2013; Takahashi et al., 2016; Xu et al., 2012). However, the relationship between dendritic and somatic activity is unclear, precluding an assessment of dendritic independence. In addition, accruing efforts aim to disrupt dendritic processing but manipulating dendritic properties in a specific and interpretable way has proven very difficult. Optogenetic actuation has been targeted to distal dendrites (Takahashi et al., 2016). By grossly activating or inhibiting apical dendrites, perceptual detection thresholds for whisker deflections were affected, but similar results might be expected by inhibiting somatic or other dendritic compartments. Disrupting morphology has so far been restricted to physically cutting dendritic branches (Cichon and Gan, 2015), providing little insight. Finally, ion channels controlling dendritic function can be disrupted but previous experiments lacked specificity. Several studies employed intracellular blockade of NMDA receptors to probe the contribution of NMDA-dependent nonlinearities (Cichon and Gan, 2015; Lavzin et al., 2012; Smith et al., 2013), but blocking an essential neurotransmitter in the entire cell prevents an analysis of the role of dendrites. Transgenic animals have been used to delete ion channels affecting
dendritic integration. For instance, hyperpolarization-activated cyclic nucleotide–gated (HCN) knockout animals have been generated (Giocomo et al., 2011; Hussaini et al., 2011; Nolan et al., 2003). HCN channels are enriched in distal dendrites, but are also present in somatic compartments and in many cell types. The manipulation was not specific to dendrites within individual cells, had circuit-wide effects and developmental issues, thus preventing a clear dissection of the role of HCN in dendritic function. In summary, past research efforts have fallen short of establishing a causal role between dendritic biophysics and neuronal function due to an inability to manipulate or at least correlate biophysical features with neuronal computations.
1.2 Dendritic spine biophysics
Dendritic spines are the main site of excitatory synapses in the mammalian brain (Bourne and Harris, 2008). Their ubiquity as well as their abnormal features in various pathological conditions, including autism spectrum disorders, schizophrenia and Alzheimer’s disease (Baloyannis et al., 1992; Fiala et al., 2002; Halpain et al., 2005; Hutsler and Zhang, 2010; Irwin et al., 2001; Kaufmann and Moser, 2000; Martinez-Cerdeno, 2017; Peca et al., 2011; Penzes et al., 2011; Roberts et al., 1996; Selkoe, 2002; Sheng et al., 2012; Sudhof, 2008), suggest they are important for proper brain function. In addition to their well-established role in structural plasticity (Bailey et al., 2015; Bhatt et al., 2009; Frost et al., 2010; George et al., 2015; Hering and Sheng, 2001; Nishiyama and Yasuda, 2015; Sala and Segal, 2014) and biochemical signaling (Bourne and Harris, 2008; Colgan and Yasuda, 2014; Guthrie et al., 1991; Muller and Connor, 1991; Nishiyama and Yasuda, 2015; Yuste and Denk, 1995), spines have been proposed to play an electrical role (Araya et al., 2006; Bloodgood et al., 2009; Bloodgood and Sabatini, 2005; Grunditz et al., 2008; Harnett et al., 2012; Harris and Stevens, 1989; Jayant et al., 2017; Koch and Poggio, 1983; Miller
et al., 1985; Palmer and Stuart, 2009; Wilson, 1984; Yuste, 2013). Converging theoretical and experimental evidence indicate that spines can electrically compartmentalize signals from their parent dendrites via a high electrical resistance in the spine neck (Acker et al., 2016; Araya, 2014; Araya et al., 2006; Araya et al., 2014; Bloodgood et al., 2009; Bloodgood and Sabatini, 2005; Grunditz et al., 2008; Harnett et al., 2012; Jayant et al., 2017; Palmer and Stuart, 2009; Svoboda et al., 1996; Tonnesen et al., 2014; Tsay and Yuste, 2004; Yuste, 2013). As a consequence, individual synaptic inputs produce large depolarizations in spines (tens of mV) that attenuate substantially before reaching the dendrites. However, it is unclear how the electrical properties of spines influence synaptic function and plasticity. Essential parameters governing spine function, such as synaptic conductance, which reflects the number and properties of glutamate receptors, have been impossible to measure precisely at single spines (Araya, 2014). These uncertainties contribute to contentious debates in the field regarding the degree to which spines are isolated from parent dendrites (Acker et al., 2016; Araya et al., 2014; Bloodgood et al., 2009; Bloodgood and Sabatini, 2005; Grunditz et al., 2008; Harnett et al., 2012; Harris and Stevens, 1989; Jayant et al., 2017; Koch and Poggio, 1983; Palmer and Stuart, 2009; Popovic et al., 2015; Svoboda et al., 1996; Tonnesen et al., 2014; Wilson, 1984; Yuste, 2013).
For over thirty years, voltage-clamp has been the premier physiological technique to investigate synapses (Bekkers et al., 1990; Bekkers and Stevens, 1990; Blanton et al., 1989; Brown and Johnston, 1983; Herring and Nicoll, 2016; Isaac et al., 1995; Malenka, 2003; Malenka and Bear, 2004; Malinow and Malenka, 2002; Malinow and Tsien, 1990; Nicoll and Roche, 2013; Stevens, 2003, 2004; Sudhof, 2013). By clamping the voltage, synaptic currents and their associated conductances can be measured and compared. Despite its widespread usage, the limitations of voltage-clamp analysis have been given limited attention (Bar-Yehuda and
Korngreen, 2008; Johnston and Brown, 1983; Poleg-Polsky and Diamond, 2011; Spruston et al., 1993; Williams and Mitchell, 2008). One crucial requirement for accurate voltage-clamp analysis is that synapses are isopotential with the recording site. Electrical compartmentalization is inconsistent with compartments being isopotential. Consequently distal dendrites whose signals get filtered before they reach the cell body cannot effectively be voltage-clamped at the cell body (Spruston et al., 1993; Williams and Mitchell, 2008). Due to the electrical compartmentalization of dendritic spines, synapses may not be isopotential with voltage-clamp recording sites in dendritic or somatic compartments, meaning that spine depolarization is not visible to the voltage-clamp and therefore not controlled. In chapter 1, we evaluate the possibility that electrically-isolated spines are incompatible with voltage-clamp analysis.
1.3 Contribution of dendrites to visual processing
Orientation selectivity is one of the most studied neuronal computation, but remains incompletely understood. Cortical neurons in the primary visual cortex (V1) receive tuned inputs from the thalamus and other cortical neurons, but their output is not solely determined by their inputs. The processes generating or sharpening orientation tuning in visual cortical neurons can be grouped in three categories: input tuning, circuit dynamics and cellular transformation. Local circuit dynamics refer to inhibitory feedback or feedforward dynamics and neuromodulatory influence, while cellular transformation depends on biophysical mechanisms shaping single-cell input-output transformation. One key biophysical feature of V1 neurons that contribute to orientation selectivity is the spike threshold. The spike threshold adds a nonlinear filtering stage between the synaptic inputs and the action potential output of a neuron. Weak (subthreshold) inputs elicit no action potentials, while suprathreshold inputs elicit a graded number of spikes. It was
hypothesized and later experimentally shown that spike tuning is sharper than membrane potential depolarization at the soma (Carandini and Ferster, 2000; Ferster and Miller, 2000; Hubel and Wiesel, 1962; Priebe and Ferster; Scholl et al., 2013). Thus, the nonlinear transformation from EPSPs to spikes can sharpen tuning. Dendritic nonlinearities, such as dendritic spike generation, could contribute to tuning in a similar fashion as the spike threshold. Indeed, the generation of NMDA spikes in basal dendrites (Branco et al., 2010; Wilson et al., 2016) or sodium-calcium spikes in apical dendrites (Shai et al., 2015; Smith et al., 2013) have been proposed to sharpen orientation tuning. Compartmentalized dendritic processing that filters weak inputs, but amplifies strong inputs through local spike generation could add a nonlinear sigmoidal transformation between synaptic inputs and somatic spike generation.
Dendritic nonlinearities can only be effective on inputs with certain tuning or spatiotemporal patterns. Simple spike threshold or sigmoidal dendritic transformation can sharpen globally tuned inputs, but will broaden or not transform globally untuned inputs. However, if the inputs are functionally clustered, dendritic nonlinearities can detect spatiotemporal clusters and amplify these, contributing to output tuning (Druckmann et al.; Polsky et al., 2004; Wilson et al., 2016). How are inputs to V1 tuned and clustered? This issue continues to generate excitement and is unsettled. Two main approaches have been used to assess input tuning: electrophysiology and two-photon imaging. In vivo electrophysiology has been used to measure the tuning of excitatory and inhibitory inputs to neurons (Anderson et al., 2000; Borg-Graham et al., 1998; Chadderton et al., 2014; Haider et al., 2006; Haider et al., 2013; Haider et al., 2016; Petersen; Sato et al., 2016). However, voltage-clamp issues (Williams and Mitchell, 2008) prevent an accurate depiction of excitatory and inhibitory conductances. Two-photon calcium imaging of dendritic spines circumvents some of these issues, by assessing the tuning of individual synapses. Previous work
in mice failed to observe clustering (Chen et al., 2013; Jia et al., 2010; Rochefort et al., 2011), but recent work in ferrets observed functional clustering of similarly-tuned inputs (Wilson et al., 2016). Moreover, synaptic inputs were found to cluster structurally in mouse neurons (Gokce and Bonhoeffer, 2016). In both mice and ferrets, the average tuning of spines was found to match somatic tuning for the preferred orientation but not for selectivity (Chen et al., 2013; Wilson et al., 2016). This mismatch could be explained by nonlinear processing at the level of individual neurons (Jia et al., 2010; Wilson et al., 2016). Two-photon spine imaging can reveal the tuning of a fraction of inputs, but not their relative strength and how they are integrated. Thus, the spatiotemporal patterns of synaptic inputs on V1 cortical neurons remains unsettled. In a detailed biophysical model (Shai et al., 2015), the distribution and tuning of inputs is assumed and strongly influences the conclusions regarding the contribution of dendritic processing. Dendritic processing may or may not significantly contribute to the output of individual neurons. While the precise location, tuning and strength of all inputs to individual neurons would enable more precise prediction and model testing of the contribution of dendrites, this is currently not possible. In chapter 2, we dissect the relationship between dendritic activity and somatic activity in visual cortical neurons in vivo.
1.4 Evolution of neuronal biophysics
Mammalian brains maintain recognizable features despite up to 10,000 fold changes in size across species (Clark et al., 2001; Herculano-Houzel et al., 2015). Humans exhibit superior cognitive abilities, including language, complex social interactions and an unparalleled ability to learn and adapt. However, the human brain is not special when it comes to its size and basic organization (Gabi et al., 2016; Herculano-Houzel, 2009). Analyses across multiple species suggest the human brain is a scaled up mammalian brain for most measured features, and a scaled
up primate brain for certain specific characteristics (Herculano-Houzel et al., 2007). The human brain abides by conserved scaling rules (Herculano-Houzel, 2009) for features like cortical folding (Mota and Houzel, 2015), neuronal density (Houzel et al., 2015; Herculano-Houzel et al., 2007) and neuron-to-glia ratio (Mota and Herculano-Herculano-Houzel, 2014).
The prominent cognitive abilities of humans have been speculated to arise not from larger brains or more neurons but from differences at the level of single neurons or their circuits (Defelipe, 2011a; Elston et al., 2001). Particularly striking is the size of individual neurons. Comparative anatomy revealed that human neurons are larger than rodent neurons (Anton-Sanchez et al., 2017; Defelipe, 2011a; Elston et al., 2001; Hofman, 2014; Mohan et al., 2015), with dendrites more than twice as long (Mohan et al., 2015). However, it remains unclear if these morphological differences are accompanied by changes in ionic conductances and integrative properties. From an evolutionary perspective, there have not been comparative studies evaluating single neuron morphological or biophysical features (Fişek and Häusser, 2020). Besides mice and rats, the electrical features of neurons in other mammals remain virtually unexplored. In chapters 3, I evaluate dendritic compartmentalization in human neurons and, in chapter 4, identify evolutionary rules governing neuronal biophysics.
Chapter 2. Dendritic spines prevent synaptic voltage-clamp
Synapses are the fundamental units of information processing in the mammalian brain. Much of our understanding of their functional properties comes from voltage-clamp analysis, the predominant approach for investigating synaptic physiology. Here, we reveal that voltage-clamp is completely ineffective for most excitatory synapses due to spine electrical compartmentalization. Under local dendritic voltage-clamp, single-spine activation produced large spine head depolarizations that severely distorted measurements and recruited voltage-dependent channels. To overcome these voltage-clamp errors, we developed an approach to provide new, accurate measurements of synaptic conductance. Single-synapse AMPA conductance was much larger than previously appreciated, producing saturation effects on synaptic currents. We conclude that electrical compartmentalization profoundly shapes both synaptic function and how that function can be assessed with electrophysiological methods.
2.1 Introduction
Electrophysiological approaches have been instrumental in deciphering how neurons communicate through electrical signals generated at synapses. For over thirty years, voltage-clamp has been the main approach to study synaptic physiology. This technique has been used to deconstruct the molecular basis of synaptic transmission and plasticity in vitro (Bekkers et al., 1990; Bekkers and Stevens, 1990; Benke et al., 1998; Blanton et al., 1989; Brown and Johnston, 1983; Edwards et al., 1990; Granger et al., 2013; Guzman et al., 2016; Isaac et al., 1995; Jonas et al., 1993; Malinow and Tsien, 1990; Matsuzaki et al., 2001) as well as to probe input tuning and integration in vivo (Adesnik, 2017; Adesnik and Scanziani, 2010; Borg-Graham et al., 1998; Chadderton et al., 2014; Froemke et al., 2007; Gan et al., 2017; Haider et al., 2006; Haider et al.,
2013; Liu et al., 2011; Petersen; Sato et al., 2016; Tan and Wehr, 2009; Wehr and Zador, 2003; Wilent and Contreras, 2005; Wu et al., 2008). Voltage-clamp circuits rapidly pass current to maintain the voltage at the tip of the electrode at set values, enabling measurement of current flow through ion channels and estimation of conductance (Cole, 1949; Hamill et al., 1981). One crucial assumption for voltage-clamp analysis is that synapses are isopotential with the recording site (Johnston and Brown, 1983; Spruston et al., 1993; Williams and Mitchell, 2008). However, accumulating evidence indicates that dendritic spines, where the vast majority of excitatory synapses reside (Bourne and Harris, 2008; Cajal, 1888), can compartmentalize electrical signals via high spine neck resistances (Rneck) (Acker et al., 2016; Araya et al., 2006; Bloodgood et al.,
2009; Bloodgood and Sabatini, 2005; Grunditz et al., 2008; Harnett et al., 2012; Jayant et al., 2017; Palmer and Stuart, 2009; Yuste, 2013). We reasoned that electrical isolation would prevent voltage control of spiny synapses, thereby distorting measurements and calling into question our current understanding of synaptic function. Here, we demonstrate that spines cannot be voltage-clamped, and subsequently develop a new approach to circumvent the problem and accurately measure synaptic conductance at single spines.
2.2 Results
High spine neck resistance prevents synaptic voltage control
We first determined the impact of Rneck on the effectiveness of synaptic voltage-clamp with
a simple compartmental model based on cortical layer 5 pyramidal neurons (Figure 1A; see Methods). For a Rneck of 500 MΩ based on prior estimates (Harnett et al., 2012; Jayant et al., 2017),
a synaptic input resulted in a large spine EPSP and a much smaller dendritic EPSP under current-clamp (Figure 1B). Under voltage-current-clamp, the synaptic voltage was totally uncurrent-clamped,
demonstrating that high Rneck prevents voltage control during synaptic events. Dendritic
voltage-clamp recovered the current but drastically underestimated synaptic conductance because the spine voltage was not controlled (Figure 1C). Synaptic conductance (gsyn), which reflects the density and
properties of glutamate receptors, is a key parameter governing synaptic efficacy (Araya, 2014; Koch and Poggio, 1983; Koch and Zador, 1993; Wilson, 1984). We computationally explored how different values of Rneck and gsyn would affect these results (Figure 1D-1F and S1). For a wide
range of parameters, synaptic voltage escape was near complete, and the magnitude of the spine depolarization determined the fraction of synaptic conductance recovered. Together with high
Rneck, large gsyn dramatically reduced the synaptic driving force as the spine voltage approached
reversal potential. As a result, the currents entering the spine and flowing into the dendrite were saturated (Fig. S1). Thus, our model predicts that voltage-clamp errors are substantial and non-uniform across synapses with varying strength and compartmentalization.
Unclamped recruitment of spine voltage-dependent channels
To provide an experimental test of the efficacy of synaptic voltage-clamp, we sought to uncover evidence of voltage escape. We hypothesized that if large unclamped spine depolarizations occur, Ca2+ imaging would reveal the activation of voltage-dependent channels,
including NMDA receptors and voltage-gated Ca2+ channels (VGCCs), known to be present in spine heads (Bloodgood et al., 2009; Grunditz et al., 2008; Harnett et al., 2012; Kovalchuk et al., 2000; Sabatini et al., 2002; Yuste and Denk, 1995). To specifically assess the impact of spine compartmentalization independently of series resistance and space-clamp limitations (Armstrong and Gilly, 1992; Spruston et al., 1993; Williams and Mitchell, 2008), we performed low series resistance (11.9 ± 0.5 MΩ, n = 70) whole-cell recordings from layer 5 pyramidal neuron apical
dendrites. We first tested the effectiveness of dendritic voltage-clamp using an independent current-clamp electrode positioned nearby (9.8 ± 1.0 µm, n = 9) on the same dendrite (Figure 2A). With rigorous series resistance compensation (Figure S2), the voltage-clamp electrode accurately recovered injected currents and prevented voltage escape (Figure 2B and 2C). We then tested whether spines less than 10 µm from the electrode could be voltage-clamped. Single spines were stimulated with two-photon glutamate uncaging while monitoring spine head Ca2+ signals with two-photon linescan imaging of Fluo-4 (Figure 2D). Under the same uncaging conditions, we observed Ca2+ signals of similar amplitudes under current-clamp and voltage-clamp, indicating that dendritic voltage-clamp could not prevent spine Ca2+ influx (Figure 2E and 2F).
To establish that these Ca2+ signals were evidence of spine depolarization, we investigated the nature and voltage-dependence of the ion channels recruited. Blocking NMDA receptors (100 µM D-APV + 50 µM MK-801) drastically reduced spine head Ca2+ signals (Figure 2G and 2H;
28.7 ± 0.1 % of baseline, n = 6), revealing that NMDA receptors are recruited during single-spine uncaging events. With AMPA receptors blocked (20 µM DNQX), strong membrane depolarization was needed to observe NMDA-mediated Ca2+ signals (Figure S3). Thus, NMDA receptor activation is evidence of unclamped AMPA-mediated spine depolarization. Under constant blockade of NMDA receptors, smaller Ca2+ signals could still be elicited with glutamate uncaging
(Figure 2I). Depleting intracellular stores of Ca2+ (30 μM CPA + 200 μM GPN) (Padamsey et al., 2017; Sabatini et al., 2002) did not affect the transients (Figure S3). In contrast, the application of VGCC blockers (300 µM Ni2+ + 20 µM nimodipine) demonstrated that these Ca2+ signals were voltage-dependent and mediated by VGCCs (Figure S3). Their recruitment during uncaging events was again similar under current-clamp and voltage-clamp (Figure 2I and 2J), providing additional evidence of synaptic voltage escape.
Spine-to-dendrite voltage attenuation is mediated by dendritic impedance (Gulledge et al., 2012; Harnett et al., 2012), and we performed these experiments on low-impedance trunk dendrites where attenuation is large. Our experimentally-constrained model suggests that dendritic properties have little influence on voltage-clamp performance (Figure S4). Filling the dendrites with a cesium-based intracellular solution to increase the dendritic impedance did not improve voltage-clamp (Figure 2J and S4). In addition, we performed experiments on higher impedance basal dendrites during somatic voltage-clamp recordings (Figure S4). Spine depolarization, as well as dendritic spikes, could not be prevented by voltage-clamp under those conditions. Thus, spines throughout the dendritic arbor cannot be voltage-clamped.
Measurement of synaptic conductance at single spines
Voltage-clamp is ineffective at spines, but how does this affect measurements of synaptic conductance? The answer strongly depends on the magnitude of the unclamped spine depolarization (Figure S1). To quantitatively address this issue, we devised a method to measure spine voltage during synaptic activation (see Methods). Following Ohm’s law, the current flowing from the spine into the dendrite is a function of Rneck and the voltage difference between the two
electrical compartments. Under voltage-clamp, the dendritic voltage is constant. Therefore, the spine EPSP and the recovered current are linearly related (Figure 3A). Interestingly, rather than directly reflecting synaptic conductance, we discovered that voltage-clamp current measurements reflect the unclamped spine EPSP (Figure 3B). We exploited this relationship to estimate AMPA-mediated spine EPSPs evoked by glutamate uncaging. First, we uncaged on a single spine to elicit VGCC-mediated spine Ca2+ transients under current-clamp and voltage-clamp (Figure 3D and 3E).
EPSPs (aEPSPs) with a nearby second electrode (Figure 3F; see Methods). The kinetics and amplitude of the aEPSPs were calibrated to have a similar temporal profile as the uncaging EPSC (uEPSC) (Figure 3K), and to elicit spine Ca2+ signals matching those produced by the glutamate uncaging (Figure 3G-3I). We performed these experiments with a cesium-based intracellular solution and in the presence of TTX (0.5 µM), D-APV (50-100 µM) and MK-801 (10-25 µM) to isolate AMPA-mediated potentials and VGCC-mediated Ca2+ signals. Owing to the lack of attenuation from the dendrite to the spine (Harnett et al., 2012; Koch and Zador, 1993; Rall et al., 1995), the matched aEPSP provided an accurate estimate of the spine voltage during glutamate uncaging. Despite effective dendritic voltage-clamp (4.6 ± 1.7 % dendritic voltage escape, n = 10), we computed very large uncaging-evoked spine EPSP (Figure 3J; 55.3 ± 3.9 mV, n = 10), suggesting strong electrical isolation imposed by high Rneck values (Figure 3K and 3L; 588 ± 89
MΩ, n = 10).
Using our measurements of uncaging-evoked spine EPSPs, we estimated single-spine AMPA conductance. Conductance is a function of the current and the driving force, which is the difference between the synaptic voltage and the reversal potential (we measured Esyn to be 18.2 ±
2.0 mV under our conditions, n = 11). Because of the large unclamped spine depolarization, the driving force drops substantially during synaptic events (Figure 4A). We reasoned that gsyn could
be reconstructed from the time-varying driving force and the recovered current (Figure 4B; see Methods). We found single-spine synaptic conductance to be much larger than what was recovered by voltage-clamp (Figure 4B-4D), providing concrete evidence that voltage-clamp measurements are severely distorted. Strikingly, this conductance substantially saturated the synaptic currents (Figure 4D; 71.9 ± 4.7 %, n=10), reducing the dendritic and somatic impact of the synapse.
Finally, we estimated physiological AMPA conductance evoked by presynaptic vesicle release. We first recorded miniature EPSPs (mEPSPs) (Figure 4E-4H) induced by focal application of high-osmolality sucrose-aCSF (Bekkers et al., 1990; Larkum et al., 2009; Magee and Cook, 2000). Based on our measurement of Rneck and dendritic properties (Figure S1), we then built a
transfer function to relate spine AMPA conductance to dendritic mEPSP (Figure 4I and S1). We inferred that physiological single-synapse AMPA conductance is much larger (Figure 4J; median: 1.47 nS, Q1-Q3: 0.95-2.53 nS, n = 2285) than previously estimated (Bekkers et al., 1990; Guzman et al., 2016). Moreover, saturation was still substantial (Figure 4K; median: 42.4 %, Q1-Q3: 32.2-55.9 %, n = 2285). Together, these data directly demonstrate that spine saturation of synaptic currents distorts voltage-clamp accuracy under physiological conditions, which will affect many common synaptic analyses, including excitatory-inhibitory balance and synaptic plasticity (Figure S5).
2.3 Discussion
Key to assessing synaptic properties with voltage-clamp is keeping the membrane potential constant. Here we demonstrate that this is not possible for most excitatory synapses because they reside on electrically-isolated spines. Unlike space-clamp limitations that are often thought to mainly affect distal inputs in large neurons, spine compartmentalization results in total voltage escape regardless of the dendritic location in all neurons with compartmentalized spines, including cortical pyramidal neurons, CA1 pyramidal neurons (Harnett et al., 2012), dopaminergic neurons (Hage et al., 2016) and olfactory granule cells (Bywalez et al., 2015). Our results thus question the utility of whole-cell voltage-clamp in spiny neurons. In addition to preventing accurate measurements of conductance and conductance-voltage relationships, the inability to
voltage-clamp spines has important implications for numerous common analyses in synaptic physiology. First, analyses requiring precise measurements, such as nonstationary fluctuation analysis (NSFA), will be heavily distorted by spine compartmentalization. NSFA analyzes the amplitude and variance of synaptic currents to estimate parameters such as the number and unitary conductance of synaptic receptors (Benke et al., 1998; Benke et al., 2001; Luthi et al., 1999; Matsuzaki et al., 2001; Smith et al., 2003). Synaptic voltage escape will change the driving force and the amplitude of single-channel currents. As a result, the peak and slope of the current-variance curve will be profoundly altered, precluding accurate measurements. Second, assessments of excitatory (E) to inhibitory (I) ratio, which is thought to play a central role in controlling circuit dynamics (Adesnik, 2017; Adesnik and Scanziani, 2010; Borg-Graham et al., 1998; Froemke et al., 2007; Gan et al., 2017; Haider et al., 2006; Haider et al., 2013; Liu et al., 2011; Sato et al., 2016; Tan and Wehr, 2009; Wehr and Zador, 2003; Wilent and Contreras, 2005; Wu et al., 2008) will be severely compromised. Most inhibitory inputs are located directly onto dendrites and will not be affected by spine compartmentalization. Thus, recordings will be distorted for excitatory synapses but not for shaft inhibitory synapses, drastically shifting the perceived E/I ratio (Figure S5). Moreover, inhibitory synapses located directly on spines (Chen et al., 2012; Chiu et al., 2013; Villa et al., 2016) will interact with excitatory ones (Poleg-Polsky and Diamond, 2011), further distorting both E and I measurements (Figure S5). Finally, changes in Rneck and other spine conductances will
affect voltage-clamp currents at hyperpolarized potentials (Figure S5), which are thought to reflect AMPA conductance. Consequently, postsynaptic plasticity phenomena often ascribed to changes in the number or properties of AMPA receptors (Malenka and Bear, 2004; Malinow and Malenka, 2002; Nicoll and Roche, 2013) may have alternative explanations.
By estimating Rneck and gsyn for individual dendritic spines, we provide new insights into
the electrical impact of spines on synaptic transmission. Early theoretical inquiries indicated that the relative magnitude of gneck (1/Rneck) and gsyn controls the electrical behavior of synapses (Harris
and Stevens, 1989; Koch and Poggio, 1983; Koch and Zador, 1993; Miller et al., 1985; Tonnesen and Nagerl, 2016; Wilson, 1984). If gsyn is very small relative to gneck, spines behave as current
sources, and the magnitude of the dendritic event is governed by gsyn. However, if gsyn is much
larger, spines can be approximated as voltage sources, and gneck controls the dendritic
depolarization. It remains unclear until now under which regime spines operate because Rneck has
been a matter of debate (Acker et al., 2016; Araya et al., 2006; Araya et al., 2014; Bloodgood et al., 2009; Bloodgood and Sabatini, 2005; Grunditz et al., 2008; Harnett et al., 2012; Jayant et al., 2017; Kwon et al., 2017; Palmer and Stuart, 2009; Popovic et al., 2015; Svoboda et al., 1996; Tonnesen et al., 2014; Yuste, 2013) and gsyn has not been well defined at single spines. Here, we
demonstrate that large spine depolarizations recruit voltage-dependent channels without dendritic depolarization. This can only be explained by strong electrical isolation via high Rneck (~300-1000
MΩ), which is consistent with recent electrical recordings from dendritic spines (Jayant et al., 2017). Previous somatic voltage-clamp experiments have reported conductance around 0.2-0.5 nS for unitary synaptic contacts (Bekkers et al., 1990; Guzman et al., 2016). Our results indicate that single spiny synapses are much stronger (~1-2.5 nS), saturating postsynaptic events (~42%) and significantly reducing their ultimate somatic impact. Interestingly, we observed that the ratio of
gneck to gsyn is close to one (mean gneck=1.70 ns; median gsyn=1.47 ns). With comparable magnitude, gneck and gsyn control synaptic current and spine EPSP. Moreover, coordinated changes of both
parameters can potently increase synaptic current while maintaining constant spine depolarization (Figure S5), which may be important to ensure consistent recruitment of spine voltage-dependent
conductances. Thus, Rneck and gsyn are within an optimal functional range allowing both synaptic
receptors and spine neck to tightly control spine and dendritic EPSPs to govern synaptic efficacy and plasticity.
In summary, we report that voltage-clamp analysis is incompatible with excitatory synapses on spines, highlighting the critical need to consider the compartmentalized nature of synaptic integration in designing and interpreting electrophysiological experiments. Our results provide important constraints for biophysically-realistic modeling of neuronal circuits, and have significant implications for future experimental approaches to analyze synaptic function.
2.4 Methods
Experimental model and subject details
Sprague Dawley rats (obtained from Charles River) were used for all experiments in accordance with NIH and the Massachusetts Institute of Technology Committee on Animal Care guidelines. Male rats were housed in pairs or singly and used for experimentation at 4.5-15 weeks of age.
Cortical slice preparation
Coronal brain slices (300 μm) from the somatosensory cortex were prepared from 4.5 to 15 week-old male Sprague-Dawley rats. Animals were deeply anesthetized with isoflurane prior to cardiac perfusion (using slicing solution described below) or immediate decapitation. Slicing was performed with a Vibratome (Leica) in ice-cold slicing solution containing (in mM): sucrose 90, NaCl 60, NaHCO3 26.5, KCl 2.75, NaH2PO4 1.25, CaCl2 1.1, MgCl2 5, glucose 9, sodium
artificial cerebrospinal fluid (aCSF) containing (in mM): NaCl 120, KCl 3, NaHCO3 25, NaH2PO4
1.25, CaCl2 1.2, MgCl2 1.2, glucose 11, sodium pyruvate 3, and ascorbic acid 1, saturated with
95% O2 and 5% CO2 at 35.5 °C for 25-30 min and then stored at 20 °C. All recordings were
performed at 33–37 °C in aCSF.
Patch-clamp recording
An Olympus BX-61 epifluorescent microscope with infrared Dodt optics and a water-immersion lens (60×, 0.9 NA; Olympus) was used to visualize cells. Patch-clamp recordings were performed from apical trunk dendrites of layer 5 pyramidal neurons for most experiments. For experiments in Figures 3 and 4, recordings were restricted to large trunk dendrites close to the first branch point (659 ± 34 µm from soma, n = 11). Somatic recordings were used for experiments in Figure S4. Recordings were performed at resting membrane potential (zero injected current) for most experiments. Cells were held at -65 mV (<1 nA holding current) for experiments in Figures 2D-2F and S4 when NMDA receptors were not blocked with D-APV and MK-801. Membrane potential was adjusted as indicated through steady-state current injections for experiments in Figure S3A-S3E.
Voltage-clamp whole-cell recordings were performed with an Axopatch 200B amplifier. Unless mentioned otherwise, series resistance and whole-cell capacitance were predicted and compensated >90 % with lag <10 µs. The prediction and compensation were set as high as possible with the lag as short as possible (up until the recording began oscillating) such that less than 1 MΩ was left uncompensated. We were able to fully compensate, and even overcompensate in some cases the series resistance (recovering more current than injected and causing negative voltage deflections). Current-clamp recordings were performed in bridge mode with an Axopatch 200B or
a Dagan BVC-700 amplifier with bridge fully balanced. Current and voltage signals were filtered at 10 kHz and digitized at 20 kHz. Patch pipettes made out of thick-wall glass (1.5 O.D., 0.75 I.D.) were used for voltage-clamp recordings to reduce capacitance. Current-clamp patch pipettes were prepared with thick-wall or thin-wall glass (1.5 O.D., 1.1 I.D.). Pipettes had resistances ranging from 2 to 8 MΩ and the capacitance was fully neutralized prior to break in. Particular care was taken to keep series resistances very low; it ranged from 3 to 20 MΩ and the recording was aborted if it rose above 20 MΩ. In dual dendritic recordings, the voltage waveform on the voltage measuring electrode was used as an independent reference to adjust the series resistance on the current-passing electrode with both electrodes in current-clamp. Final adjustments for the series resistance were made offline to correct for small residual errors (<1.25 MΩ) for experiments in Figures 2A-2C and S2A-S2G.
The standard intracellular solution contained (in mM): potassium gluconate 134, KCl 6, HEPES buffer 10, NaCl 4, Mg2ATP 4, NaGTP 3, phosphocreatine di (tris) 14. For experiments in
Figures 3, 4, S1I-S1K, S2H-S2N and S3F-S3I, a cesium-based intracellular solution was used (in mM): Cs-methanesulfonate 140, KCl 3, HEPES buffer 10, NaCl 4, Mg2ATP 4, NaGTP 3,
phosphocreatine di (tris) 14. Depending on the experiment, 0.05 Alexa 594, 0.1 Alexa 488 and/or 0.2 Fluo-4 mM (Invitrogen) were added to the intracellular solution. Liquid junction potentials (16.2 and 12.3 mV for standard and cesium intracellular, respectively) were not corrected for.
Two-photon imaging and uncaging
A two-photon laser scanning system (Prairie Technologies) with dual galvanometers and two Mai Tai DeepSee lasers were used to simultaneously image and uncage glutamate. One path was used to image Alexa 594 at 880 nm or Fluo-4 and Alexa 488 at 920 nm (separated via dichroic
mirrors to independent GaAsP PMTs). Linescan imaging of spines and dendrites was performed at 700-1300 Hz with dwell times of 8 μs for <400 ms. The other path was used to photolyse 4-methoxy-7-nitroindolinyl-caged-L-glutamate (MNI-glutamate) at 720 nM. Stock MNI solutions (50 mM) were freshly diluted in aCSF to 10 mM and applied via pressure ejection through a large glass pipette above the slice. Laser beam intensity was independently controlled with electro-optical modulators (model 350-50; Conoptics). Uncaging dwell time was 0.2 ms. For experiments involving near-simultaneous activation of multiple spines (Figure S4), the interval between spines was 0.32 ms (0.2 ms dwell time and 0.12 ms moving time). A passive 8X pulse splitter in the uncaging path was used to reduce photodamage (Harnett et al., 2013; Ji et al., 2008). Experiments were terminated if signs of photodamage were detected (increase in basal fluorescence, loss of transient signals and/or depolarization). Given the resolution of two-photon microscopy and the high brightness of large layer 5 apical dendrites, spine morphology could not be quantitatively assessed. Thus, no attempt was made at correlating physiological results with morphological parameters. Selected spines were within 10 μm from the voltage-clamp electrode unless mentioned otherwise. Care was taken to ensure that the selected spines were well isolated (no spines within 1 μm laterally and no spines above or below in z; see Figure S2).
Pharmacology
TTX, D-APV, MK-801 and DNQX dissolved in water, nimodipine dissolved in methanol as well as cyclopiazonic acid (CPA) and Gly-Phe β-naphthylamide (GPN) dissolved in DMSO were prepared as stock solutions stored at −20 °C and diluted directly to the aCSF on the day of the experiment. NiCl2 and CdCl2 were weighed and freshly dissolved in aCSF. Picrotoxin was
0.5 μM TTX was added to the recording aCSF to block voltage-gated sodium channels. For constant blockade of NMDA receptors (Figures 3, 4, S2H-S2N, S3F-S3I and where noted in Figures S4), 50–100 μM D-APV and 10-25 μM MK-801 were present in both the aCSF and the glutamate puffer pipette. For acute blockade of NMDA receptors (Figure 2G and 2H), 100 μM D-APV and 50 μM MK-801 were washed on for over 10 min through the bath. DNQX (20 μM), nimodipine (20 μM) and NiCl2 (300 μM) were present for experiments in Figure S3A-S3E. For
Figure S3F and S3G, nimodipine (20 μM) and NiCl2 (300 μM) were washed on through the bath
for >10 min and the glutamate puffer pipette was exchanged to include the drugs. CPA (30 μM) and GPN (200 μM) were washed on for over 30 min through the bath in Figure S3H and S3I. Reversal potential (Esyn) was measured with CdCl2 (200 μM) in the bath solution to prevent Ca2+
spikes and stabilize the membrane potential. For recording mEPSPs, a patch pipette filled with aCSF plus 300 mOsm of sucrose (~600 mOsm final) and Alexa 488 was brought close to the dendrite (~5 µm from the recording electrode). Low-pressure ejection was used to create a ~10 µm cloud around the recording pipette to locally induce presynaptic release. Picrotoxin (100 μM) was added to the bath solution for recording mEPSPs.
Compartmental modelling
Simulations were performed in MATLAB. The model consisted of a cylindrical soma (diameter = 25 µm, length =25 µm) and a 1.2 mm apical dendrite (tapered diameter from 7 to 4 µm). The parameters were set to reflect the apical trunk of L5 dendrites under the experimental conditions of Figures 3 and 4 where NMDA, voltage-gated sodium channels and voltage-gated potassium channels were blocked (Figure S1I-S1K). A spine with a head diameter of 0.5 µm was attached on the dendrite 600 µm from the soma. The model included a membrane capacitance of
1.2 μF cm−2 and an axial resistivity of 100 Ω*cm. The membrane resistivity was 20,000 Ω*cm2 at
the soma and dropped linearly as a function of distance to 3000 Ω*cm2 at a distance of 566 μm and
beyond. Spine capacitance as well as spine head resistance had negligible impacts on the dynamics studied (<0.2 % change with 5-fold manipulations).
Resting membrane potential was -80 mV. AMPA synapses were simulated as rapid conductance changes in the spine head, while a dendritic electrode was in current-clamp, where the membrane voltage could fluctuate freely, or ideal voltage-clamp, where the voltage is kept constant. Voltage-clamp was implemented in the dendritic compartment adjacent to the spine. AMPA conductance was modeled as a double-exponential function (Harnett et al., 2012) with 0.1 ms rise time constant, 0.75 ms decay time constant and reversal potential at 0 mV to produce EPSPs with kinetics matching the experimental mEPSPs (Figure S1K). Inhibitory synapses (Figure S5) were simulated like AMPA synapses but the reversal potential was set to -80mV.
Determination of Rneck and gsyn
The synaptic conductance is a function of the time-varying synaptic current and the driving force:
(1) 𝑔syn=
𝐼syn
𝐸syn−𝑉spine
Considering the spine and the dendrite as two compartments linked by Rneck, the current
flowing across the neck is a function of the voltage difference between the two compartments and the resistance linking them:
(2) 𝐼dend =𝑉spine−𝑉dend
Under dendritic voltage-clamp, the current entering the dendrite is faithfully recovered (Irec) and the dendritic voltage is kept constant (∆Vdend = 0; Figure S1 and S2). The difference
between Vspine and Vdend thus corresponds to the unclamped spine EPSP. Equation 2 can therefore
be simplified to equation 3, which is illustrated in Figure 3A and 3B: (3) 𝐼rec =Spine EPSP
𝑅neck
The current entering the spine flows into the dendrite without loss or time delay (Figure S1; (Koch and Poggio, 1983; Wilson, 1984)). Thus Isyn = Irec. From equations 1 and 3, we get
equation 4, which is illustrated in Figure 4B: (4) 𝑔syn= 𝐼rec
𝐸syn−𝑉spine
For estimating the spine EPSP with dendritic current injections, several criteria were used to ensure a good fit in terms of the aEPSP kinetics and Ca2+ signal amplitude. For the aEPSP
matching the kinetics of the uEPSC, the correlation coefficient threshold was >0.95. For Ca2+ signals, the difference was <0.05 ΔF/F. 10 out of 16 spines analyzed met those criteria. When Esyn
- Vspine approaches 0, gsyn estimates are more prone to errors. To avoid such errors, we only
computed gsyn when saturation was below 80% (7 out of 10 spines). For 3 spines with saturation
above 80%, we made a conservative estimate that synaptic conductance was >8 nS based on the relationship between gsyn and saturation in our model (see Figures 1 and S1).
Quantification and statistical analysis
experiments. Linescan signals were smoothed using a 3-point moving average. Some imaging trials exhibited a light artifact from the uncaging laser, which was excised. 2-5 trials were acquired per condition and averaged for both electrophysiological and optical traces (see Figure S2N). Morphological and distance measurements were performed using ImageJ/FIJI (National Institutes of Health) on two-dimensional maximal intensity projections of 1–2 μm Z-series collected at the end of the experiment. Miniature EPSPs were detected by fitting template EPSPs to events with fast 20-80 % rise times (median: 0.55 ms, Q1-Q3: 0.45-0.65 ms, n = 2285; excluded if >1.5 ms).
Statistical analysis was performed in MATLAB. D’Agostino-Pearson test was used to assess normality. For normal data, results are presented as mean ± SEM and two-tailed t-test was used for statistical analyses. For skewed data, the median and the lower and upper quartiles (Q1-Q3) are reported and Wilcoxon paired test was used for statistical comparisons. Statistical details can be found in the figure legends and in the Results. Reported n values refer to the number of spines unless indicated otherwise.
2.5 Figures
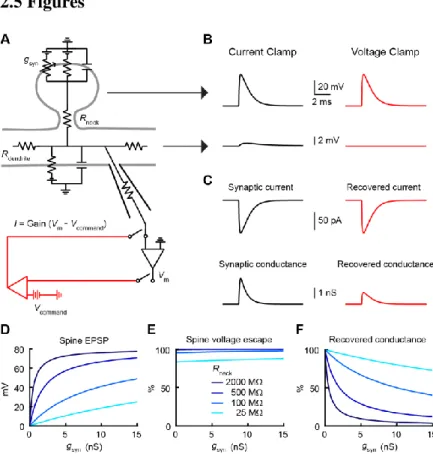
Figure 1. Impact of spine neck resistance on synaptic voltage-clamp.
(A) Equivalent circuit diagram for a spine on a dendrite. A dendritic recording at the base of the spine can switch between current-clamp (black) and voltage-clamp (red).
(B) Voltage in the spine (top) and dendrite (bottom) in response to a synaptic conductance change.
(C) Voltage-clamp recovers the current (top) but underestimates the conductance (bottom) because the synaptic voltage is not controlled.
(D) Spine EPSP under current-clamp as a function of gsyn for a range of Rneck values.
(E) Spine voltage escape under voltage-clamp computed as the percentage of current-clamp spine EPSP.
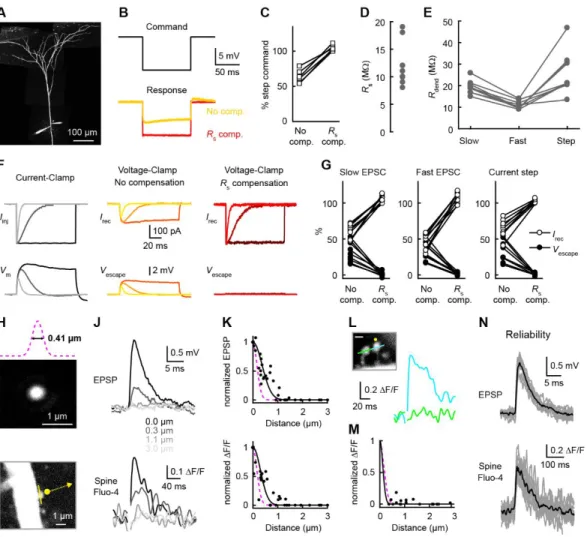
Figure 2. Unclamped spine depolarization recruits voltage-dependent channels. (A) Two-photon image of a dual-dendritic recording 860 µm from the soma.
(B) Under current-clamp, slow and fast EPSC-shaped current injections depolarize the dendrite. Under voltage-clamp, the same current injections are faithfully recovered and there is little voltage escape.
(C) Recovered current (white) and voltage escape (black) for slow and fast EPSC-shaped as well as step current injections (n=9 dendrites). Pooled data are represented as mean ± SEM. See also Figure S2 for the impact of series resistance compensation.
(D) Image of a dendritic recording 600 µm from the soma. The yellow box shows the spine linescan imaging (yellow line) and glutamate uncaging (yellow dot). See also Figure S2 for uncaging resolution.
(E) Uncaging-evoked dendritic EPSP/EPSC and corresponding spine Ca2+ signal under
current-clamp (black) and voltage-current-clamp (red).
(F) Top, relationship between EPSP and EPSC (n=37, 18 spines stimulated at 1-3 laser intensities). Bottom, corresponding spine Ca2+ signals under current-clamp and voltage-clamp are not different (n=19, P=0.58, paired t-test for highest laser intensity).
(G) Dendritic EPSCs and spine Ca2+ signals before (red) and after the application of D-APV and
MK-801 to block NMDA receptors (orange).
(H) D-APV and MK-801 application significantly reduced the spine Ca2+ signals (n=6,
**P=0.0036, paired t-test). The EPSCs are not different (n=6, P=0.42, paired t-test), likely
because AMPA currents dominate the small NMDA currents (Figure S3).
(I) Uncaging-evoked dendritic EPSP/EPSC and spine Ca2+ signals mediated by VGCCs (D-APV
and MK-801 are present to block NMDA receptors). See also Figure S3 for the contribution of VGCCs.
(J) Top, relationship between EPSP and EPSC with a control (white squares) or with a cesium-based intracellular solution (black triangles). Bottom, spine Ca2+ signals are not different under current-clamp and voltage-clamp (Control: n=18, P=0.90, paired t-test; Cesium: n=27, P=0.19, paired t-test). See also Figure S4 for simulations and experiments in higher impedance dendrites.
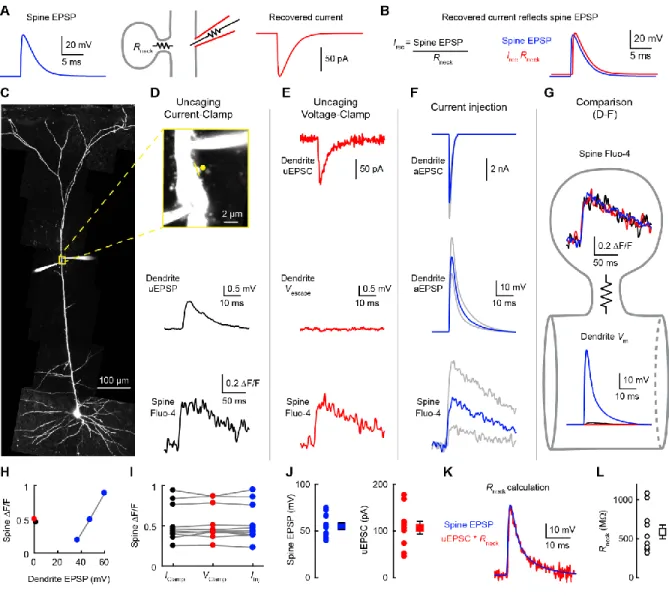
Figure 3. Measurement of spine voltage escape.
(A) Relationship between the spine EPSP and the recovered current under voltage-clamp. See Methods for details.
(B) The recovered current and the spine EPSP have identical kinetics. (C) Image of a dual dendritic recording 490 µm from the soma.
(D) Top, yellow box from C expanded to show the two electrodes and the spine linescan imaging (yellow line) and glutamate uncaging (yellow dot). Uncaging-evoked dendritic EPSP (uEPSP; middle) and spine Ca2+ signal (bottom) in the presence of TTX, D-APV and MK-801.
(E) Top, uncaging-evoked dendritic EPSC (uEPSC). Middle, dendritic voltage escape measured with an independent electrode. Bottom, spine Ca2+ signal.
(F) Artificial EPSCs (aEPSCs; top) are injected in the dendrite to produce artificial EPSPs (aEPSPs; middle) with kinetics matching the uEPSC and spine Ca2+ signals (bottom) matching the uncaging ones.
(G) Comparison of the spine Ca2+ signals and dendritic potentials from D-F. (H) Spine head Ca2+ signals as a function of dendritic EPSP.
(I) Spine Ca2+ signals across conditions (n=10). (J) Distribution of spine EPSP and uEPSC. (K) Method to calculate Rneck.
Figure 4. Single-spine AMPA conductance.
(A) Driving force during the synaptic event from Figure 3K.
(B) Estimated AMPA conductance (blue) and distorted conductance recovered by voltage-clamp (red).
(C) Left, comparison of recovered (red) and estimated AMPA conductance (blue) (n=10,
**P=0.0020, Wilcoxon paired test).
(D) Left, percentage of conductance recovered by voltage-clamp. Right, percentage of current saturation. Pooled data are represented as mean ± SEM.
(E) Dendritic recording 618 µm from the soma. A second pipette (green) filled with high-osmolality sucrose-aCSF to evoke mEPSPs is positioned extracellularly nearby.
(F) Baseline recording (top) and recording during the application of sucrose-aCSF (bottom). (G) Recorded mEPSPs with the average in black.
(H) Distribution of mEPSP amplitudes (n=2285 events from 4 neurons).
(J) Inferred distribution of gsyn based on the distribution of mEPSPs in H and the transfer
function in I.
(K) Current saturation for the inferred distribution of gsyn in J. The saturation of the current is
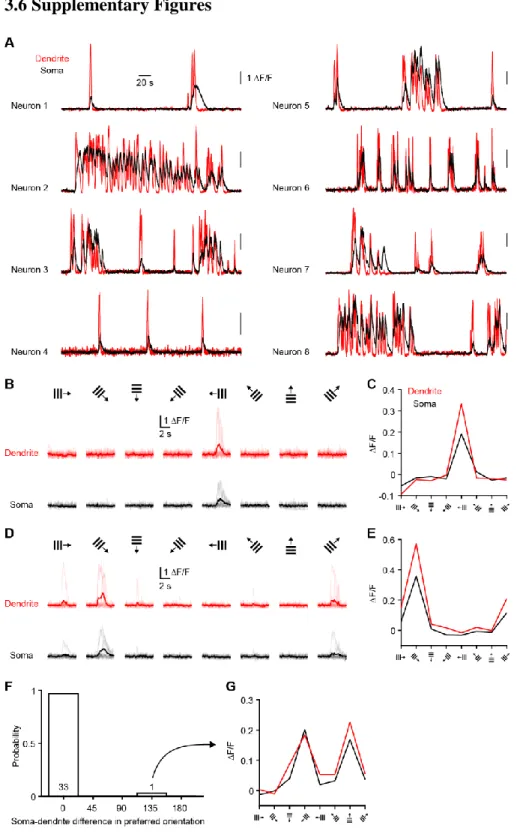
2.6 Supplementary Figures
Figure S1, related to Figures 1 and 4: Additional modeling results.
(A) Synaptic current under voltage-clamp as a function of gsyn for a range of Rneck values. (B) Synaptic current/conductance under voltage-clamp showing that large Rneck and gsyn saturate the current for a given conductance.
(C) Synaptic current saturation.
(D) Percentage of synaptic current recovered. Unless both Rneck and gsyn are very high, the current is recovered by voltage-clamp.
(E) Dendritic EPSP under current-clamp.
(F) Recovered conductance as a function of spine EPSP under voltage-clamp. Rneck has no impact on this relationship.
(G) Current saturation as a function of spine EPSP under voltage-clamp. Rneck has no impact on this relationship.
(H) Linear relationship between current saturation and recovered conductance. (I) Two-photon image of a dual dendritic recording 666 µm from soma.
J) Comparison of EPSPs produced through the injection of EPSC-shaped currents in the recording in I or in the model. The model
matches the impedance profile of the experiment, as evidenced by similar EPSPs.
(K) Comparison of sucrose-induced mEPSPs (Figure 4G) and model mEPSPs. Left, average mEPSPs sorted by amplitudes in 22 groups
of 100. Right, mEPSPs produced by increasing gsyn from 0.5 to 5 nS.
(L) Transfer function from mEPSP to gsyn for the minimum (311 MΩ), mean (590 MΩ) and maximum (1083 MΩ) measured Rneck in Figure
3L.
(M) Distribution of gsyn expected based on the distribution of mEPSPs in Figure 4H and the transfer functions in L.
(N) Saturation function associated with the results in L.
(O) Distribution of current saturation based on the distribution of mEPSPs in Figure 4H and the transfer functions in N.
Figure S2, related to Figure 2. Series resistance compensation and resolution of two-photon glutamate uncaging.
(A) Two-photon image of a dual-dendritic recording 583 µm from the soma.
(B) A 10 mV step command for the voltage clamp electrode (top) and the actual voltage in the dendrite recorded with an independent
electrode (bottom) without compensation (orange) and with >90 % prediction and compensation (red).
(C) Percentage of the step command without compensation and with >90 % prediction and compensation (n=6 dendrites).
(D) Series resistance on the voltage-clamp electrode for nine dual dendritic recordings. Notice that it is similar to the dendritic impedance in E.
(E) Dendritic impedance for the different current injections (n=9 dendrites).
(F) Left, under current-clamp, EPSC-shaped and step current injections (top) produce voltage changes (bottom). Middle, under voltage-clamp without compensation, a fraction of the injected currents is recovered and there is voltage escape. Right, under voltage-clamp with >90 %
prediction and compensation, the same current injections are faithfully recovered and there is no voltage escape.
(G) Percentage of recovered currents and voltage escape under voltage-clamp are shown in opened and closed circles, respectively, for the different types of current injections (n=9 dendrites).
(H) Two-photon stack of a 0.04 μm fluorescent bead imaged at 800 nm The lateral profile of the point spread function is illustrated above in magenta.
(I) Two-photon image of a spine with the dendritic electrode in the upper left. The yellow line represents linescan imaging while the yellow dot with the arrow represents the variable location of the glutamate uncaging.
(J) Uncaging-evoked EPSPs (top) and spine Ca2+ signals (bottom) with variable uncaging location (0, 0.3, 1.1 and 3 μm) from I.
(K) Normalized EPSPs and spine Ca2+ signals when gradually moving the uncaging spot away from the spine (n=44 points from 10
spines). The black lines are Gaussian fit to the data (half the function is shown here) while the magenta dashed line is the profile from H.
(L) Uncaging-evoked spine Ca2+ signals on target spine (blue) and its neighbor (green). Scale bar is 1 μm.
(M) Neighbor spine Ca2+ signals expressed as the percentage of the target spine Ca2+ signals as a function of distance (n=21 spines). The
black line is a Gaussian fit to the data while the magenta dashed line is the profile from H. (N) Individual EPSPs and spine Ca2+ signals in gray with the average in black to illustrate the reliability of the signals (9 trials).
Figure S3, related to Figure 2. Voltage-dependence of spine Ca2+ signals.
(A-E) Voltage-dependence of NMDAR-mediated spine Ca2+ signals. DNQX, Ni2+ and nimodipine were present to block AMPA receptors and VGCCs.
(A) Two-photon image of a dendritic recording 607 µm from soma.
(B) Yellow box from A expanded to show the location of the electrode and two nearby spines. Yellow lines represent linescan imaging while yellow dots represent glutamate uncaging. (C) Uncaging-evoked EPSPs and spine Ca2+ signals at different membrane potentials. Both spines exhibited Ca2+ signals but only spine 2 had detectable EPSPs.
(E) Percentage of spines for which EPSPs could be detected at the different holding potentials (n=11, 16, 13 & 16).
(F-I) Nature and voltage-dependence of NMDA-independent Ca2+ signals. Spine Ca2+ signals were evoked with glutamate uncaging or dendritic current injections in the presence of D-APV and MK-801 to block NMDA receptors. Ni2+ and nimodipine were applied to test the
contribution of VGCCs. CPA and GPN were applied separately to test the contribution of intracellular stores of Ca2+.
(F) Comparison of EPSPs and spine Ca2+ signals evoked by glutamate uncaging before and after the application of Ni2+ and nimodipine (EPSP: n=13, P=0.23, paired t-test; ΔF/F: n=13, *** P<10-5, paired t-test). The laser power for the glutamate uncaging was adjusted to produce EPSPs of similar amplitudes after changing the glutamate puffer pipette.
(G) Comparison of EPSPs and spine Ca2+ signals evoked by dendritic current injection before and after the application of Ni2+ and nimodipine (EPSP: n=14, P=0.15, paired t-test; ΔF/F: n=14, *** P<10-5, paired t-test).
(H) Comparison of EPSPs and spine Ca2+ signals evoked by glutamate uncaging before and after the application of CPA and GPN (EPSP: n=7, P=0.99, paired t-test; ΔF/F: n=7, P=0.56, paired t-test). The drugs were applied through the bath for >30 min to enable CPA to deplete intracellular stores of Ca2+.
(I) Comparison of EPSPs and spine Ca2+ signals evoked by dendritic current injection before and after the application of CPA and GPN (EPSP: n=8, P=0.58, paired t-test; ΔF/F: n=8, P=0.35, paired t-test).
Figure S4, related to Figure 2. Unclamped single-spine events and dendritic spikes in thin basal dendrites.
(A) Spine voltage (top) and dendritic voltage (bottom) under current-clamp (left) and voltage-clamp (right) for three dendritic diameters. Dendritic diameter was decreased 2 or 10 fold in the model to demonstrate the negligible influence of dendritic size on synaptic voltage-clamp. Rneck was set to 590 MΩ based on Figure 3L.
(B) Spine EPSP under current-clamp (left) and voltage-clamp (right). Dendritic properties have little impact on the spine EPSP under current-clamp and no impact under voltage-clamp. (C) Manipulating the dendritic diameter affects the dendritic EPSP by changing the dendritic impedance.
(D) Two-photon image of a somatic recording. Yellow box expanded to show dendritic branch segment 70 µm from soma where glutamate uncaging (yellow dot) and linescan imaging (yellow line) were performed.
(E) Uncaging-evoked dendritic EPSP/EPSC and spine Ca2+ signal under current-clamp (black) and voltage-clamp (red).
(F) Relationship between EPSPs and EPSCs in control conditions (white squares) or for cesium-based intracellular solution plus extracellular D-APV and MK-801 to block NMDA receptors (black triangles).
(G) Spine Ca2+ signals are no different under current-clamp and voltage-clamp (Control: n=25, P=0.40, paired t-test; Cesium with D-APV and MK-801: n=22, P=0.99, paired t-test).
(H) Percentage of ΔF/F escape as a function of distance from the soma. The red line represents a linear regression fit through the data. There is no significant correlation with distance (n=47, P=0.08, R^2=0.07), suggesting that spine compartmentalization on its own prevents synaptic voltage-clamp.
(I) Two-photon image of a somatic recording. Yellow box expanded to show dendritic branch segment 75 µm from soma where glutamate uncaging on ten spines (yellow dots) and linescan imaging of the branch (yellow line) were performed.
(J) Uncaging-evoked EPSPs and EPSCs for individual spines when activated in isolation. (K) EPSPs and EPSCs observed when synchronously activating 1, 4, 7 or 10 spines.
(L) Expected EPSPs and EPSCs based on the arithmetic summation of units in J. (M) Branch Ca2+ signals associated with responses in K.
(N) Comparison of observed and expected EPSPs (n=5). (O) Comparison of observed and expected EPSCs (n=5).
(P) Maximal nonlinearity under current-clamp and voltage-clamp (n=5, P=0.63, paired t-test). Pooled data are represented as mean ± SEM.
(Q) Comparison of branch Ca2+ signals under current-clamp and voltage-clamp (max ΔF/F are not different, n=5, P=0.14, paired t-test).