HAL Id: hal-02988194
https://hal.archives-ouvertes.fr/hal-02988194
Submitted on 4 Nov 2020
HAL is a multi-disciplinary open access
archive for the deposit and dissemination of
sci-entific research documents, whether they are
pub-lished or not. The documents may come from
teaching and research institutions in France or
abroad, or from public or private research centers.
L’archive ouverte pluridisciplinaire HAL, est
destinée au dépôt et à la diffusion de documents
scientifiques de niveau recherche, publiés ou non,
émanant des établissements d’enseignement et de
recherche français ou étrangers, des laboratoires
publics ou privés.
conformations through crosslinking in a 3D
macromolecular network
Julien Kelber, Amina Bensalah-Ledoux, Sarah Zahouani, Bruno Baguenard,
Pierre Schaaf, Alain Chaumont, Stephan Guy, Loïc Jierry
To cite this version:
Julien Kelber, Amina Bensalah-Ledoux, Sarah Zahouani, Bruno Baguenard, Pierre Schaaf, et
al.. Reversible soft-mechanochemical control of biaryl conformations through crosslinking in a 3D
macromolecular network.
Angewandte Chemie International Edition, Wiley-VCH Verlag, 2020,
�10.1002/anie.202010604�. �hal-02988194�
1
Reversible soft-mechanochemical control of biaryl conformations
through crosslinking in a 3D macromolecular network
Julien Kelber,
aAmina Bensalah-Ledoux,
bSarah Zahouani,
aBruno Baguenard,
bPierre Schaaf,
a,cAlain
Chaumont,
dStephan Guy*
band Loïc Jierry*
a[a] Dr. J. B. Kelber, Dr. S. Zahouani, Prof. Dr. P. Schaaf, Prof. Dr. L. Jierry Université de Strasbourg, CNRS
Institut Charles Sadron (UPR22)
23 rue du Loess, BP 84047, 67034 Strasbourg Cedex 2 (France) E-mail: [email protected]
[b] Dr. A. Bensalah-Ledoux, Dr. B. Baguenard, Prof. Dr. S. Guy Université Claude Bernard Lyon 1, Université de Lyon, CNRS Institut Lumière Matière (UMR5306)
69622 Lyon (France) [c] Prof. Dr. P. Schaaf
Institut National de la Santé et de la Recherche Médicale INSERM Unité 1121
11 rue Humann, 67085 Strasbourg Cedex (France) and
Université de Strasbourg Faculté de Chirurgie Dentaire 8 rue Sainte Elisabeth 67000 Strasbourg (France) [d] Dr. A. Chaumont
Université de Strasbourg Faculté de Chimie, UMR7140
1 rue Blaise Pascal, 67008 Strasbourg Cedex (France)
Supporting information for this article is given via a link at the end of the document
Abstract: Tuning the dihedral angle (DA) of axially chiral
compounds can impact biological activity, catalyst efficiency, molecular motor performance, or chiroptical properties. Herein, we report gradual, controlled and reversible changes in molecular conformation of a covalently linked binaphthyl moiety, within a 3D polymeric network by the application of a macroscopic stretching force. We managed a direct observation of the DA changes by measuring the circular dichroism signal of an optically pure BINOL-crosslinked elastomer network. In accordance with computed spectra, stretching the elastomer resulted in a widening of the DA between naphthyl rings when the BINOL was doubly-grafted to the elastomer network, while no effect was observed when a single naphthyl ring of the BINOL was grafted to the elastomer network. Combining both experimental and theoretical results, we have determined that ~170% extension of the elastomers led to the transfer of a mechanical force to the BINOL moiety of 2.5 kcal*mol
-1
*Å-1 (~175 pN) in magnitude and results in the opening of the DA of BINOL up to ~130°.
Introduction
Axially chiral moieties play an important role in the bioactivity of many natural products, are highly useful in the design of molecular motors, molecular and/or chiroptical material and lead to powerful ligands for asymmetric catalysis.1 Their ability to induce chiral discrimination arises from a hindered rotation around a congested bond generating a pair of atropisomers, where the presence of a rotational energy barrier avoids racemization. Although this barrier might be overcome by thermal energy in certain compounds such as some biphenyls, binaphthyls and their derivatives have been used extensively because of their resistance to racemization, with isomerization barriers typically exceeding 30 kcal.mol-1.2 Beyond the consideration of this barrier, the precise value of the dihedral
angle between naphthyl rings is a key parameter that needs to be controlled for at least two main reasons: this angle value directly impacts both (i) the reactivity and the stereochemical outcome when an atropisomer is involved as ligand in enantioselective catalysis,3 and (ii) the helicity of axially chiral derivatives determines as well their chiroptical properties, a crucial aspect to take into account for chiral material design.4 Conformational control of atropisomers can be done through different environmental stimuli: protonation,5 complexation with metallic ions,6 or solvent polarity7, which can all be efficient
triggers when the chiral system studied is in solution but hardly usable for atropisomer-containing materials.
Within the past decade, mechanochemistry has emerged as a new way of conducting chemical reaction by milling, stretching, shearing, pulling, swelling or ultrasonic irradiation.8 In these cases, the mechanical energy allows molecules to overcome high energy barriers that wouldn’t be reachable by thermal or photochemical ways. This results in constitutional changes, where some bonds are cleaved and others are formed in a non-reversible way.9 On top of this, another strategy has
recently emerged based on reversible conformational changes of mechano-sensitive molecules, modifying thus properties of the host material they are bound to.Inspired from nature,10 the soft-mechanochemistry field has earned the community recognition thanks to many successful achievements.11 Based on a less energy-demanding process, when the mechanical stimulus is released, the initial state of the considered material can be reversibly restored and the targeted molecule is returned to its initial thermodynamic conformation. This approach was cleverly exploited to design mechanosensitive materials (i) containing enzyme-like artificial cavities, where the application of a mechanical force lead to the selective discrimination between nucleobases,12 (ii) where the applied force controls the fluorescence emission intensity of marked proteins in an hydrogel,13 (iii) where enzymatic biocatalytic activities can be
2
conformation and film-nanoorganization can be reversibly modulated upon stretching.15 Through all these contributions, original concepts were reported highlighting the huge potential of soft-mechanochemistry. Nevertheless, the relation between the macroscopic force applied and the resulting observation (supramolecular recognition, chiral discrimination, catalysis, fluorescence and so on) was only expected to occur through a conformational change at the molecular scale and this point was not demonstrated in an unambiguous way. A clue towards this goal was hinted by Balaz and co-workers, when they observed through steady-state and time-resolved emission spectra a distribution change between a planar and a twisted conformation of an embedded porphyrin dimer PVA film. However, in that case, the mechanotransduction was an all or nothing process with intermediate conformations between the two states not being mentioned, and the process showing no reversibility.16Indeed, the efficiency of the mechanotransduction going from the macroscopic mechanical transfer to the molecular deformation depends mainly on two parameters: high displacement and high order. In case of solid-state crystals, the order is large but the displacement is low because of their rigid nature. Although mechanical forces have been largely used to orient molecules embedded in materials,17 in most cases, the rigidity of materials is such that low structural variations are allowed (up to 1% change in volume) prior to loss of crystal integrity.18 On the contrary, for molecules at the 2D interface, where order and displacement can be high, the external force is transferred efficiently to individual molecules and dynamic conformational variation is allowed. This was illustrated using Langmuir monolayers of cholesterol-armed cyclen formed at the air-water interface.19 Unidirectional compression of this 2D organized systems allows tuning the binding constants and the enantioselective recognition between the cyclen and various amino acid guests. Following on this, Ariga and coworkers recently showed a transduction pathway of a mechanical force (compression) to the distortion of the dihedral angle of enantiopure amphiphilic binaphthyl constituting monolayer films.20 The direct observation and the quantification of the
molecular conformational change was evidenced using circular dichroism (CD). Though this development is attractive, its application for 3D material still remains highly challenging and has never been reported so far. Soft materials containing conformationally-sensitive molecules, such as polymer-based materials, hydrogels, thin films or liquid crystals, are flexible enough to allow a wide dynamic variation of their structure and a good mechanotransduction of the mechanical stimulus to mechano-sensitive molecules. However, investigating molecular chiral conformation changes within these materials is not obvious because CD signal measurements used to contain huge linear dichroism (LD) and linear birefringence (LB) contributions when the material is mechanically deformed.
Herein, we investigated enantiopure binaphthol derivatives (BINOL) as mechano-sensitive probe mono linked or doubly crosslinked in a 3D macromolecular network. Using polydimethylsiloxane (PDMS) as host elastomer, our goal is to establish unambiguously the transduction’s relation between the macroscopic unidirectional stretching deformation applied and the molecular force involved resulting from dihedral angle changes in the binaphthyl conformation (Scheme 1). Based on a convenient and an easy-to-use optical system, an efficient CD extraction method free from linear contributions was developed.
The reversibility and the repeatability of this soft-mechano-transduction process were studied. Quantum molecular calculations (QMC) and molecular dynamic simulation (MDS) have contributed to quantify the molecular force according to the macroscopic mechanical stimulus applied to the BINOL-containing material.
Scheme 1. Schematic view of the reversible tuning of the BINOL dihedral
angle when doubly crosslinked in a polymer network through the application of a macroscopic unidirectional stretching.
Results and Discussion
Synthesis of BINOL derivatives and preparation of BINOL-crosslinked host materials. PDMS-based material is an
elastomer made from the covalent crosslinking of two different kinds of copolymer chains containing either vinyl or hydrogenosilane groups. Hydrosilylation coupling reaction between these two copolymers is catalyzed by an organoplatinum compound leading thus to the formation of a chemical three-dimensional network. Incorporation of BINOL moieties within this polymer architecture was realized thanks to the introduction of vinyl entities at the two phenolic hydroxyl groups. Decenyl chains are long enough spacers placed between the BINOL unit and the reactive terminal double bonds to allow efficient anchoring on the PDMS chains. The reactive R, S and rac-BINOL derivatives leading to R-1, S-1 and rac-1 respectively, were prepared in one step from the commercially available racemic or enantiopure forms R or S of the biaryl starting material (Scheme 2). For control experiments, mono vinyl functionalized BINOL derivatives 2 were also prepared. The nucleophilic substitution of 1 equivalent of BINOL was realized in presence of 1.5 equivalent of 10-bromo-1-decene and potassium carbonate. This 1/1.5 ratio between BINOL/10-bromo-1-decene allowed to isolate the bis vinyl functionalized 1 and the mono vinyl functionalized 2 derivatives in a single step and in one pot conditions through chromatograph column purification. Compounds R-1, S-1, rac-1, R-2, S-2 and yrac-2 were obtained in good to excellent yields ensuring a non-expensive large-scale production necessary for materials preparation (Section 2 in SI). The BINOL-crosslinked PDMS films were prepared using a commercially available kit (Sylgard 184, Dow Corning), incorporating 0.2% in weight of R-1, S-1, rac-1, R-2, S-2 or rac-2 derivatives, a value that was suitable to
3
avoid signal saturation during optical measurements (Section 3 in SI). Using this method, different transparent and rectangular elastomer samples (3 x 1 cm) displaying ~200 µm of thickness were prepared: 1@PDMS, S-1@PDMS, rac-1@PDMS,R-2@PDMS, S-R-2@PDMS, rac-2@PDMS and an undoped PDMS
film lacking any BINOL derivative. Intensive rinsing procedures ensured the removal of unlinked BINOL derivatives and free PDMS chains.
Scheme 2. Synthetic pathway to prepare R-1, S-1, rac-1, R-2, S-2 and rac-2
leading to the preparation of the corresponding PDMS films: R-1@PDMS,
S-1@PDMS, rac-S-1@PDMS, R-2@PDMS, S-2@PDMS and rac-2@PDMS
respectively (see Sections 2 and 3 in SI for experimental details).
Optical measuring setup. UV-Absorption and CD spectra were
both measured for all PDMS films (Fig. S1). Due to the UV cutoff of the PDMS, spectra were recorded between 260 and 380 nm. The measured absorption and CD bands of R-1@PDMS,
S-1@PDMS, R-2@PDMS and S-2@PDMS@ were quite similar to
those reported for others binaphthyl-containing materials.4c
During stretching experiments, all the LB, CB, LD and CD values were corrected by dividing the intensity measured with the corresponding maximum absorption in order to take into account the film thickness variation, in particular when the PDMS is stretched: LB(λ)*=LB(λ)/Abs. As expected, no CD signal (and no LB or LD as well) arose from rac-1@PDMS and undoped PDMS films, whereas symmetric CD shape curves were obtained for R- and S-doped polymer films. The main issue with CD measurement within materials (i.e. non-isotropic matrix) appeared when the latter was mechanically deformed inducing strong linear contributions coming from LD and LB to the CD signal and leading thus to possible misinterpretation. To decouple LD and LB from CD measurements and access them all independently, we measured all these values at carefully chosen angles compared to the PDMS film orientation (Section
5 in SI). Indeed, using the so-called Mueller matrices method, uniaxial optical material with isotropic chirality and light propagation perpendicular to the optical axis could be simply described without LB and LD cross terms.21 We therefore used a
rotating sample holder and the measurements of both first and second harmonic signals to determine LD, LB, CB (circular birefringence) and CD independently on the same set-up without any artefact.22 All measurements were done using a home-made CD spectrophotometer adapted from previous investigations on chiral thin films.4b,c A specific stretching device adaptable to our spectrophotometer and allowing the stretching of PDMS films was also designed (Sections 4 and 5 in SI). The stretching ratio α was defined as the ratio of the lengths of film after and before stretching, multiplied by hundred. Finally, the validity of this approach was carefully checked using rac-1@PDMS, where no CD signals were observed even under high α values (Fig. S2).
Influence of the mechanical stretching on the PDMS chains orientation. The orientation of the PDMS polymer under
unidirectional mechanical stretching of films was first investigated. This aspect was evaluated through the LB* measurement because LB* is the refractive index difference between the stretching axis and its 90° counterpart. We thus measured the LB values of undoped PDMS, 1@PDMS and
R-2@PDMS films at rest and at various α stretching ratio, up to
176% (Fig. 1a) and its evolution at λ=340 nm was plotted in Fig. 1b. As expected, strong LB* signals were recorded for all three films. In all cases, LB* spectra were nearly flat all along the spectral window studied between 260 and 380 nm, showing that the BINOL entities, mono or doubly crosslinked in the PDMS network, had no effect on the alignment of the host polymer chains in the stretching direction. Upon stretching from α=0 (when films were at rest), LB* increased linearly for stretching ratio α lower than 80% and the signal saturated with a maximum LB* value around 1 radian. Once again, this behavior was independent of the presence of BINOL and reflected an isotropic distribution of the PDMS chains at rest and an alignment along the stretching axis under high mechanical stress.
Influence of the mechanical stretching on the BINOL entities orientation. While LB, as a refractive index relative
measurement, probes the overall PDMS chain orientation, LD*, as an absorption-related measurement, was sensitive to specific chromophore anisotropy, yielding information about the BINOL orientation according to the stretching ratio α (0, 25, 50, 75 and 100%) applied to the host PDMS material.23 The evolution of normalized LD* measured for undoped PDMS, R-1@PDMS and R-2@PDMS films according to the stretching ratio α are given in Fig 1c. Mono-grafted R-2@PDMS and undoped@PDMS films showed LD* signals with intensities ten times weaker than with the double-grafted ones R-1@PDMS. In addition, the spectral profile measured from 260 to 380 nm of R-2@PDMS film was hardly discernable from the one obtained in the case of the undoped@PDMS film revealing that the main contribution in LD signals for the mono-grafted R-2@PDMS film came almost exclusively from the PDMS chains stretching. On the contrary, in the case of the doubly BINOL-grafted R-1@PDMS film, LD* signals were 1 to 2 order of magnitude higher and displayed absorption profile bands as those anticipated for BINOL-containing materials. The evolution of the LD* intensity versus stretching was very similar to that of the LB* versus stretching
4
for the PDMS@undoped films (Fig. 1d). These results highlighted that upon stretching, the mono-grafted BINOL did not follow the stream of the PDMS chains. Indeed, when the BINOLs were bound by only one side to the PDMS network through a long alkyl spacer, they have enough degree of freedom to orient themselves randomly, independently form the stretching state of the host material. Conversely for theR-1@PDMS film, double-grafted BINOL moieties aligned very well
with the stretching force applied on their both arms, thus following the alignment of the PDMS chains.
Conformational changes of grafted BINOL through the mechanical stretching of PDMS. CD variation is a powerful
tool to evaluate conformational variation of enantiopure compounds especially in the case of axial or helical chirality. In particular, CD activity of biaryl derivatives is known to be directly dependent on the dihedral angle between the aromatic planes and thus BINOL moiety constitutes an ideal probe for conformational changes measurement.20,24 CD* spectra of double-grafted BINOL, R-1@PDMS and S-1@PDMS films, were recorded (Fig. 2a) and showed a gradual decrease of the CD* signal intensity upon stretching for both enantiomers. The decrease in CD* intensity was linearly dependent with the increase of the stretching ratio α up to 100% before levelling off (Fig. 2b). This CD* variation was in agreement with a conformational change of the BINOL induced by stretching of the host PDMS elastomer. As observed for the LD*, there was no variation of the CD* spectrum upon stretching for the mono-grafted BINOL unit in R-2@PDMS or S-2@PDMS films (Fig. S3),
reflecting that their conformation around the chiral axis of the BINOL was not affected by the applied stretching force. The lack of CD* spectra variation provides a clear evidence that the conformation change of the double grafted BINOL was induced only by the application of a mechanical force through the covalent bonds, rather than other factors, such as localized heating or radical generation from polymer chain cleavage during mechanical deformation.
From macroscopic mechanical stretching to the molecular force applied. Further insights of the mechanical force-induced
BINOL conformational changes at the molecular level are obtained through QMC and MDS (see sections 8 and 9 in SI for details). We first optimized via QMC the conformations of the R-BINOL in which the naphthol groups are methoxylated (instead of a long alkyl chain) in order to reduce computational costs. In its most stable conformation the dihedral angle between both naphthalene rings was found to be -88.9° (Fig. S4). Starting from this conformation, the dihedral angle was then rotated by 30° in both clock and anticlockwise directions. Every 5° a geometry optimization was performed keeping the dihedral angle fixed. Hence a total of 11 conformers of R-BINOL with dihedral angles between -58.9° to -128.9° were obtained (Fig. S4 and section 9 in SI). CD spectra for every conformer was then calculated using the sTDA-xtb method.25 Comparison of these theoretical CD spectra with the experimental ones reported above when the
R-1@PDMS film was gradually stretched (Fig. 2a) shows marked
analogies for these conformers with a dihedral angle larger then -108.9 (Fig. 2c).
Figure 1. Optical linear anisotropy responses of R-1@PDMS and R-2@PDMS and undoped@PDMS films under uniaxial stretching: (a) LB spectra for various
stretching ratio α, (b) evolution of LB* with stretching ratio α at λ=340 nm (measurements on different samples were plotted), (c) LD* spectra for various stretching ratio and (d) evolution of LD* intensity (340 nm) versus the stretching ratio α. Points having same color indicate different measurements the same α value of
5
Figure 2. (a) CD* spectra over the stretching ratio α applied to R-1@PDMS and S-1@PDMS films; (b) Evolution of CD* intensity at ~270 nm inR-1@PDMS as a function of the stretching ratioα; (c) Computed CD spectra of the various R-BINOL conformers as a function of the dihedral angle (DA) between the binaphthyl-binaphthyl rings; (d) Computed intensity of the two CD bands located at 270 nm (black square) and 310 nm (black dot) as a function of the dihedral angle in R-BINOL from -58.9° to -128.9°. The white area fits with the expected evolution of CD band intensities when the dihedral angle was increasing.
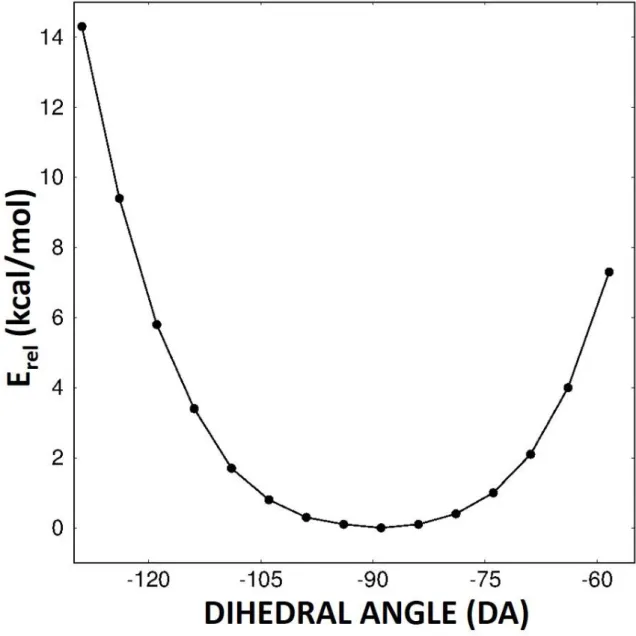
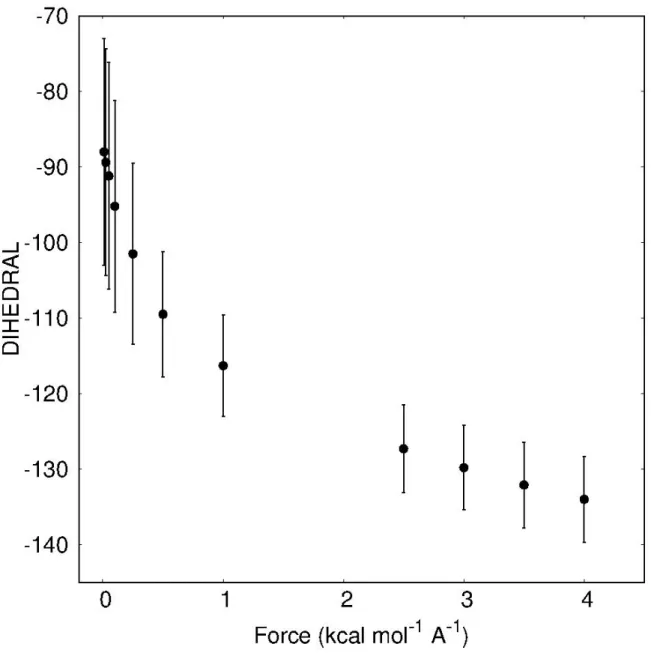
Indeed, we observed two positive maxima located at ~270 nm and at ~310 nm, with the former having a higher intensity than the latter. A minimum band was also observed at ~335 nm. By increasing the dihedral angle from -108.9° to -128.9° we observed a simultaneous decrease in the intensity of both maxima (white part of Fig. 2d). This is fully in line with the evolution of the experimental CD spectra when R-1@PDMS film was stretched (Fig. 2a and 2b). For conformers outside this dihedral angle range, i.e. from -58.9° to -108.9°, at least one of these features was missing (grey part in Fig. 2d). Thus, considering that in the R-1@PDMS film the BINOL dihedral angle should be at least at -108.9° when the elastomer was at rest, the macroscopic stretching up to 170% results in an increase of the dihedral angle, opening the two naphthyl rings like the opening wings of a butterfly. Evolution of the deformation energy upon variation of the dihedral angle of R-BINOL revealed that a 20° change in the dihedral angle required less than 2 kJ.mol-1 making this conformer largely accessible at room temperature (Fig. S5). The marked difference of the dihedral angle value of above -108.9° when the R-1@PDMS film was at rest and the -88.9° observed for the optimized structure in the gas phase may come from the fact that during the preparation of the material, the crosslinking step between BINOL derivatives 1 and PDMS chains imposed a mechanical tension on the biaryl structure, opening it up from -88.9° to above -109°. In order to have a rough estimation of the energy transferred at the molecular level when an external force is applied, we performed MDS studies in hexane. Hexane was chosen in order to take into account the highly hydrophobic feature of PDMS chains environment. A R-BINOL with octyl chains linked to each naphthol group was used as a model structure, and an external force in the range of 0.0001 to 4 kcal*mol-1*Å-1 was applied to both terminal methyl carbon atoms of the octyl chains. Each force was directed along the line linking both atoms with opposite directions. Increasing the force applied lead first to a reduction of the mobility of the octyl chains which align along the pulling line and only in a second stage, to the deformation of the dihedral angle of the R-BINOL moiety (Fig. 3a). A force value of about 2.5 kcal*mol-1*Å-1 (~175 pN) was strong enough to open
the dihedral angle up to ~130° connecting so the stretching ratio α and the force felt by the BINOL at the molecular scale. Further increasing the applied force up to 4.0 kcal*mol-1*Å-1 (~280 pN) did only lead to an additional increase in the dihedral angle of about 5° (Fig. S5) which may explain why no significant variation of the experimental CD spectra was observed for stretching the R-1@PDMS film above 100%.This behavior can be explained by the steric hindrance which prevents BINOLs to open more while the PDMS chains can still be stretched over longer distances.
Soft-mechanochemistry allows reversible and repeatable
processes. When the R-1@PDMS film was stretched, the
dihedral angle of the BINOL was increased and that value was kept as long as the elastomer was in the stretched state. To investigate the reversibility of the conformational change upon stretching, we carried out series of LD, LB CD and absorption measurements according to the stretching-releasing cycles realized using R-1@PDMS and S-1@PDMS. All LD, LB, CD, and absorption were recovered after the releasing of the mechanical stress and no hysteresis was observed, showing the ability of the polymer network to get back to its initial architecture. These data were used to extract CD* values evolution according
6
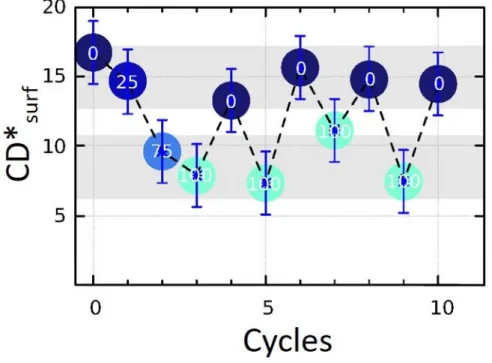
to the stretching ratio α (Fig. 3b and Fig. S6). First, we observed that increasing α always lead to lower absolute CD* values. Importantly, when returning at rest between stretching steps, initial CD* values were recovered, highlighting the reversibility of the molecular conformation change through the mechanical stretching-releasing cycles of the material. This reversibility shows that the conformation change is only induced by the transduction way going from the macroscopic mechanical force to the BINOL.Figure 3. (a) Cumulated views of the R-BINOL molecule during the 25 ns of
MD simulation (one snapshot taken every 0.1ns) in hexane. The different views correspond to the various magnitudes of the forces applied at the terminal carbon of each alkyl chain. The black arrows schematically indicate the direction of the force applied. For each simulation the average dihedral angle as well as the fluctuation calculated over the whole trajectory are reported; (b) CD* intensity measured at 280 nm during stretching-releasing cycles of S-1@PDMS. Values written in each circle indicate the stretching ratio α applied. Error bars have been calculated from at least three measurements.
Conclusion
The control of conformation changes using a macroscopic mechanical force as external stimulus was already reported in crystals but showing very low variation due to their highly rigid nature.17,18 Using more flexible systems and also well-ordered Langmuir-Blodgett 2D films, conformational changes of biaryl-derived surfactants through compression forces allowed a 10° variation of the dihedral angle.19,20 In this work, we demonstrated the possibility to tune the molecular conformation of BINOL crosslinked within a 3D polymer architecture through a macroscopic stretching force applied unidirectionally to the material. Using PDMS as host system, a BINOL probe was disorderly distributed everywhere in the polymer network
through a double crosslinking. Thanks to a simple and effective optical measurement set-up, we measured LB, LD and CD through the transparent elastomer according to the stretching degree applied to get information about both the polymer chains and BINOL conformations. The PDMS chains aligned with the stretching direction and when stretched up to ~170%, the dihedral angle between the naphthyl-containing plans of BINOL was estimated to open up from ~110° to ~130°. Less than 2.5 kcal*mol-1*Å-1 was required to ensure this conformational switch of 20° in DA allowing thus a reversibility of the process when the mechanical stress was released, as expected for bioinspired soft-mechanical systems.11 The tuning of the BINOL
conformation was controlled through the value of the stretching ratio applied. In addition to the reversibility observed, all measurements were also repeatable, thus offering an external and easy-to-use mechanical tuning of atropisomers conformation. This paves the way towards the design of original catalytic or chiroptical materials, fields in which our groups are currently involved.
Acknowledgements
This work was financially supported by the Agence Nationale de la Recherche (project “MECHANOCAT” ANR-15-CE29-0015-02), the Fondation pour la Recherche en Chimie (FRC, project number PSC-005), the Labex Chimie des Systèmes Complexes. S.Z. acknowledges the ANR for her postdoc fellowship. The ICS microscopy platform and the ICS characterization platform are acknowledged. A.C. acknowledges the HPC-Unistra for GPU time. Karim Benmlih is acknowledged for his technical help in the design and the buildup of the stretching device. We would like to thank S. Hoshang for providing us with the Scheme 1.
Conflict of interest
The authors declare no competing financial interest.
Keywords: Mechanochemistry • Stimulus-Responsive Materials • Conformation • Circular Dichroïsm • Chirality
[1] J. Conyard, A. Cnossen, W. R. Browne, B. L. Feringa, S. R. Meech, J.
Am. Chem. Soc. 2014, 136, 9692–9700; B. S. L. Collins, J. C. M. Kistemaker, E. Otten, B. L. Feringa, Nat. Chem. 2016, 8, 860-866; Y.-L. Wu, F. Ferroni, S. Pieraccini, W. B. Schweizer, B. B. Frank, G. P. Spada, F. Diederich, Org. Biomol. Chem. 2012, 10, 8016-8026; B. A. San Jose, J. Yan, K. Akagi, Angew. Chem. Int. Ed. 2014, 53, 10641-10644; Angew. Chem. 2014, 126, 10817-10820; B. V. Rokade, P. J. Guiry, ACS Catal. 2018, 8, 624–643; Y.-M. Li, F.-Y. Kwong, W.-Y. Yu, A. S. C. Chan, Coord. Chem. Rev. 2007, 251, 2119-2144; J. M. Brunel,
Chem. Rev. 2005, 105, 857–898; S. Dong, X. Feng, X. Liu, Chem. Soc.
Rev. 2018, 47, 8525–8540.
[2] J. W. Grate, G. C. Frye, Sensors Update, Vol. 2 (Eds.: H. Baltes, W. Göpel, J. Hesse), Wiley-VCH, Weinheim, 1996, 10-20.
[3] C. J. Cobley, R. D. J. Froese, J. Klosin, C. Qin and Gregory T. Whiteker,
Organometallics 2007, 26, 2986-2999; G. Bringmann, A. J. Price
Mortimer, P. A. Keller, M. J. Gresser, J. Garner, M. Breuning, Angew.
Chem. Int. Ed. 2005, 44, 5384-5427; Angew. Chem. 2005, 117,
7
[4] (a) K. Mislow, W. A. W. Glass, R. E. O’Brien, P. Rutkin, D. H. Steinberg, J. Weiss, C. Djerassi, J. Am. Chem. Soc. 1962, 84, 1455-1478; (b) L. Jierry, S. Harthong, C. A. Aronica, J.-C. Mulatier, L. Guy, S. Guy, Org.
Lett. 2012, 14, 288-291; (c) L. Guy, M. Mosser, D. Pitrat, J.-C. Mulatier,
M. Kukulka, M. Srebo-Hooper, E. Jeanneau, A. Bensalah-Ledoux, B. Baguenard, S. Guy, J. Org. Chem. 2019, 84, 10870-10876.
[5] S. Pascal, C. Besnard, F. Zinna, L. Di Bari, B. Le Guennic, D. Jacquemin, J. Lacour, Org. Biomol. Chem. 2016, 14, 4590-4594. [6] H. Isla, M. Srebo-Hooper, M. Jean, N. Vanthuyne, T. Roisnel, J. L.
Lunkley, G. Muller, J. A. Gareth Williams, J. Autschbach, J. Crassous,
Chem. Commun. 2016, 52, 5932-5935; C. Shen, G. Loas, M.
Srebro-Hooper, N. Vanthuyne, L. Toupet, O. Cador, F. Paul, J. T. Lopez Navarrete, M. Vallet, J. Crassous, Angew. Chem. Int. Ed. 2016, 55, 8062-8066; Angew. Chem. 2016, 128, 8194-8198.
[7] A. Robinson de Souza, V. F. Ximenes, N. H. Morgon, ACS Symposium
Series, Washington DC, 2017; T. Kosaka, S. Iwai, Y. Inoue, T. Moriuchi,
T. Mori, J. Phys. Chem. A 2018, 122, 7455-7463.
[8] M. K. Beyer, H. Clausen-Schaumann, Chem. Rev. 2004, 105, 2921-2948 ; M. M. Caruso, D. A. Davis, Q. Shen, S. A. Odom, N. R. Sottos, S. R. White, J. S. Moore, Chem. Rev. 2009, 109, 5755-5798; S. L. James, T. Frisic, Chem. Soc. Rev. 2013, 42, 7494-7496 ; B. Lee, Z. B. Niu, S. L. Craig, Angew. Chem. Int. Ed. 2016, 55, 13086-13089; Angew. Chem.
2016, 128, 13280-13283; C. Calvino, L. Neumann, C. Weder, S.
Schrettl, J. Pol. Sci, Part A : Pol. Chem. 2017, 55, 640-652.
[9] D. A. Davis, A. Hamilton, J. L. Yang, L. D. Cremar, D. Van Gough, S. L. Potisek, M. T. Ong, P. V. Braun, T. J. Martinez, S. R. White, J. S. Moore, N. R. Sottos, Nature 2009, 459, 68-72; N. Bruns, K. Pustelny, L. M. Bergeron, T. A. Whitehead, D. S. Clark, Angew. Chem. Int. Ed. 2009,
48, 5666-5669; Angew. Chem. 2009, 121, 5776-5779; Y. L. Chen, A. J.
H. Spiering, S. Karthik eyan, G. W. M. Peters, E. W. Meijer, R. P. Sijbesma, Nat. Chem., 2012, 4, 559−562; E. Ducrot, Y. L. Chen, M. Bulters, R. P. Sijbesma, C. Creton, Science 2014, 344, 186−189; T. Friscic, C. Mottillo, H. M. Titi, Angew. Chem. Int. Ed. 2020, 59, 1018-1029; Angew. Chem. 2020, 132, 1030-1041; D. Tan, F. Garcia, Chem.
Soc. Rev. 2019, 48, 2274-2292.
[10] V. Vogel, M. Sheetz, Nat. Rev. Mol. Cell Biol. 2006, 7, 265-275; V. Vogel, Annual Review of Biophysics and Biomolecular Structure, Palo Alto, 2006, 35, 459.
[11] P. Lavalle, F. Boulmedais, P. Schaaf, L. Jierry, Langmuir 2016, 32, 7265-7276.
[12] T. Mori, K. Okamoto, H. Endo, J. P. Hill, S. Shinoda, M. Matsukura, H. Tsukube, Y. Suzuki, Y. Kanekiyo, K. Ariga, J. Am. Chem. Soc. 2010,
132, 12868-12870.
[13] J. N. Brantley, C. B. Bailey, J. R. Cannon, K. A. Clark, D. A. Vanden Bout, J. S. Brodbelt, A. T. Keatinge-Clay, C. W. Bielawski, Angew.
Chem. Int. Ed. 2014, 53, 5088-5092; Angew. Chem. 2014, 126,
5188-5192; J. Longo, C. Yao, C. Rios, N. T. T. Chau, F. Boulmedais, J. Hemmerlé, P. Lavalle, S. M. Schiller, P. Schaaf, L. Jierry, Chem.
Commun. 2015, 51, 232-235.
[14] D. Mertz, C. Vogt, J. Hemmerlé, J. Mutterer, V. Ball, J.-C. Vogel, P. Schaaf, P. Lavalle, Nat. Mater. 2009, 8, 731-735; C. Rios, J. Longo, S. Zahouani, S. Zahouani, T. Garnier, C. Vogt, A. Reisch, B. Senger, F. Boulmedais, J. Hemmerlé, K. Benmlih, B. Frisch, P. Schaaf, L. Jierry, P. Lavalle, Chem. Commun. 2015, 51, 5622-5665.
[15] J. Davila, A. Chassepot, J. Longo, F. Boulmedais, A. Reisch, B. Frisch, F. Meyer, J.-C. Voegel, P. J. Mésini, B. Senger, M.-H. Metz-Boutigue, J. Hemmerlé, P. Lavalle, P. Schaaf, L. Jierry, J. Am. Chem. Soc. 2012,
134, 83−86; S. Zahouani, A. Chaumont, B. Senger, F. Boulmedais, P. Schaaf, L. Jierry, P. Lavalle, ACS Appl. Mater. Interfaces 2016, 8, 14958-14965.
[16] H. Doan, S.L. Raut, D. Yale, M. Balaz, S.V. Dzyuba, Z. Gryczynski,
Chem. Commun., 2016, 52, 9510-9513.
[17] B. Nordén, S. Seth, Biopolymers 1979, 18, 2323-2339.
[18] M. A. Garcia-Garibay, Angew. Chem. Int. Ed. 2007, 46, 8945-8947;
Angew. Chem. 2007, 119, 9103-9105; K. Nagura, S. Saito, H. Yusa,
H. Yamawaki, H. Fujihisa, H. Sato, Y. Shimoikeda, S. Yamaguchi, J.
Am. Chem. Soc. 2013, 135, 10322-10325; G. F. Liu, J. Liu, Y. Liu, X. T.
Tao, J. Am. Chem. Soc. 2014, 136, 590-593.
[19] T. Michinobu, S. Shinoda, T. Nakanishi, J. P. Hill, K. Fujii, T. N. Player, H. Tsukube, K. Ariga, J. Am. Chem. Soc. 2006, 128, 14478-14479. [20] D. Ishikawa, T. Mori, Y. Yonamine, W. Nakanishi, D.L. Cheung, J.P. Hill,
K. Ariga, Angew. Chem. Int. Ed. 2015, 54, 8988–8991; Angew. Chem.
2015, 127, 9116-9119.
[21] B. Norden, J. Phys. Chem. 1977, 81, 151-159; Y. Shindo, M. Nakagawa,
Rev. Sci. Instr. 1985, 56, 32-39; J. Schellman, H. P. Jensen, Chem. Rev.
1987, 87, 1359-1399; R. Kuroda, T. Honma, Chirality 2000, 12, 269-277.
[22] Y. Shindo, M. Nishio, S. Maeda, Biopolymers 1990, 30, 405-413. [23] A. Rodger, G. Dorrington, D. L. Ang, Analyst, 2016, 141, 6490-6498. [24] S. F. Mason, R. H. Seal, D. R. Roberts, Tetrahedron 1974, 30,
1671-1682; R. Kuroda, S. F. Mason, Tetrahedron 1981, 37, 1995-999. [25] S. Grimme, C. Bannwarth, J. Chem. Phys. 2016, 145, 054103.
8
Entry for the Table of Contents
Crosslinking BINOL derivatives within a 3D chemical polymer network allows the reversible and repeatable tuning of their molecular dihedral angle through macroscopic mechanical stretching of the material. This soft-mechanotransduction was studied using simple and effective optical measurements of LB, LD and CD of the host material and correlated with quantum molecular calculations and molecular dynamic simulations.
9
Supporting Information
Reversible Soft-mechanochemical control of biaryl conformations
through crosslinking in a 3D macromolecular network
Julien Kelber,
aAmina Bensalah-Ledoux,
bSarah Zahouani,
aBruno Baguenard,
bPierre Schaaf,
a,cAlain
Chaumont,
dStephan Guy*
band Loïc Jierry*
aMaterials and method ... 11
1. List of chemicals and abbreviations ... 11
2. Synthesis and characterization of rac-1, R-1, S-1, rac-2, R-2 and S-2 ... 12
BINOL S-1: 2,2'-bis(dec-9-en-1-yloxy)-1,1'-binaphthalene ... 13
BINOL S-2: 2'-(dec-9-en-1-yloxy)-[1,1'-binaphthalen]-2-ol ... 18
3. General procedure to prepare PDMS films ... 22
4. Stretching device ... 23
5. Optical measurements ... 23
6. Nuclear Magnetic Resonance (NMR) ... 25
7. High Resolution Mass Spectroscopy (HRMS) ... 25
8. Molecular Dynamic Simulation (MDS) ... 25
9. Quantum Mechanical Calculations (QMC) ... 26
Figure S1: (a) UV Absorption and the (b) corresponding CD spectra of PDMS@R-1,
PDMS@S-1 and PDMS@rac-1. (c) UV Absorption and the (d) corresponding CD spectra of
PDMS@R-2, PDMS@S-2 and PDMS@rac-2. ... 27
Figure S2: LB, LD and CD spectra of PDMS@rac-1 film at rest and when stretched up to
180%. ... 28
Figure S3: Evolution of the CD spectra of PDMS@R-2 and of PDMS@S-2 upon stretching
... 29
Figure S4: Deformation energy (kcal/mol) as a function of the dihedral angle between both
naphthalene groups. (The most stable configuration was arbitrarily set to 0.)... 30
10
Figure S5: Variation of the dihedral angle as a function of the external force applied to the
terminal carbon of both octyl chains. Fluctuations observed were given as error bars. 31
Figure S6: CD* intensity measured at 280 nm during stretching-releasins cycles of
R-1@PDMS. Values written in each circle indicate the stretching ratio α applied. Error bars
were calculated from at least three measurements. ... 32
11
Materials and method
1. List of chemicals and abbreviations
All chemicals used in this work are gathered in the following table. They were all used as received,
without further purifications.
Name, acronym
(abbreviation)
Molecular weight
(g.mol
-1)
Supplier
CAS Number
R-BINOL
286.32
TCI
18531-94-7
S-BINOL
286.32
TCI
18531-99-2
rac-BINOL
286.32
Sigma-Aldrich
602-09-05
10-Bromo-dec-1-ene
219.16
Sigma-Aldrich
62871-09-4
Potassium carbonate
138.21
Fischer Scientific
584-08-7
Acetone
58.08
Carlo Erba
67-64-1
Dichloromethane (DCM) 84.93
Carlo Erba
75-09-2
Cyclohexane (Cy)
84.16
Carlo Erba
110-82-7
12
2. Synthesis and characterization of rac-1, R-1, S-1, rac-2, R-2 and S-2
All modified binols were synthesized from their commercially available enantiopure BINOL precursor
following a statistical addition of 1.5 eq. of 10-bromo-dec-1-ene (See Scheme 2 in the manuscript) and
subsequent purification of mono- and di-substituted derivatives by chromatography. For example,
BINOL derivative R-2 and R-1 (corresponding to (R)-2'-(dec-9-en-1-yloxy)-[1,1'-binaphthalen]-2-ol and
(R)-2,2'-bis(dec-9-en-1-yloxy)-1,1'-binaphthalene respectively) were synthesized as described here
below:
10-bromo-dec-1-ene (501 mg ; 2.29 mmol ; 1.5 eq.), (R)-Binol (435 mg ; 1.52 mmol ; 1.0 eq.), and
potassium carbonate (522 mg ; 2.38 mmol ; 1.6 eq) were refluxed in acetone for one day. After cooling
back to room temperature, 100mL of DCM and 20 mL of saturated aqueous NH
4Cl were added. The
organic layer was collected and the organic phase was extracted twice more with 100mL of DCM.
Organic phases were combined, dried over magnesium sulfate, filtered and evaporated to dryness. The
obtained oil was then purified using flash chromatography [Column: 30µm spherical silica/25g.
Elution: Cy 5CV => 95/5 Cy/DCM 11CV => 90/10 Cy/DCM 11CV => 75/25 Cy/DCM 11CV)]. First
fraction ((R)-2,2'-bis(dec-9-en-1-yloxy)-1,1'-binaphthalene) was collected from 8 to 14 CV (100mg ;
0.18mmol ; 12%), second fraction ((R)-2'-(dec-9-en-1-yloxy)-[1,1'-binaphthalen]-2-ol) was collected
from 20 to 25 CV (459 mg ; 1.08 mmol ; 71%).
13
BINOL S-1: 2,2'-bis(dec-9-en-1-yloxy)-1,1'-binaphthalene
1H NMR (400 MHz, CDCl
3) δ (ppm) : 0.91 (quintuplet,
3J=7.2Hz, 4H, H
24,H
25H
24‘,H
25‘), 1.01 (m, 8H,
H
20,H
21,H
22,H
23,H
20‘,H
21‘,H
22‘,H
23‘), 1.14 (quintuplet, 4H,
3J=8.0 Hz; H
19,H
18,H
19‘,H
18‘), 1.32 (quintuplet,
4H,
3J=8.0 Hz, H
16,H
17,H
16‘,H
17‘), 1.38 (quintuplet, 4H,
3J=8.0 Hz, H
15,H
14,H
15‘,H
14‘), 2.03 (ttd, 4H, resp.
3J=6.9, 1.5, 6.7 Hz; H
12,H
13,H
12‘,H
13‘), 3.91 (td, 2H,
3J=6.3 Hz
2J= 9.4Hz, H
11,H
11‘) ), 3.95 (td, 2H,
3J=6.3 Hz;
2J= 9.4Hz, H
10,H
10‘), 4.95 (tdd, 2H, resp.
4J=1.5 Hz;
3J=10.2 Hz;
2J= 1.5Hz, H
9,H
9‘) ), 5.01
(tdd, 2H, resp.
4J=1.5 Hz;
3J=16.9 Hz;
2J= 1.5Hz, H
8,H
8‘), 5.82 (tdd, 2H, resp.
3J=6.7, 16.9, 10.2 Hz,
H
7,H
7‘), 7.19 (m, 2H, H
6,H
6‘), 7.19 (dd, 2H,
4J= 2.0 Hz,
3J= 5.9 Hz, H
5,H
5‘), 7.30 (ddd, 2H,
4J= 2.0 Hz,
3J=8.2, 5.9 Hz, H
4,H
4‘), 7.40 (d, 2H,
3J= 9.0 Hz; H
3,H
3‘), 7.84 (br d, 2H,
3J= 8.2 Hz, H
2,H
2‘), 7.91 (d, 2H,
3J= 9.0 Hz, H
1,H
1‘);
13C NMR (100 MHz, CDCl
3) δ (ppm) : 25.71, 29.05, 29.08, 29.19, 29.40, 29.51,
33.93, 69.86, 114.24, 115.98, 120.85, 123.49, 125.62, 126.12, 127,87, 129.12, 129.37, 134.34, 139.33,
154.65; R
f(DCM 1:1 Cy) = 0.57; HRMS (ESI/Q-TOF) m/z: [M + K]
+Calculated for C
40H
50O
2Na
601.3428; Found 601.3442.
15
RMN
13C (100MHz)
in CDCl
318
BINOL S-2: 2'-(dec-9-en-1-yloxy)-[1,1'-binaphthalen]-2-ol
1H NMR (400 MHz, CDCl
3) δ (ppm) : 0.97-1.06 (m, 6H, H
27,H
28,H
29,H
30,H
31,H
32), 1.15 (quintuplet,
3J=7.0Hz, 2H, H
25,H
26), 1.32 (quintuplet,
3J=7.0Hz, 2H, H
23,H
24), 1.45 (m, 2H, H
21,H
22), 2.03
(quadruplet, 2H,
3J=7.0 Hz, H
19,H
20), 3.97 (td, 1H, resp.
3J=6.3 Hz;
2J= 9.4Hz, H
18), 4.00 (td, 2H,
3J=6.3
Hz;
2J= 9.4Hz, H
17), 4.96 (dd, 1H,
3J=10.2 Hz;
2J=1.5 Hz, H
16), 4.98 (br, 1H, H
15), 5.02 (dd, 1H,
3J=17.0
Hz;
2J=1.5 Hz, H
14), 5.82 (tdd, 1H, resp.
3J=6.8, 10.2, 17.0 Hz, H
13), 7.07 (d, 1H, 8.5Hz, H
12), 7.21
(ddd, 1H,
4J=1.3Hz,
3J=8.5, 6.8Hz, H
11), 7.23 (dd, 1H,
4J=1.3Hz,
3J=8.4Hz, H
10), 7.29 (ddd, 1H,
4J=1.3Hz,
3J=8.6, 6.6Hz, H
9), 7.31 (ddd, 1H,
4J=1.3Hz,
3J=8.0, 7.6Hz, H
8), 7.36 (d, 1H,
3J=8.8Hz, H
7),
7.38 (ddd, 1H,
4J=1.3Hz,
3J=8.0, 6.7Hz, H
6), 7.45 (d, 1H,
3J=9.0Hz, H
5), 7.86 (d, 1H,
3J=8.4Hz, H
4),
7.90 (m, 2H, H
3,H
2), 8.01 (d, 1H,
3J=9.0Hz, H
1).
13C NMR (100 MHz, CDCl
3) δ (ppm) : 25.62, 29.03,
29.05, 29.11, 29.30, 29.34, 33.92, 69.86, 114.23, 115.36, 115.76, 116.45, 117.56, 123,22, 124.30,
125.08, 125.16, 126,35, 127.31, 128.14, 128.25, 129.22, 129.63, 129.74, 130.96, 133.98, 134.21,
139.39, 151.39, 155.67; R
f(DCM 1:1 Cy) = 0.49; HRMS (ESI/Q-TOF) m/z: [M + Li]
+;
Calculated for
C
30H
32LiO
2431.2546 Found 431.2558.
20
RMN
13C (100MHz)
in CDCl
322
3. General procedure to prepare PDMS films
Doped-poly(dimethylsiloxane) were prepared using a mixture of viscous base (part A), the curing agent
(part B) and the corresponding Chromophore (part C) in a rate of 415:45:1. The mixture was vigorously
stirred with a glass stick for 5 minutes and centrifuged at 2000 rpm for 30 minutes. Then, the
transparent and air free solution was poured into polycarbonate molds (see picture below) and cured
overnight at 70°C on a flat surface. Carefully, they were unmold and washed, first with a solution of
dodecanethiol in n-heptane (1 %) for 1 h and then two times with only n-heptane for 1h each time. This
washing process removed the remaining unreacted chains and the Pt catalyst from the material. Finally,
they were dried in the oven at 70°C for 3h. The poly(dimethylsiloxane) PDMS obtained was a
transparent and elastic material that was stored avoiding contact with dust.
Polycarbonate molds used for the curing of PDMS films
The suitable PDMS samples for optical measurements were sliced from the so-prepared PDMS sheets
using a scalpel blade. To avoid any border effect, the sample of PDMS was taken in the middle part of
the PDMS as shown below.
23
4. Stretching device
The homemade stretching device is made of stainless steel and allows manual stretching of the sample
in uniaxial direction. Pictures are given below. The level of stretching α is expressed as a percentage of
the initial length: for instance, stretch at 100% means to a doubling of the initial length of the material.
5. Optical measurements
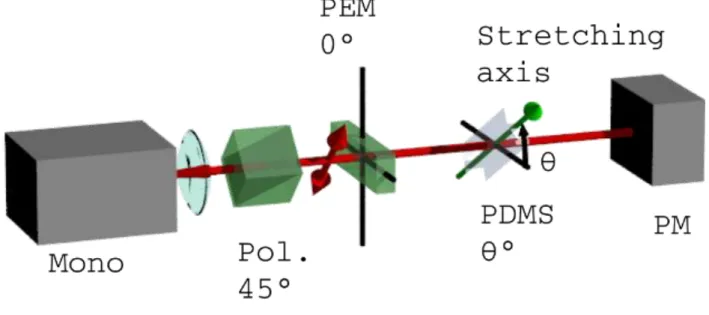
We have recently built our own polarimeter (Fig. A.) capable to measure linear and circular
birefringences and dichroisms, in order to fully characterize solution and thin film samples. Light
polarization is modulated by mean of a linear polarizer followed by the photo-elastic modulator (PEM)
driven at 50kHz. The transmitted light from the sample is Fourier analyzed to get the CD and LD
signals at 50 and 100kHz respectively. A second polarizer can be inserted between the sample and the
photo-detector to record the linear birefringence (LB) at 50kHz and the circular one (CB) at 100Hz, if
the signal is strong enough.
The PDMS films are hold by the two edges on a mechanical stretcher mounted on a rotating stage.
The main film faces are perpendicular to the optical beam and the angle θ of the stretch axis relative to
the PEM main axis can be adjusted with the rotating stage.
Measuring the linear anisotropies is quite simple: the stretching axis is oriented at 45°, LD is
measured at 2F and LB at 1F with a polarizer acting as an analyser after the sample. The order of
magnitude of these linear anisotropies are LB∈ [0;1] and LD∈ [0;10
-2]. CD is measured at 1F without
analyzer. Its values are much lower, typically in the order of 10
-3, which makes their measurements
much more complicated and requires many precautions and checking to avoid artifacts. Using Mueller
matrix approach, the recorded CD signal can be computed taking into account the sample properties as
well as unwanted apparatus limitations. The apparent CD (1f signal) is therefore calculated as the sum
of three terms (without the Bessel correcting factor):
[1, 2, 3]CD
app=U CD+CD
false(θ)+CD
bl(1)
The first term is the molecular CD scaled by a factor U=sin(LB)/LB. This cannot be neglected here
because it ranges between 1 and 0.84 for our maximum stretching measurements. The second term of
the measured CD represents the false CD coming from coupling between sample linear anisotropies
(LB and LD) with nonideal characteristics of the PEM (static birefringence α) and photodetector linear
dicroism (LD
PDand LD’
PD)
[3,4]. It is given in Eq.2. The last term is the CD base line coming from the
coupling between the two instrumental limitations.
[5]24
We should emphasize here, that we do not have false CD coming from the mixing of the LD and LB
of the samples. Indeed, these terms noted “LDLB’-LD’LB” in different papers vanish completely for
uniaxal chiral optical materials with light propagation perpendicular to the OA.
[2]It allows us to play
with the rotating angle to record true CD spectra. Inspection of CD
false(θ) straightly shows that it nearly
vanishes for θ=0 and the remaining signal is driven by the linear dichroism of the photodetector. This
can be efficiently minimized by selecting and tilting the appropriate detector with least polarization
characteristics.
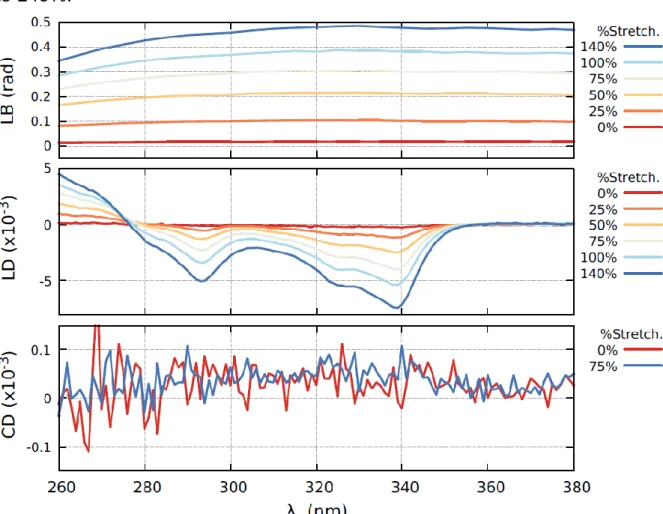
[6]This analysis was experimentally checked on a racemic sample stretched at 100%. We measure LB
(at 1F detection, with analyser), LD (at 2F, no analyzer) and “CD” (1F, no analyzer) for different
orientations of the sample. The spectra are displayed in Fig. B. The LB and LD signals depend on the
rotation and are maximized at 45, as expected. The bottom panel displays spectra in the standard CD
configuration (1F detection, no analyser). Apparent CD signals, about 10 times lower than LD, are
recorded although we use a racemic sample. These false CD spectra present roughly the same angular
dependence as the LD and LB signals, as described by Eq. 1. For θ=0, this false CD is nearly eliminated,
only the base line remains, in the order of 10
-5. Thus, by measuring the CD in this configuration, we
obtain a CD spectra free of artefacts.
To resume, three optical configurations are used to measure accurately the optical parameters LD,
LB and CD:
• LD (2F, no analyzer) and LB (1F, with analyzer) are measured as for an achiral uniaxial crystal by orienting
the OA at 45° relative to the PEM axis. Practically, this angle 45° is obtained by maximizing the LB signal.
• CD (1F, no analyzer) is then measured by orientating the sample at 0. The U factor is taken into account
from LB spectra. Spectra are then shifted to 0 for λ>365nm to take into account the small (<10
-5) baseline
shift.
Figure A: Home-made polarimeter set-up: Optical components and axis definition. Mono: double grating monochromator, Pol.: polarizer, PEM: Photo-elastic Modulator, PM: Photomultiplier
Figure B: Recorded signals on the locking detectors for different rotating angle θ of a racemic double grafted BINOLS in PDMS stretched at twice its initial length. (a) LB configuration: a polarizer is inserted between the sample and the detector, 1F
25
detection; (b) LB configuration: no polarizer after the sample, 2F detection; (c) CD configuration: no polarizer after the sample, 1F detection.