Coupled Dynamics and Economic Analysis of
Floating Wind Turbine Systems
by
Elizabeth Wayman
B.S., Civil and Environmental Engineering
Massachusetts Institute of Technology, 2004
Submitted to the Department of Mechanical Engineering
in partial fulfillment of the requirements for the degree of
Master of Science in Mechanical Engineering
at the
Massachusetts Institute of Technology
June 2006
C Massachusetts Institute of Technology, 2006. All rights reserved.
A uthor ...
Department of M{echanical Engi/eering
,-l'-WayA5
2006
C ertified by ...
Accepted by ...
MASSACHUSETTS INSTfflTE OF TECHNOLOGYIJUL
1
4
2006
Paul D. Sclavounos
Professor of Mechanical Engineering
Thesis Supervisor
Lallit Anand
Chairman, Departmental Committee on Graduate Students
Department of Mechanical Engineering
Coupled Dynamics and Economic Analysis of Floating Wind
Turbine Systems
by
Elizabeth Wayman
Submitted to the Department of Mechanical Engineering on May 12, 2006, in partial fulfillment of the
requirements for the degree of
Master of Science in Mechanical Engineering
Abstract
Against the backdrop of rising oil prices and increasing uncertainty in the future of energy and the health of the environment, wind energy is distinguished as a leading technology that is both technologically and economically viable for large-scale non-petroleum and non-polluting energy generation. The deployment of wind energy technology on floating platforms in deep water offshore environments has emerged as a forward-thinking application of this technology.
This thesis takes some early steps toward the development of innovative and cost-effective floating platforms to support a 5-MW wind turbine for deployment in water depths of 30 - 300 meters. A tool for performing a coupled structural, hydrodynamic, and aerodynamic analysis of floating wind turbine systems in the frequency domain was developed and is presented. This analysis tool includes the effects of the gyroscopic loads of the wind turbine rotor on the tower and floater, the aerodynamic damping introduced by the wind turbine rotor, the hydrodynamic added mass and damping introduced by wave-body interactions, and the hydrodynamic forces caused by wave excitation.
This analysis tool was applied to several structures representing excerpts of the design space of structures capable of supporting large wind turbines. The structures were evaluated on their dynamic performance in several environmental conditions and on their installed cost. An economic analysis was also carried out to determine the cost of the floating platform for the wind turbine per kWh of electricity generated.
Thesis Supervisor: Paul Sclavounos
Acknowledgments
I am sincerely grateful to my thesis advisor and professor, Professor Paul Sclavounos, for his role in my education at MIT. He began as my UROP advisor, and gave me the opportunity to work on a project that truly excited me, and shared with me his time and his knowledge.
As my thesis advisor and professor, he gave me the opportunity to continue to work on the project to which I had been introduced as an undergraduate, he shared with me a wealth of knowledge, and he provided guidance through the nebulous challenges of research. Professor Sclavounos has also worked to create and maintain relationships with other researchers in wind energy, which has not only enriched my experience, but has strengthened the wind energy research community in New England and worldwide. I would also like to express my gratitude toward Mr. Jason Jonkman, Mr. Sandy Butterfield, Mr. Walter Musial, and Dr. Robert Thresher for their support of my research and for the contribution of their time and expertise. Their hospitality at the National Renewable Energy Laboratory in Boulder, CO., their active role in the project, and their thorough review and support of my work is very much appreciated.
Finally, I would like to thank Mr. Kwang Lee for his tireless patience and his endless willingness to address any question or contribute to this work in any way.
Funding for this study has been provided by the U.S. Department of Energy under NREL Subcontract No. RFP RAM-3-33200 (Offshore Floating Wind Turbine Concepts. Fully Coupled Dynamic Response Simulations).
Contents
Abstract ... 3 Contents ... 7 List of Figures ... I 1 List of Tables ... 13 Part I... 17Background and Setup ... 17
1. Introduction and M otivation ... 17
2. Overall Study A pproach ... 19
3. M odel Com ponents and A ssum ptions ... 20
3.1 Coordinate System and Modes of System Motion ... 20
3.2 5-M egaW att W ind Turbine... 22
Part 2 ... 25
Initial D esign and the Steady-State... 25
4. D esign for Steady-State Perform ance... 25
5. U nderstanding Steady-State Restoring in Pitch... 27
5.1 Restoring from W aterplane Area... 27
5.2 Restoring from Ballast ... 29
5.3 Restoring from M ooring Lines ... 31
5.4 Total Restoring and the Restoring Coefficient in Pitch... 32
5.5 Restoring Properties in Pitch of a Surface-Piercing Cylinder ... 34
6. Steady-State D esign and Optim ization ... 35
6.1 Optim ization of the Spar and Barge... 37
6.2 Optim ization of the Tri-Floater... 40
6.3 Optim ization of the TLP ... 41
6.3.1 Platform Shape... 41
6.3.2 Platform Subm ersion D epth... 41
6.3.3 Tether Tension ... 42
7. Final D esigns and First Order Cost Com parison ... 46
Part 3 ... 53
Design Refinement & Coupled Dynamic Analysis Methodology... 53
8. Structures for Dynam ic Analysis... 53
8.1 M IT/N REL SDB ... 53
8.2 M IT/N REL TLP's... 55
8.3 N REL TLP's ... 59
9. Static and Dynam ic Analysis M ethodology ... 60
9.1 Steady-State Operating Point... 62
9.2 Response A m plitude Operators ... 63
9.3 N atural Frequencies ... 65
9.4 Standard D eviation of System M otions ... 65
9.6 A nalysis Cases ... 68
9.6.1 Base Case... 68
9.6.2 W ater D epth Effects... 69
9.6.3 W ind Speed Effects... 69
9.6.4 V iscous D am ping Effects ... 70
Part4 ... 71
Coupled Dynam ic Analysis Results... 71
10. The M IT/N REL SD B ... 71
10.1 Base Case - Coupled Effects ... 71
10.1.1 Results... 71
10.1.2 D iscussion... 73
10.2 W ind Speed Effects... 74
10.2.1 Results... 74
10.2.2 D iscussion... 76
10.3 W ater D epth Effects... 77
10.3.1 Results... 77
10.3.2 D iscussion... 80
11. M IT/NREL TLP Surface ... 80
11.1 Base Case - Coupled Effects ... 80
11.1.1 Results... 80
11.1.2 Discussion ... 81
11.2 W ind Speed Effects... 82
11.2.1 Results... 82
11.2.2 Discussion ... 84
11.3 W ater D epth Effects... 85
11.3.1 Results... 85
11.3.2 D iscussion... 86
11.4 V iscous D am ping Effects ... 87
11.4.1 Results... 87
11.4.2 D iscussion... 88
12. M IT/N REL TLP Subm erged ... 89
12.1 Base Case - Coupled Effects ... 89
12.1.1 Results... 89
12.1.2 D iscussion... 90
12.2 W ind Speed Effects... 91
12.2.1 Results... 91
12.2.2 D iscussion... 92
12.3 W ater D epth Effects... 93
12.3.1 Results... 93
12.3.2 Discussion... 95
12.4 V iscous D am ping Effects ... 95
12.4.1 Results... ... 95
12.4.2 Discussion ... 97
12.5 Comparison of MIT/NREL TLP Surface and MIT/NREL TLP Submerged ... 97
13.1 Base Case - Coupled Effects ... 98
13.1.1 Results... 98
13.1.2 D iscussion... 99
13.2 W ind Speed Effects... 100
13.2.1 Results... 100
13.2.2 D iscussion... 101
13.3 W ater D epth Effects... 102
13.3.1 Results... 102
13.3.2 D iscussion... 104
13.4 V iscous D am ping Effects ... 104
13.4.1 Results... 104
13.4.2 D iscussion... 105
13.5 Comparison of NREL TLP TD 10 RB2 with MIT/NREL TLP Submerged ... 106
14. NREL TLP Tower Draft = 10, Reserve Buoyancy = 6 ... 107
14.1 Base Case - Coupled Effects ... 107
14.1.1 Results... 107
14.1.2 D iscussion... 108
14.2 W ind Speed Effects... 109
14.2.1 Results... 109
14.2.2 D iscussion... 111
14.3 W ater D epth Effects... 111
14.3.1 Results... 111
14.3.2 D iscussion... 113
14.4 V iscous D am ping Effects ... 113
14.4.1 Results... 113
14.4.2 D iscussion... 115
14.5 Comparison of the NREL TLP RB2 and the NREL TLP RB6 ... 115
15. Conclusions... 115
16. Cost of Energy A ssessm ent ... 119
17. Suggested Future W ork... 123
Appendix A : Hydrodynam ic Quantities ... 124
A .1 M IT/N REL SDB ... 125
A .2 M IT/N REL TLP Surface ... 128
A .3 M IT/N REL TLP Subm erged ... 131
A .4 N REL TLP RB=2 ... 134
A.5 N REL TLP RB= 6 ... 134
Appendix B : Cost Calculations... 140
B.I M IT/N REL SD B ... 140
B.2 M IT/N REL TLP Surface... 141
B.3 M IT/N REL TLP Subm erged... 142
B.4 N REL TLP RB=2... 142
B.5 N REL TLP RB=6... 144
List of Figures
Figure 1: Overall Study A pproach... 19
Figure 2. Coordinate System and Modes of System Motion... 21
Figure 3. Wind Speed Relationship Curves Characterizing the NREL Offshore Baseline 5-M W W ind T urbine ... 24
Figure 4. Restoring Through Waterplane Area... 28
Figure 5. Restoring from Waterplane Area Moment of a Canoe... 29
Figure 6. Restoring by Ballasting ... 30
Figure 7. Restoring Mechanisms and Representative Structures... 33
Figure 8. Structure Types that Span the Steady-State Stability Design Space ... 35
Figure 9. Total Cost of Concret-Ballasted Cylinders that Achieve Required Restoring in Pitch w ith N o M ooring Lines ... 39
Figure 10. Steady-State Operational Configuration of the TLP ... 43
Figure 11. Total Cost Breakdown of Initial Structures... 51
Figure 12. Cost of Construction for Initial Structures ... 51
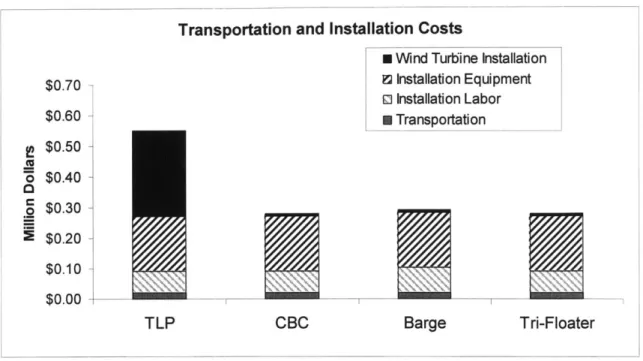
Figure 13. Mooring System and Mooring System Installation Costs for Initial Structures ... 5 2 Figure 14. Transportation and Installation Costs of Initial Structures... 52
Figure 15. Static and Dynamic Analysis Process ... 60
Figure 16 (a) - (e). Spectral Densities of the Sea States... 67
Figure 17 (a) -(f). RAOs, MIT/NREL SDB, Base Case ... 72
Figure 18 (a) -(f). RAOs, MIT/NREL SDB, Wind Speed Effects... 75
Figure 19. RAOs, MIT/NREL SDB, Water Depth Effects... 78
Figure 20. RAOs, MIT/NREL TLP Surface, Base Case ... 81
Figure 21. RAOs, MIT/NREL TLP Surface, Wind Speed Effects... 83
Figure 22 (a) - (c). RAOs, MIT/NREL TLP Surface, Water Depth Effects ... 85
Figure 23. RAOs, MIT/NREL TLP Surface, Viscous Damping Effects... 88
Figure 24. RAOs, MIT/NREL Submerged, Base Case ... 89
Figure 25. Natural Frequencies, MIT/NREL TLP Submerged, Base Case ... 90
Figure 26. RAOs, MIT/NREL TLP Submerged, Wind Speed Effects... 91
Figure 27. RAOs, MIT/NREL TLP Submerged, Water Depth Effects ... 94
Figure 28. RAOs, MIT/NREL TLP Submerged, Viscous Damping Effects... 96
Figure 29. RAOs, NREL TLP RB2, Base Case... 99
Figure 30. RAOs, NREL TLP RB2, Wind Speed Effects ... 100
Figure 31. RAOs, NREL TLP RB2, Water Depth Effects ... 103
Figure 32. RAOs, NREL TLP RB2, Viscous Damping Effects ... 105
Figure 33. RAOs, NREL TLP RB2, Base Case... 108
Figure 34. RAOs, NREL TLP RB6, Wind Speed Effects ... 110
Figure 35. RAOs, NREL TLP RB6, Water Depth Effects ... 112
Figure 36. RAOs, NREL TLP RB6, Viscous Damping Effects ... 114
Figure 37. RAOs for all Structures in the Base Case... 116
Figure 38. Total Cost Breakdown of Final Structures ... 120
Figure 40. Cost of the Mooring Systems and Mooring system Installation for the Final S tructu res ... 12 1
Figure 41. Cost of Transportation and Installation for the Final Structures ... 121
Figure 42. Total Cost Breakdown and COE Estimates for the Final Structures... 123
Figure A.1. Added Mass, MIT/NREL SDB, Base Case... 125
Figure A.2. Damping, MIT/NREL SDB, Base Case ... 126
Figure A.3. Exciting Forces, MIT/NREL SDB, Base Case... 127
Figure A.4. Added Mass Matrices, MIT/NREL TLP Surface, Base Case ... 128
Figure A.5. Damping Matrices, MIT/NREL TLP Surface, Base Case... 129
Figure A.6. Exciting Forces, MIT/NREL TLP Surface, Base Case ... 130
Figure A.7. Added Mass Matrices, MIT/NREL TLP Submerged, Base Case ... 131
Figure A.8. Damping Matrices, MIT/NREL TLP Submerged, Base Case... 132
Figure A.9. Exciting Forces, MIT/NREL TLP Submerged, Base Case ... 133
Figure A.10. Added Mass Matrices, NREL TLP RB2, Base Case... 134
Figure A. 11. Damping Matrices, NREL TLP RB2, Base Case... 135
Figure A.12. Exciting Forces, NREL TLP RB2, Base Case... 136
Figure A.13. Added Mass Matrices, NREL TLP RB6, Base Case... 137
Figure A.14. Damping Matrices, NREL TLP RB2, Base Case ... 138
List of Tables
Table 1. Gross Properties of the NREL 5-MW Offshore Wind Turbine... 23
Table 2. Description of Variables Characterizing the NREL 5-MW Offshore Baseline W ind T urbine ... 24
Table 3. Extreme Structures of the Concrete Ballasted Cylinder ... 39
Table 4. Properties of the Barge and the CBC... 40
Table 5. Properties of the Tri-Floater ... 40
Table 6. Properties of the TLP... 46
Table 7. Sum m ary of Structures ... 47
Table 8. Platform Cost Tables ... 49
Table 9. Properties of the MIT/NREL SDB ... 54
Table 10. Platform Properties of the MIT/NREL TLPs ... 58
Table 11. Operational Properties of the MIT/NREL TLPs... 58
Table 12. Platform Properties of the NREL TLPs... 59
Table 13. Operational Properties of the NREL TLPs ... 60
Table 14. Sea State D efinition ... 66
Table 15. Steady State Pitch, MIT/NREL SDB, Base Case ... 71
Table 16. Natural Frequencies, MIT/NREL SDB, Base Case... 71
Table 17. Standard Deviations of System Motions, MIT/NREL SDB, Base Case ... 71
Table 18. Steady-State Offset, MIT/NREL SDB, WInd Speed Effects ... 74
Table 19. Natural Frequencies, MIT/NREL SDB, Wind Speed Effects ... 74
Table 20. Standard Deviations of System Motions, MIT/NREL SDB, Wind Speed E ffects ... 7 6 Table 21. Natural Frequencies, MIT/NREL SDB, Water Depth Effects... 79
Table 22. Standard Deviations of System Motions, MIT/NREL SDB, Water Dpeth E ffects ... 79
Table 23. Steady-State Offset, MIT/NREL TLP Surface, Base Case ... 80
Table 24. Natural Frequencies, MIT/NREL TLP Surface, Base Case ... 80
Table 25. Standard Deviations of System Motions, MIT/NREL TLP Surface, Base Case ... 8 0 Table 26. Dynamic Tether Tensions, MIT/NREL TLP Surface, Base Case ... 81
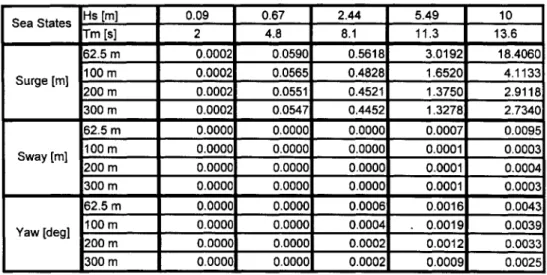
Table 27. Steady-State Offsets, MIT/NREL TLP Surface, Wind Speed Effects ... 82
Table 28. Natural Frequencies, MIT/NREL TLP Surface, Wind Speed Effects... 83
Table 29. Standard Deviations of System Motions, MIT/NREL TLP Surface, Wind Speed E ffects ... 84
Table 30. Dynamic Tether Tensions, MIT/NREL TLP Surface, Wind Speed Effects.... 84
Table 31. Steady-State Offsets, MIT/NREL TLP Surface, Water Depth Effects... 86
Table 32. Natural Frequencies, MIT/NREL TLP Surface, Water Depth Effects... 86
Table 33. Standard Deviations of System Motions, MIT/NREL TLP Surface, Water D epth E ffects ... 86
Table 34. Dynamic Tether Tensions, MIT/NREL TLP Surface, Water Depth Effects... 86
Table 35. Standard Deviations of System Motions, MIT/NREL TLP Surface, Viscous D am ping E ffects ... 87
Table 37. Standard Deviations of System Motions, MIT/NREL TLP Submerged, Base C ase ... 9 0
Table 38. Dynamic Tether Tensions, MIT/NREL TLP Submerged, Base Case ... 90
Table 39. Steady-State Offsets, MIT/NREL TLP Submerged, Wind Speed Effects ... 91
Table 40. Natural Frequencies, MIT/NREL TLP Submerged, Wind Speed Effects... 92
Table 41. Standard Deviations of System Motions, MIT/NREL TLP Submerged, Wind Speed E ffects ... 92
Table 42. Dynamic Tether Tensions, MIT/NREL TLP Submerged, Wind Speed Effects ... 9 2 Table 43. Steady-State Offsets, MIT/NREL TLP Submerged, Water Depth Effects... 93
Table 44. Natural Frequencies, MIT/NREL TLP Submerged, Water Depth Effects... 93
Table 45. Dynamic Tether Tensions, MIT/NREL TLP Submerged, Water Depth Effects ... 9 4 Table 46. Standard Deviations of System Motions, MIT/NREL TLP Submerged, Water D epth E ffects ... 95
Table 47. Standard Deviations of System Motions, MIT/NREL TLP Submerged, V iscous D am ping Effects ... 96
Table 48. Steady-State Offsets, NREL TLP RB2, Base Case ... 98
Table 49. Natural Frequencies, NREL TLP RB2, Base Case... 98
Table 50. Standard Deviations of System Motions, NREL TLP RB2, Base Case... 98
Table 51. Dynamic Tether Tensions, NREL TLP RB2, Base Case ... 98
Table 52. Steady-State Offsets, NREL TLP RB2, Wind Speed Effects... 101
Table 53. Natural Frequencies, NREL TLP RB2, Wind Speed Effects ... 101
Table 54. Standard Deviations of System Motions, NREL TLP RB2, Wind Speed Effects ... 10 1 Table 55. Dynamic Tether Tensions, NREL TLP RB2, Wind Speed Effects... 101
Table 56. Steady-State Offsets, NREL TLP RB2, Water Depth Effects... 102
Table 57. Natural Frequencies, NREL TLP RB2, Water Depth Effects ... 102
Table 58. Standard Deviations of System Motions, NREL TLP RB2, Water Depth E ffects ... 10 3 Table 59. Dynamic Tether Tensions, NREL TLP RB2, Water Depth Effects... 104
Table 60. Standard Deviations of System Motions, NREL TLP RB2, Viscous Damping E ffects ... 104
Table 61. Steady-State Offsets, NREL TLP RB6, Base Case ... 107
Table 62. Natural Frequencies, NREL TLP RB2, Base Case... 107
Table 63. Standard Deviations of System Motions, NREL TLP RB6, Base Case... 107
Table 64. Dynamic Tether Tensions, NREL TLP RB6, Base Case ... 107
Table 65. Steady-State Offset, NREL TLP RB6, Wind Speed Effects ... 109
Table 66. Natural Frequencies, NREL TLP RB6, Wind Speed Effects ... 109
Table 67. Dynamic Tether Tensions, NREL TLP RB6, Wind Speed Effects... 109
Table 68. Standard Deviations of System Motions, NREL TLP RB6, Wind Speed Effects ... 1 10 Table 69. Steady-State Offsets, NREL TLP RB6, Water Depth Effects... 111
Table 70. Natural Frequencies, NREL TLP RB6, Water Depth Effects ... 111
Table 72. Standard Deviations of System Motions, NREL TLP RB6, Water Depth E ffects ... 1 12 Table 73. Standard Deviations of System Motions, NREL TLP RB6, Viscous Damping
E ffects ... 1 14 Table 74. Standard Deviations of System Motions for all Systems in the Base Case... 117
Part
1
Background and Setup
1.
Introduction and Motivation
Wind energy has been among the fastest-growing energy technologies in the United States, with recent growth rates of 30 - 43% per year [2]. Advancements in technology and economies of scale have lowered the cost of wind energy to around $0.04/kWh, making the technology competitive with natural gas [5].
The deployment of wind energy technology on land, however, faces some challenges. For instance, the richest on-land wind resource in the U.S. lies in North and South Dakota, thousands of miles from the large load centers of the East and West coasts. Another challenge is the lack of social acceptance of large wind farms in certain areas.
Five to fifty miles off the East coast of the United States lies another rich wind resource, with an estimated capacity near 1 TW [22]. This resource presents an opportunity for offshore wind energy projects that will be closer to the load centers, but far enough from shore to be out of sight of potentially objecting coastal residents.
The sites with the best resource and the least visibility from shore mostly lie in water depths of over 30 m. At these depths, the current practice of installing wind turbines on monopiles that are driven into the seabed becomes economically infeasible. The deployment of wind power technology on floating platforms offers a promising solution to the challenge of utilizing deepwater wind resources.
While the development of on-land, and potentially shallow-water, wind energy projects will continue to be prosperous and successful in the near future, the wind industry has begun to consider the deployment of wind energy technology in deeper waters on floating
platforms as a forward-thinking solution to some of the challenges facing on-land and shallow-water wind energy. Furthermore, in many European countries where land is much less available, the wind industry and the local governments have already made moves toward offshore wind energy development.
Previous simulation studies by J. E. Withee [21], K. H. Lee [9] and [10], and K. C. Tong [17] show promising results for the behavior of floating wind turbine systems. However, the full coupling between the wind turbine and the floating platform has been simulated only to a limited extent, and the optimal design concept for these systems remains unknown. Furthermore, the chore of installing a wind turbine onto a floating platform at
sea may make the cost of this technology prohibitive.
This study, therefore, has four goals:
1.) To make a preliminary step toward coupling proven codes from the wind power industry with codes from the offshore oil and gas industry to create a tool for modeling and analyzing coupled wind turbine and floating platform systems. 2.) To understand the design space of platforms that achieve total system stability,
and to identify the most cost-effective structures in that design space.
3.) To study and understand the behavior of these coupled systems in various wind and wave environments.
4.) To identify systems that avoid the need to install the wind turbine on the platform while at sea, and compare them to systems that require turbine installation at sea.
The approach taken to achieve these goals consists of two main phases; an initial design and steady-state analysis phase, and a design refinement and dynamic analysis phase. The initial design phase concludes with a preliminary cost assessment, which indicates the most viable candidates to be passed to the second phase. At the conclusion of the second phase, a more detailed cost assessment is carried out for the final structures, resulting in a cost of energy assessment. This process is outlined in the following section.
2. Overall Study Approach
To achieve the goals set forth, the study first examines the mechanisms that provide restoring to a structure to allow the structure to achieve acceptable steady-state performance. With this knowledge, the design space of structures that achieve adequate steady-state performance is mapped out. A static design process is carried out to evolve structures from this space that are of relatively low cost and promise to provide adequate restoring for the system to achieve an acceptable steady-state operating point once installed. These structures are passed to a static analysis phase where the steady-state operating points in various wind speeds are evaluated. Next, the systems and their steady-state operating conditions are passed to a dynamic analysis phase where their dynamic properties, including the systems' response amplitude operators (RAOs), natural frequencies, and the standard deviations of motions in various wind speeds and sea states, are calculated. Finally, an economic analysis is performed to determine the cost of each structure per MWh. This process is carried out for systems that achieve enough stability to be towed to the installation locations while fully assembled, and for systems that are only stable once moored and must be assembled at sea. This general process is outlined in Figure 1.
Figure 1: Overall Study Approach
3. Model Components and Assumptions
The physical models used in this study consist of 3 major components; the floating platform, the wind turbine, and the mooring system. These systems are analyzed separately, then considered together, as will be explained in Section 9. The model of the floating platform and mooring system change with each design concept, and will be explained in the relevant section. The sections below describe the assumptions about the motions of these systems, and also detail the wind turbine chosen for this study.
3.1
Coordinate System and Modes of System Motion
The combined wind turbine and floating platform system is assumed to undergo rigid body motions in the standard modes of motion that are considered in wave-body interaction theory, translational and rotational motions along the x, y, and z axes. Modes 1-3 are the translational modes of surge, sway, and heave, and represent translation along the x, y, and z axes, respectively. Modes 4-6 are the rotational modes of roll, pitch, and yaw, and represent rotation about the x, y, and z axes, respectively.
The origin of this coordinate system is taken as the x and y locations of the floating platform's center of gravity, on the calm water surface; the z = 0 plane coincides with the calm water surface. Throughout the static and dynamic analyses, the wind and the ambient waves are assumed to be aligned and to propagate in the positive x direction.
Figure 2. Coordinate System and Modes of System Motion
The equations of motion governing the rigid-body motions of a floating consist of standard Newtonian equations of motion, and are summarized in matrix form below, describing the 6 modes of motion.
(M + A) (t) + Be (t)+ C (t) = aXewi
The symbols in this equation have the following meaning:
= The 6 by 1 vector describing the system's displacement in the 6 modes of motion. = The 6 by 1 vector describing the system's velocities.
= The 6 by 1 vector describing the system's accelerations.
o = Wave frequency.
M = The 6 by 6 mass matrix.
.. ... . ... ... . ... . . .... ... ... . .... ...
A = The 6 by 6 added mass matrix. B = The 6 by 6 damping matrix.
C = The 6 by 6 restoring (stiffness) matrix. a = The wave amplitude.
X = The 6 by 1 vector of exciting forces and moments on the system.
The displacements, velocities, and accelerations are defined as follows.
(t)
Re I e'"I= Re{i cEe'"}
(t)=
Re{ -c e'"}Substituting these expressions into the first equation, and taking the wave amplitude as unity, the equations of motion can be summarized in the frequency domain as below.
-aO (M + A
(co))+
icB(co)+
C]E
(co)= X (co)These equations of motion describe the system's rigid-body response to regular, plane progressive waves within linear theory. As explained in forthcoming sections, properties of the wind turbine, floating platform, and mooring system define the mass, added mass, damping, restoring matrices, and exciting forces, and compose the model of the combined wind turbine floating platform system. These equations of motion are evaluated to give the combined system motions in various conditions.
3.2
5-MegaWatt Wind Turbine
A wind turbine with a power rating of 5 MW was chosen as the wind turbine for the design of the floating structures in this study because it is speculated that 5 MW is the minimum power rating at which deepwater offshore wind energy can be cost effective.
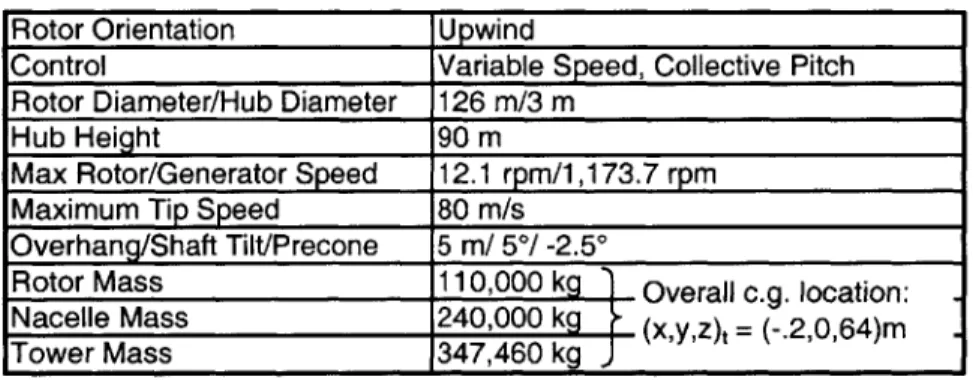
At the time of the undertaking of this study, wind turbines with a power rating of 5 MW had not yet been developed. Therefore, the wind turbine model used in this study is the NREL 5-MW Offshore Baseline Wind Turbine model. This model does not correspond to an existing wind turbine, but its properties are drawn and extrapolated from operating machines and conceptual studies to create a realistic representation of a three-bladed upwind 5-MW wind turbine. Its general properties are described in Table 1. The details and rationale for this model are given by NREL in [6].
Table 1. Gross Properties of the NREL 5-MW Offshore Wind Turbine
Rotor Orientation Upwind
Control Variable Speed, Collective Pitch Rotor Diameter/Hub Diameter 126 m/3 mn
Hub Height 90 M
Max Rotor/Generator Speed 12.1 rpm/1, 173.7 rpm Maximum Tip Speed 80 mn/s
Overhang/Shaft Tilt/Precone 5 mn/ 5*/ -2.5*
Rotor Mass 110,000 kg Overall c.g. location: Nacelle Mass 240,000 k xyz)t = (-.2,0,64)m .
Tower Mass 347,460 kg
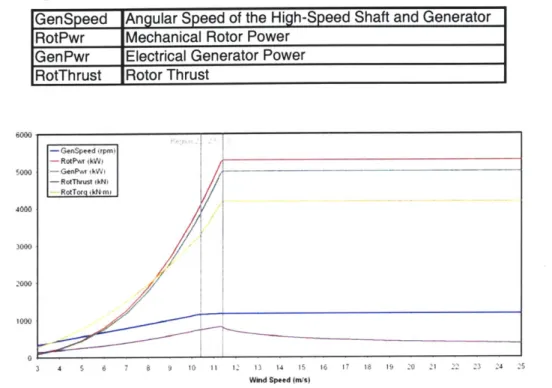
This model was analyzed by NREL using the wind turbine code FAST (Fatigue, Aerodynamics, Structures, and Turbulence) [5] to obtain various operational characteristics. The operational characteristics over the machine's operational wind speeds that are relevant to this study are summarized in Table 2 and Figure 3 [6].
The power curve, shown in green in Figure 3, is often used to characterize a wind turbine and wind speeds. The power curve has 3 main regions. Region 1 refers to wind speeds between zero and the cut-in wind speed that are too low for the wind turbine to operate, and is not depicted in Figure 3. The cut-in wind speed is the wind speed at which the turbine begins to operate. Region 2 begins at the cut-in wind speed, and refers to the wind speeds where the turbine's power increases with the wind speed. The highest wind speed in region 2 is the rated wind speed, or the wind speed at which the turbine generates the power for which the wind turbine is rated. In region 3, the wind turbine
maintains constant power production as the wind increases by adjusting the pitch angle of the blades to allow for power to pass by. The highest wind speed of region 3 represents
the cut-out wind speed, or the speed beyond which the wind turbine completely feathers its blades, as to not capture any power. This is done to protect the wind turbine during extreme winds. Region 2.5 shown on Figure 3 is the region of wind speeds preceding the rated wind speed, where the system begins to adjust for region 3.
Table 2. Description of Variables Characterizing the NREL 5-MW Offshore Baseline Wind Turbine
GenSpeed Angular Speed of the High-Speed Shaft and Generator RotPwr Mechanical Rotor Power
GenPwr Electrical Generator Power
RotThrust Rotor Thrust
6000 - GenSpeed irpm) - RoiPwm ikWV 5000 -GenP kI --RotThrust kNJ - RotTorq ikN-mi 4000 3000 1000 3 4 5 6 7 8 9 10 it 1' 13 14 15 16 17 18 I9 20 21 2 23 24 75 Wind Sp.ed (ms)
Figure 3. Wind Speed Relationship Curves Characterizing the NREL Offshore Baseline 5-MW Wind Turbine
To capture the performance of the coupled systems throughout the operational spectrum of the wind turbine, the systems were analyzed at four wind speeds, 9, 11.2, 15, and 25 m/s, which are drawn from each region of the power curve. The wind speed of 9 m/s represents region 2 of the power curve, and the wind speed at which the turbine is operating at roughly half of the system's rated power. The wind speed of 11.2 m/s represents the turbine's rated wind speed, the speed where the turbine first reaches its rated power. The wind speed of 15 m/s represents region 3 of the power curve, where the wind turbine feathers its blades to maintain rated power, and the speed of 25 m/s represents the cut-out wind speed, the highest wind speed where the turbine is in operation.
Part 2
Initial Design and the Steady-State
4. Design for Steady-State Performance
The rigid body motions of a floating system that are developed above are reproduced here.
-w2(M +
A(w))+icB(co)+C](w)=
X (w)The motions described by this system of equations are used to evaluate the system performance in steady wind and regular waves.
The first criteria, however, that drives the design of the platforms is the steady-state static performance of the combined wind turbine floating platform system. The combined system is designed to demonstrate favorable steady-state static performance in its installed state, about which the system oscillates in response to random waves. Therefore, before a system can be considered for dynamic motion, it must first demonstrate acceptable steady-state performance.
In steady-state, velocities and accelerations are zero, and the dynamic exciting forces and moments are replaced by steady-state forces and moments. The equations of motion then reduce to the equation of static equilibrium given below.
C (w) = Fstedv
State
The critical steady-state offset for floating wind turbine systems is the offset in pitch. The offset of the system in pitch not only brings the structure closer to capsizing, but also
compromises the efficiency of the wind turbine and introduces complicated loading to the wind turbine by causing the rotor to be at an angle relative to the inflow. For platforms with stiff mooring systems that do not allow pitch, the critical offset becomes the offset in surge, which will be described in later sections.
The system's steady-state pitch, e5, is determined by the steady-state moment exerted on the system in pitch, F5, and the system's restoring properties in pitch, C55, as given in the
equation below.
= F
C55
F5 is the moment that the thrust force, FT,,s,, makes about the origin by exerting a force
at the location of the hub, ZHub. This is given in the equation below.
F =Fh ZHub
By limiting the structure's steady-state pitch to a certain threshold, a minimum value of restoring in pitch can be calculated that will serve as a design parameter. It is speculated that beyond a pitch angle of 10 degrees, the wind turbine will lose substantial efficiency. Therefore, the threshold pitch value in this study was taken as 10 degrees. The maximum wind loading was taken as 800,000 N, which is the steady state thrust at a wind speed of 11.2 m/s and acts on the wind turbine hub, at ZHub, which equals 90 m. The necessary
restoring coefficient is found by solving for the restoring coefficient needed to limit the pitch to 10 degrees, as shown here.
C5 = 5 FTh,,, x Z,,,b - 800,000 x 90 [N -m] 4.126E+08 [N-m]
s 5,11,w
.1745
[-1The value of restoring in pitch calculated through the method above serves as the preliminary design parameter for candidate structures to support the 5-MW wind turbine.
5.
Understanding Steady-State Restoring in
Pitch
To understand the design space of structures that could achieve acceptable steady-state performance in pitch, it was necessary to understand the methods through which structures achieve steady-sate restoring. Restoring in pitch is achieved through three general mechanisms: waterplane area, ballast, and the mooring system. These mechanisms are described below, and can serve as a classification of floating structures, as developed Butterfield et al. in [1].
5.1
Restoring from Waterplane Area
Restoring from a structure's waterplane area is provided by the moment that the structure's waterplane area makes about the structure's center of rotation, which is assumed to coincide with the structure's coordinate system origin as described in Figure 2. Waterplane area moment about the x and y axes are given by the equations below, and the effect of waterplane area moment on a structure's restoring is shown in Figure 4.
M, = ffx2dS
M Wl= fy2dS
S in this integral represents the waterplane area surface, when the structure is not offset in pitch or roll.
The dotted line on the structure in Figure 4 represents the structure's waterplane. For small angles of deflection in pitch, the shape of the waterplane is relatively constant.
z AF
S
AF
Figure 4. Restoring Through Waterplane Area
When the structure is perturbed in pitch, one side of the structure is submerged, and the other side is elevated from the water. The submerged side experiences an increase in buoyant mass, as a larger volume of water is displaced on that side. The other side experiences a decrease in buoyant mass, as a smaller volume of water is displaced on that side, equal to the increase on the other side. These increases and decreases in buoyant mass result in increases and decreases in buoyant force, AF. The moment the waterplane area makes about the y axis determines the moment that results from these AF forces. This moment opposes the moment exerted on the body to displace it in pitch, and results in a restoring moment. This restoring moment is given by the following equation.
MResongWPx (pg x2dS) sin ,
MRestoringWP,y (pg J 2dS sin
Employing the small angle approximation, these equations reduce to the following expressions.
M ResongWP -(pg Jfx2dS) ,
M Resto, WPy --(pg Jfy2dS)
... ... . .... .. .. ..
For a cylinder as shown in Figure 4, or other axisymetric bodies, restoring in pitch is equal to restoring in roll. This is because the waterplane area is symmetric about the x and y axes and thus creates an equal moment about both axes.
The effect of waterplane area symmetry on a structure's restoring can be illustrated by a canoe shown in Figure 5. Due to the long, slender shape of the canoe, the waterplane area moment about the x axis is significantly lower than the waterplane area moment about the y axis. As a result, the canoe is strongly restored about the y axis, but weakly restored about the x axis.
Figure 5. Restoring from Waterplane Area Moment of a Canoe
5.2
Restoring from Ballast
Restoring by ballast is achieved when enough ballast is added to the structure to lower the center of gravity to a location below the center of buoyancy. Restoring is then provided by the vertical separation between the structure's center of gravity and the structure's center of buoyancy. The restoring effect due to ballast then combines with the
x x
Stable
...
restoring effect of waterplane area to form hydrostatic and inertial restoring. Hydrostatic and inertial restoring is illustrated in Figure 6.
ME FB FG z z Gsin(, ZCBsin(O) 0 / 4- - -I /
Figure 6. Restoring by Ballasting
As shown in Figure 6, when the system is offset in pitch, the buoyant force acting on the center of buoyancy creates a moment about the origin, and the gravitational force acting on the center of gravity creates a moment in the opposite direction about the origin. For a freely floating structure, the gravitational force is equal to the buoyant force, and the vertical distance between the center buoyancy and the center of gravity results in a net moment that has the tendency to restore the system to its vertical position when the system is offset in pitch.
When the system is offset in pitch, the waterplane area causes the center of buoyancy to shift toward the side of the structure that is submerged. This effect is captured by the
waterplane area component of restoring discussed in the previous section. The combined hydrostatic and inertial restoring moment is given by the equation below.
MRcs,,fig,,,,,,t, = M B gZC. sin - M(;gZ(; sin , + (pg ffx2dS)sin ,
where MG, MB, ZCG, ZCB represent the gravitational and buoyant masses, and the centers of gravity and buoyancy respectively. Employing small angle approximations, this moment reduces to the following equation.
A oI,,,,, I,,,, = ( MigZ eT -M (gZ(( +pg x2dS ){
5.3
Restoring from Mooring Lines
Restoring by mooring lines is provided by the moment that the mooring lines exert on the structure due to a displacement in pitch. The effect that the mooring lines have on the restoring properties of the structure is dependent on the mooring line configuration.
For slack mooring systems with catenary mooring lines, the restoring in pitch can be crudely modeled as the product of weight of the lines in water and the draft of the fairleads. The levels of restoring in pitch provided by catenary mooring systems are negligible compared to the amount of restoring required for structures capable of supporting large wind turbines. The restoring in pitch from catenary mooring lines is therefore taken as zero, and the structure itself is required to provide adequate restoring.
For tension leg mooring systems, as developed by Newman [13] and Faltinsen [3], the magnitude of restoring provided is dependent on the stiffness of the mooring system and the radial location of the fairleads where the mooring lines attach to the structure. The
C55Li,Ten,,,nL,,jg =2 (EA")Tth (R + L) + FTthersT
4th R +F
In this equation, (EA)Tethers is the product of the elastic modulus and the cross sectional
area of the tethers, LTetlers is the unstretched length of the tethers, R is the cylinder radius,
LLe, is the length of the leg to which the line is attached, FTe,ers is the total force exerted
by the tethers, and T is the cylinder draft (or the vertical distance to the tether fairlead).
The equation above for restoring provided by a tension leg mooring system shows that the restoring coefficient in pitch is dependent upon the elastic properties of the mooring system. The scope of this study, however, includes only the rigid body motions of the system, and does not include elastic effects. Therefore, the mooring lines of a tension leg mooring system are taken to be infinitely stiff, with an infinite elastic modulus.
The infinite stiffness of the mooring lines prevents any significant motion in pitch, roll, and heave, and the platform's motions are therefore limited to surge, sway, and yaw. The mooring system must then be designed to adequately limit motions in these modes.
5.4
Total Restoring and the Restoring Coefficient in
Pitch
Contributions to restoring from waterplane area, ballast, and mooring lines combine to result in the total restoring properties of a floating platform. The restoring coefficient is defined to characterize the total restoring properties due to the system's offset in pitch. As developed in the previous sections, the restoring moment that the structure experiences due to its geometry and its offset in pitch is summarized below.
This equation shows that the restoring moment that the structure experiences is proportional to the offset in pitch. The restoring coefficient is that coefficient of proportionality, and is given below.
C55 = (M gZ8 - MgZ + pg Jfx2dS) + Cnes
C55,Lines describes the restoring provided by just the mooring lines, and is taken as zero for
catenary systems and is assumed to be infinite for tension leg systems.
Conceptually, these three restoring mechanisms can be epitomized by three extreme structures: a shallow drafted barge representing restoring by waterplane area moment, a ballasted deep-drafted spar representing restoring by ballasting, and a Tension Leg Platform (TLP) that represents restoring by the mooring system. These restoring methods and their representative structures are shown in gray in Figure 7.
I
Barge TLP Mooring
System
Figure 7. Restoring Mechanisms and Representative Structures
In reality, no structure can perfectly isolate a single restoring mechanism. Instead, structures achieve their restoring through a combination of these mechanisms. In the steady-state optimization phase, this study considers the entire design space spanned by the triangle in Figure 7 to determine the lowest-cost structures that meet the steady state performance criteria. The lowest-cost structures are then passed to subsequent analysis phases where the structures are further evaluated.
The following sections outline the steady-state optimization process and the resulting structures.
5.5
Restoring Properties in Pitch of a
Surface-Piercing Cylinder
The methods of restoring mentioned above can be expressed mathematically for any structure. For a surface-piercing cylinder, restoring in pitch is given by the following equation.
C5 5 = (MB gZ(, - MG;gZ,(; + pg Jfx2dS) + C55, ues
For a surface-piercing cylinder, the equation above is evaluated to give the following expression.
C,, = M ZCB - MG CG + Pg-±C5 5 Lines
4
6. Steady-State Design and Optimization
The goal of this phase was to identify the types of structures that demonstrate acceptable steady state performance in their installed state by achieving the required restoring in pitch at the lowest cost. To accomplish this, a selection of structure types was chosen such that the design space depicted in Figure 7 was well represented. Within each structure type, a basic optimization was performed to identify the lowest cost structure representative of that type. A first order cost analysis was then performed on each structure considering materials, construction, and installation required for each structure to identify which structures were most promising on a cost-basis. These structures were then passed to the dynamic analysis phase for further evaluation.
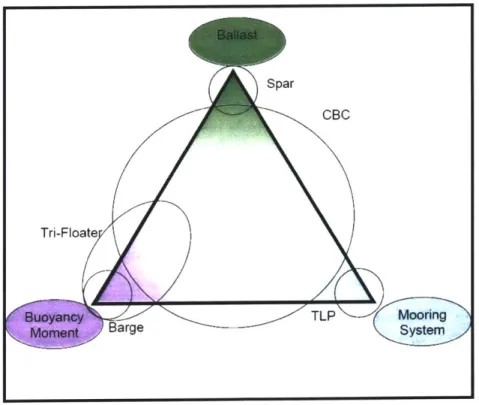
The structures chosen to span the design space were the spar, the barge, the tri-floater, the TLP, and the concrete-ballasted cylinder (CBC). These structures are indicated on Figure 8 and are defined below.
Spar
CBC
Tri-Floate
TLP Mooring
Barge System
Figure 8. Structure Types that Span the Steady-State Stability Design Space
* Spar: Long slender ballasted cylinder that has enough ballast to lower the center of gravity below the center of buoyancy. Mooring lines provide station-keeping only. Hence, the gravitational and buoyant forces are approximately equal and restoring is provided by vertical separation between the structure's center of gravity and center of buoyancy. Because the mooring lines play a minimal role in providing steady-state restoring, the wind turbine can be installed to the platform in the shipyard, and the system can be towed to its operational location already assembled.
" Barge: Shallow-drafted cylinder with a very large waterplane area. Mooring lines provide station keeping only. Restoring is provided by the structure's large waterplane area. Because the system achieves adequate restoring without its mooring lines, the system can be towed to its operational location with the wind turbine already installed. The platform may include some ballasting to achieve the desired draft.
* Tri-Floater: Three surface-piercing cylinders that are joined in a triangle formation, with the cylinders spread out from the center. Mooring lines provide station-keeping only. Restoring is provided by the moment that the waterplane area makes about the system's center of rotation, created by a combination of the total waterplane area and the radial distance between the waterplane area of the cylinders and the center of rotation. The system can be towed to its operational location with the wind turbine already installed. The cylinders my include some ballasting to achieve the desired draft, and to limit the radial separation of the cylinders.
* TLP: A buoyant cylinder that is held at its draft by its tension leg mooring system. The tension leg mooring system provides significant downward force and restoring. The TLP can be submerged below the waterline to reduce wave loading. Because restoring is provided primarily by the mooring lines, this structure will not support a wind turbine without its lines. This structure will require the turbine to be installed to the platform while at sea, after the platform has been deployed and secured to its mooring lines.
* CBC: A surface-piercing cylinder that achieves adequate restoring through a mix between ballast, waterplane area, and mooring lines. Depending on this mix, the system may or may not be capable of being towed to its operational location with the turbine already installed to the platform.
An optimization of each structure was performed by solving for the platform geometry that achieves the required restoring to ensure acceptable steady-state performance of the system in operation. Because the groups of structures considered utilize different mechanisms of restoring as their primary restoring mechanism, the method used to optimize the structure within each structure group varied from group to group. Each distinct method and considerations are explained below.
6.1
Optimization of the Spar and Barge
The spar and the barge structures are intended to achieve adequate restoring without contributions from the mooring lines. Because mooring lines provide station-keeping functions only, these systems are designed to achieve restoring through ballasting and waterplane area only, respectively. Due to the lack of contribution from the mooring lines, the spar and the barge structure types are actually extreme examples of the concrete-ballasted cylinder with no mooring lines. For this reason, they may be optimized with the same method and considerations.
As developed above, by restricting the steady-state offset in pitch at the maximum thrust, a minimum value required for C55 can be obtained.
C = = Fh,,, xZ,,, 800,000 x 90 [ N m =4 12 6E+0 8
C5 5- F., .1745 [-]
The restoring in pitch of a surface-piercing cylinder, in the absence of mooring lines is given by the following equation.
C5 5,H&I =FZC -MG CG +gZ pg R
4
The optimal size and shape are determined by solving for the platform geometry that causes the platform to achieve the desired value of a restoring coefficient. For a concrete-ballasted surface-piercing cylinder, the geometry consists of defining the radius,
R, the height of the cylinder, H, and the height of the internal concrete ballast, h, which
are imbedded in the equation above in the ZCB, FB, MG, and ZCG terms.
Although the spar and the barge structures are intended to isolate the ballasting and waterplane area restoring methods, respectively, it is not physically possible for a structure completely isolate these methods. The spar buoy must pierce the surface of the water, and therefore can not avoid a small contribution of waterplane area to its total restoring. Likewise, the barge must achieve a realistic draft, and therefore must contain some ballast, which also contributes to its total restoring.
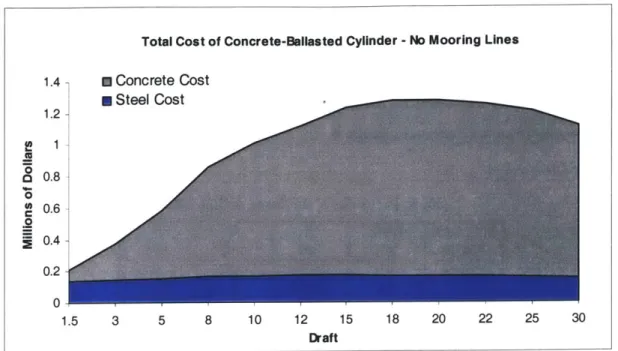
With this in mind, a range of geometries that satisfy the requirement for restoring were found. This was accomplished by setting the draft to a range of realistic values, and solving for the radius and the height of the concrete ballast required to achieve the target restoring, and to satisfy the balance between buoyant and gravitational forces. To arrive at the lowest cost structure, the cost associated with each geometry were then evaluated by assuming a cost per kilogram for steel and concrete, then calculating the mass of steel and concrete in each geometry, and calculating the total cost. The costs of steel and concrete were assumed to be $700/ton and $1 00/ton respectively.
The total material costs of these geometries found at each depth are summarized in Figure 9.
Total Cost of Concrete-Ballasted Cylinder -No Mooring Lines 1.4- m Concrete Cost m Steel Cost 1.2-o0.8 0 0.6-0 0.2 0 1.5 3 5 8 10 12 15 18 20 22 25 30 Draft
Figure 9. Total Cost of Concret-Ballasted Cylinders that Achieve Required Restoring in Pitch with No Mooring Lines
The cost curve in Figure 9 shows that cost is minimized at very high and very low drafts. Practical considerations, however, put limits on the realistic draft of a structure; a structure with a draft beyond 30 meters could not be accommodated by any realistic shipyards or channels, and a structure with a draft below 1.5 meters will run the risk of slamming over the waves, as the troughs of the waves fall below its lower surface. Within these practical limits, the extreme drafts of 1.5 and 30 meters were chosen to represent realistic structures that minimize cost. The geometries corresponding to structures with these drafts are summarized in Table 3.
Table 3. Extreme Structures of the Concrete Ballasted Cylinder
Draft R h H
[m] [ml [ml [ml
1.5 18.34 0.27 3.00 30 10.465 10.985 31.50
As shown in Table 3, the deepest-drafted geometry has a radius of roughly 10.5 meters, and a draft of 30 meters. This geometry does not resemble a slender cylinder characteristic of a spar buoy. These results indicate that achieving the required restoring
in pitch by a spar buoy would necessitate a structure with an extremely deep draft that would not be feasibly accommodated in any shipyard or port. This conclusion led to the elimination of the spar buoy from candidate structures. The two extreme structures in Table 3 were then classified as the barge and the concrete-ballasted cylinder (CBC). These structures are re-defined in Table 4.
Table 4. Properties of the Barge and the CBC
Stucture Draft R h H
Name [im] [m [im] [m
Barge 1.5 18.34 0.27 3 CBC 30 10.465 10.985 31.5
6.2
Optimization of the Tri-Floater
The design of the Tri-floater was based on the design laid out in [16], and summarized in [12], but was adjusted to achieve the level of restoring required. This platform structure consists of 3 cylinders, joined in a triangle. The wind turbine tower is attached to the center of the triangle, and is supported by cross-bracing.
The cylinders and their radial spread were designed to achieve the required restoring properties with a reasonable draft and a reasonable radial spread. An extremely large radial spread presents challenges for transportation of the platform to the installation site, while a very small radial spread creates a structure that converges to a single cylinder.
Taking these issues into consideration, it was found that a smaller structure than that presented in [16] was able to achieve the required restoring. This structure is summarized in Table 5.
Table 5. Properties of the Tri-Floater
Number of Cylinders 3 --Draft 9.35 m R 7 m] h 3 m H 11 M Rorigin-to-cyinder 25 [m]
6.3
Optimization of the TLP
The TLP is a structure that is intended to achieve adequate restoring primarily through the mooring system. The platform structure, therefore, is only intended to provide enough buoyancy to tension the mooring lines to the desired tension. The TLP is also intended to reduce wave loading by submerging the structure to a depth below significant wave action. These three intentions give rise to three optimization problems; to find the optimal shape of the submerged platform with respect to cost, to find the optimal depth to which the platform should be submerged with respect to wave loading, and to find the necessary tether tension.
6.3.1
Platform Shape
The first optimization problem is the simple algebraic exercise of minimizing the surface area of a cylinder with a given volume. Minimizing the surface are of the cylinder minimizes the steel used to create the cylinder, which minimizes the cost. This exercise shows that the optimal shape for the submerged cylinder is a cylinder with a diameter and height of the same length.
6.3.2
Platform Submersion Depth
The consideration of the variation of fluid particle velocity with depth due to a plane progressive wave gives insight into the second optimization problem. The horizontal and vertical velocities of a fluid particle due to plane progressive waves are shown by Newman in [13] to attenuate exponentially with depth. This would suggest that submerging the structure below the calm water surface would decrease wave loading on the structure, and would result in reduced motions of the coupled system. The result of submerging a structure below the surface, however, entails other effects that rise from
submerging the structure, including reduced added mass and hydrodynamic damping, and an increased submerged surface area of the structure. An increase in submerged surface area results in a larger area over which the hydrodynamic pressure acts, and could result in larger forces even if the pressures are reduced. In addition, dynamic analyses show that hydrodynamic damping is extremely significant to the total system motions. These additional effects make the outcome of submerging the platform below the surface unclear. For this reason, this study will compare the results of a TLP that floats on the
surface with a TLP that is submerged.
6.3.3
Tether Tension
The final consideration for fully defining the properties of the TLP is the mooring line tension. A static design process along the lines developed by Withee in [21] and utilizing the theory developed by Faltinsen in [3] and Newman in [13] is carried out to determine the tether tension and dimensions of the TLP.
As developed in Section 5.3, the restoring coefficient in pitch provided by the tethers of a tension leg mooring system is shown below, but is assumed to be infinite.
=2(EA ) 2 T
C,Li,Te,one = 2 (EA'Tth'r ( R + L,
,
+ F,,e,,,T4ethers
(EA) + -c
= 55,LinesTensionLeg "0
This infinite stiffness prevents any significant motion in pitch, roll, and heave, but the
mooring system must limit the motions to reasonable values in surge, sway, and yaw.
A tension leg mooring system must also maintain reasonable tension in all of its tethers. With the steady-state wind force acting in the positive x direction, the tension in upwind tether increases and the tension in downwind tether decreases to provide a balance of
![Table 20. Standard Deviations of System Motions, MIT/NREL SDB, Wind Speed Effects Sea States Hs [m] 0.09 0.67 2.44 5.49 10 Tm [s] 2 4.8 8.1 11.3 13.6 9 m/s 0.0004 0.1997 1.3126 1.9333 2.6012 Surge [m] 11.2 m/s 0.0004 0.1989 1](https://thumb-eu.123doks.com/thumbv2/123doknet/14507158.528997/76.918.201.727.126.614/table-standard-deviations-motions-speed-effects-states-surge.webp)
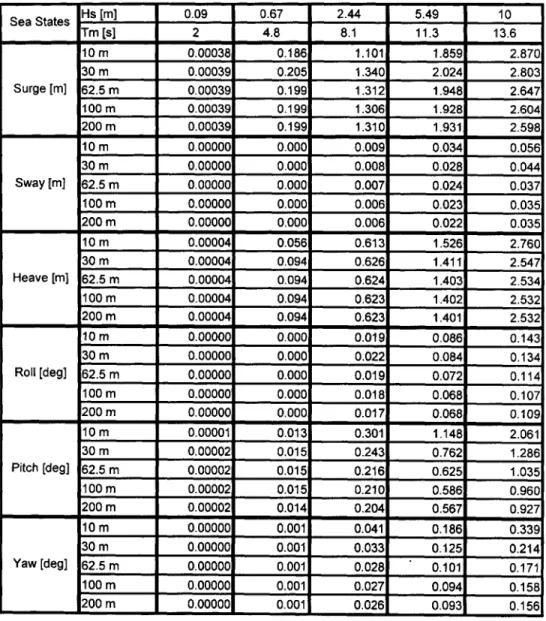
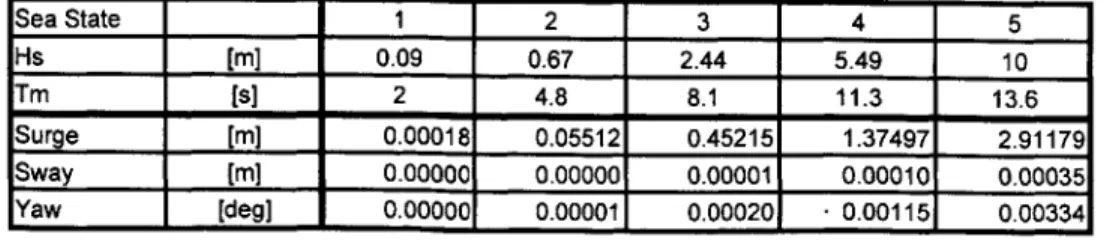
![Table 29. Standard Deviations of System Motions, MIT/NREL TLP Surface, Wind Speed Effects Sea States Hs [m] 0.09 0.67 2.44 5.49 10 Tm [s] 2 4.8 8.1 -11.3 13.6 9 m/s 0.0002 0.0551 0.4522 1.3751 2.9120 Surge [i] 11.2 rn/s 0.0002](https://thumb-eu.123doks.com/thumbv2/123doknet/14507158.528997/84.918.190.737.134.410/table-standard-deviations-motions-surface-speed-effects-states.webp)