HAL Id: hal-02997285
https://hal.uca.fr/hal-02997285
Submitted on 10 Nov 2020
HAL is a multi-disciplinary open access
archive for the deposit and dissemination of sci-entific research documents, whether they are pub-lished or not. The documents may come from teaching and research institutions in France or abroad, or from public or private research centers.
L’archive ouverte pluridisciplinaire HAL, est destinée au dépôt et à la diffusion de documents scientifiques de niveau recherche, publiés ou non, émanant des établissements d’enseignement et de recherche français ou étrangers, des laboratoires publics ou privés.
Linking magmatic processes and magma chemistry
during the post-glacial to recent explosive eruptions of
Ubinas volcano (southern Peru)
Pablo Samaniego, Marco Rivera, Nélida Manrique, Federica Schiavi, François
Nauret, Céline Liorzou, Marie-Anne Ancellin
To cite this version:
Pablo Samaniego, Marco Rivera, Nélida Manrique, Federica Schiavi, François Nauret, et al.. Linking magmatic processes and magma chemistry during the post-glacial to recent explosive eruptions of Ubinas volcano (southern Peru). Journal of Volcanology and Geothermal Research, Elsevier, 2020, 407, pp.107095. �10.1016/j.jvolgeores.2020.107095�. �hal-02997285�
Linking magmatic processes and magma chemistry during the post-glacial to recent
1explosive eruptions of Ubinas volcano (southern Peru)
23
Pablo Samaniego1*, Marco Rivera2, Nelida Manrique3, Federica Schiavi1, François Nauret1,
4
Céline Liorzou4, Marie-Anne Ancellin1
5 6
1 Université Clermont Auvergne, CNRS, IRD, OPGC, Laboratoire Magmas et Volcans, F-63000
Clermont-7
Ferrand, France 8
2 Instituto Geofísico del Perú, Observatorio Vulcanológico del Sur, Manzana B, Lote 19, Urb. La Marina, Cayma,
9
Arequipa, Peru 10
3 Observatorio Vulcanológico del INGEMMET, Dirección de Geología Ambiental y Riesgo Geológico, Urb.
11
Magisterial B-16, Umacollo, Arequipa, Peru 12
4 Laboratoire Géosciences Océan, Institut Universitaire Européen de la Mer, Université de Bretagne Occidentale,
13
Rue Dumont d’Urville, 29280 Plouzané, France 14
15
* Corresponding author: 16
Pablo Samaniego, pablo.samaniego@ird.fr, ORCID 0000-0003-1169-3503 17
Laboratoire Magmas et Volcans, Université Clermont Auvergne - CNRS - IRD, OPGC, Campus Universitaire 18
des Cézeaux, 6 Avenue Blaise Pascal, TSA 60026 - CS 60026, 63178 Aubière, France 19
20 21 22
23
Abstract
24Understanding the links between the magma differentiation processes, the magma plumbing system and 25
the magma composition at arc volcanoes is of paramount importance for volcanic hazard assessment. In this work 26
we focus on the post-glacial, Holocene, historical, and recent eruption products of Ubinas volcano (Peru), which 27
display an overall decrease in silica content from the older, plinian (VEI 3-5), rhyolitic eruptions (69-71 wt.% 28
SiO2) to the historical and recent (2006-2009, 2013-2017), vulcanian (VEI 1-2) basaltic andesitic eruptions
(55-29
57 wt.% SiO2). Based on a comprehensive study of the major and trace elements and the Sr-Nd-Pb isotopes, we
30
conclude that this temporal pattern reflects the evolution of the Ubinas magmas in the middle-to-upper crust by a 31
coupled Assimilation-Fractional Crystallization (AFC) process involving a cumulate composed of plagioclase, 32
amphibole, clinopyroxene, orthopyroxene and Fe-Ti oxides, with minor amounts of olivine and biotite at the mafic 33
and felsic end-members, respectively. Upper crustal assimilation is limited to 5-8 vol.%, but the overall radiogenic 34
Sr-Nd-Pb signature of the Ubinas magmas requires a larger crustal component, which must therefore occur at 35
middle to lower crustal depths. The petrology of the Ubinas magmas also points to an overall increase in P-T 36
conditions: the large Holocene dacitic and rhyolitic eruptions record temperatures ranging from 800 to 850ºC and 37
pressures in the range of 200-400 MPa, whereas the historical and recent (2006-2009, 2013-2017) basaltic 38
andesitic eruptions provide higher temperatures and pressures (1000ºC, >300-400 MPa). Overall, the thermo-39
barometry, phase equilibrium and geochemical constraints allow us to propose the existence of a middle-to-upper 40
crust magma column composed of a highly crystalline magma mush containing batches of liquid magma, which 41
seems to be continually recharged from deeper levels. On the basis of the petrological nature of the historical 42
basaltic andesitic eruptions (CE 1667, 2006-2009, 2013-2017), we postulate that during the last centuries, Ubinas 43
experienced a recharge-dominated process, with no evidence for a rejuvenation of the silica-rich reservoir that fed 44
the large Holocene dacitic to rhyolitic eruptions. This study highlights the importance of detailed petrological 45
studies of Holocene sequences at explosive arc volcanoes in order to constrain the magmatic processes and 46
conditions that control large explosive eruptions. 47
48
Keywords: Ubinas, Peru, arc volcanoes, recharge, thermobarometry, magma plumbing system
49 50
1. Introduction
51Understanding the occurrence of explosive eruptions involving intermediate and silica-rich magmas (i.e. 52
andesites, dacites and rhyolites) in arc volcanoes is of paramount importance for volcanic hazard assessment. It is 53
widely accepted by the scientific community that primitive arc magmas result from partial melting of a source 54
located in the mantle wedge which was previously metasomatized by fluids or melts derived from the subducted 55
slab (Kelemen et al., 2014; Turner et al., 2016; Schmidt and Jagoutz, 2017). These magmas display a large 56
geochemical heterogeneity related to the nature of their magma sources together with the fluid/melt transport in 57
the mantle wedge (Grove et al., 2003; Rawson et al., 2016). Primitive arc magmas (mostly magnesium-rich basalts 58
or basaltic andesites) ascend through the mantle wedge and stagnate at different levels in the arc crust, where they 59
are modified by various non-exclusive physical and chemical processes. As a result, intermediate and silica-rich 60
magmas are generated by a complex sequence of petrogenetic processes that include fractional crystallization, 61
crustal assimilation, and magma mixing (Hildreth and Moorbath, 1988; Annen et al., 2006; Lee and Bachmann, 62
2014). On one hand, there is a large amount of geochemical and experimental data showing that andesites (and 63
more differentiated liquids) are by-products of basalt crystallisation (Sisson et al., 2005; Blatter et al., 2013; 64
Nandedkar et al., 2014; Ulmer et al., 2018). In addition, following the seminal work of Hildreth and Moorbath 65
(1988), the deep arc crust is considered as a dynamic zone in which the process of melting, assimilation, storage 66
and homogenisation (the so-called MASH model) are actively at work. This model has been corroborated by 67
numerical and physical arguments (cf. Annen et al., 2006; Jackson et al., 2018). On the other hand, the paucity of 68
intermediate (andesitic) composition melt inclusions compared to the overwhelming abundance of these 69
compositions as bulk-rock erupted products suggests that magma mixing between silica-poor (primitive) and 70
silica-rich (differentiated) magmas is a common process during andesite genesis (Eichelberger et al., 2006; Reubi 71
and Blundy, 2009; Kent et al., 2010; Schiano et al., 2010). These models are probably end-member situations at 72
work at different places in the arc crust. Thus, the magmatic plumbing systems that feed active volcanoes are 73
considered to be vertically-elongated zones consisting of a mixture of solid phases and interstitial melt, in which 74
ephemeral magma accumulation occurs (Cashman et al., 2016; Bachmann and Huber, 2016; Jackson et al., 2018). 75
This model of trans-crustal magmatic systems rests on theoretical, geophysical, experimental petrology and 76
geochemical arguments, and challenges the classic view of melt-dominated magma chambers. It accounts for the 77
different compositional ranges observed in arc volcanoes as well as the overwhelming evidence for a multi-stage, 78
polybaric sequence of crystallization for most arc magma suites. 79
Arc volcanoes show variable compositional trends on a timescale of hundreds to thousands of years. Some 81
arc volcanoes display homogeneous basaltic andesitic to andesitic magmas [e.g. Sangay (Monzier et al., 1999) and 82
Reventador (Samaniego et al., 2008) volcanoes in Ecuador, Arenal in Costa Rica (Ryder et al., 2006), Merapi in 83
Indonesia (Gertisser and Keller, 2003)]; whereas others are broadly dacitic magma systems [e.g. Mount St. Helens 84
(Blatter et al., 2017), Pinatubo (Newhall and Punongbayan, 1995), Guagua Pichincha (Samaniego et al., 2010), 85
Huaynaputina (Thouret et al., 1999)]. There are also arc volcanoes that mostly erupt andesitic magmas with scarce 86
eruptions involving silica-rich magmas during sporadic (albeit larger) events [e.g. Colima in Mexico (Luhr and 87
Carmichael, 1990; Robin et al., 1991; Macias et al., 2017), Tungurahua in Ecuador (Samaniego et al., 2011; 88
Andujar et al., 2017; Nauret et al., 2018)]. Lastly, some arc volcanoes display temporal geochemical variations, 89
for instance Cotopaxi volcano in Ecuador (Hall and Mothes, 2008; Garrison et al., 2011; Martel et al., 2018), 90
where larger rhyolitic eruptions transitioned to smaller andesitic events. This is also the case for Ubinas volcano 91
in southern Peru, which is characterized by a temporal geochemical trend showing a progressive decrease in silica 92
content over the last few thousand years (Thouret et al., 2005; Rivera et al., 2014), from pre-Holocene, large (VEI 93
≥ 4) plinian eruptions involving rhyolitic magmas to the historical and recent, small-to-moderate (VEI 1-2) 94
vulcanian events that involve basaltic andesitic magmas. 95
In this study, we performed a detailed mineralogical and geochemical study that includes whole-rock 96
major, trace element and Sr-Nd-Pb isotopic analyses, as well as a comprehensive petrogenetical and thermo-97
barometric study of a succession of explosive deposits covering the post-glacial, historical and recent eruptive 98
chronology of Ubinas. These data allow us to identify the main magmatic processes responsible for the diversity 99
of Ubinas magmas, as well as to petrologically image the magmatic plumbing system during the large eruptions 100
involving silica-rich magmas and the smaller events involving silica-poor magmas. These findings will contribute 101
to the hazard assessment at this active volcano of the Andean Central Volcanic Zone (CVZ). More generally, this 102
case-study provides constraints to discuss the magma processes at work at other arc volcanoes that display large 103
compositional ranges over relatively short time intervals (several thousands of years). 104
105
2. Eruptive chronology
106Ubinas volcano (16º 22'S, 70º 54'W, 5672 meters above sea level – m a.s.l.), located ~75 km east of 107
Arequipa (Fig. 1), is the most active volcanic centre of the Peruvian arc, and together with Sabancaya and Lascar 108
are amongst the most active volcanoes in the Andean Central Volcanic Zone (CVZ). This segment of the Andean 109
arc developed on a thick continental crust (up to 65-75 km thick, Ryan et al., 2016) and results from the subduction 110
of the Nazca plate below the South-American lithosphere. Ubinas has experienced at least 27 low-to-moderately 111
explosive (VEI 1-3) eruptions in historical and recent times (i.e. from the beginning of the Spanish conquest in 112
~1532 CE to the present day) (Siebert et al., 2010; Rivera et al., 2014). The eruptive chronology of Ubinas was 113
studied in detail by Thouret et al. (2005) and Rivera (2010), who defined two successive edifices (Ubinas I and 114
Ubinas II). The older, mostly effusive Ubinas I volcano was constructed by the emplacement of andesitic and 115
dacitic lava flows from around 450 to 370 ka, and suffered a large sector collapse at the end of its growth. The 116
younger Ubinas II volcano was constructed on top of the older edifice over the last 370 ka and consists of andesitic 117
and dacitic lava flows and domes and thick successions of block-and-ash-flow deposits that infill the Ubinas valley 118
to the south. It forms a truncated cone with a summit caldera (1x1.5 km), which testifies to intense explosive 119
activity in Late Pleistocene times. Based on the stratigraphy, Thouret et al. (2005) suggested that this summit 120
caldera was formed between 25 and 10 ka by a sequence of large explosive eruptions responsible for a thick 121
succession of plinian tephra fall deposits. Geochronological data from these deposits are infrequent due to the 122
scarcity of organic material for radiocarbon dating as a consequence of the extremely arid weather conditions of 123
the Central Andes. However, rough temporal constraints come from stratigraphic correlations with distal tephra 124
layers found at Laguna Salinas, 25-30 km west of Ubinas (Juvigné et al., 1997). Based on these data, Thouret et 125
al. (2005) considered that the basal tephra of the caldera-related succession is older than 14 ka. In any case, these 126
eruptions occurred after the Late Glacial Maximum (LGM), dated at 17-25 ka in this part of the Andes (Smith et 127
al., 2008; Bromley et al., 2009; Blard et al., 2014). 128
129
Figure 1 130
131
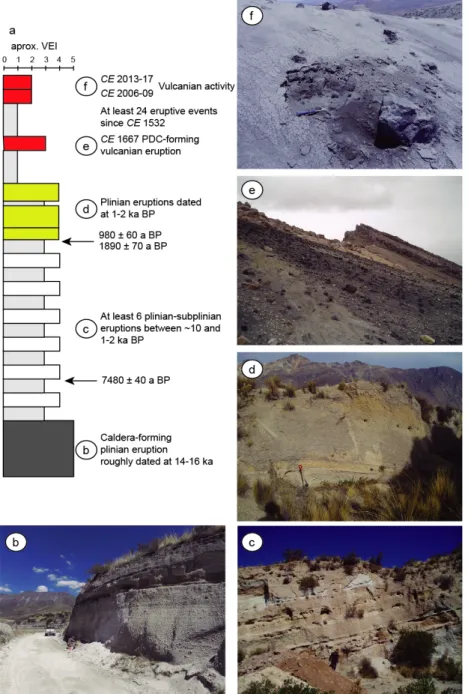
The post-glacial eruptive succession at Ubinas (Fig. 2a) comprises 10-15 m-thick plinian tephra fallout 132
deposits that crop out in the southern and south-eastern part of the cone at a distance of up to 15 km from the 133
summit. Around the hamlet of Sacuhaya (8-9 km south of the summit), at least seven pumice-and-lithics tephra 134
layers were described. The basal layer is a 2-3 m-thick, rhyolitic white pumice deposit (Fig. 2b) that correlates 135
with the distal Laguna Salinas ash fallout deposit (see above). In this cross-section, we found six additional, 10-136
100 cm-thick tephra fallout layers, which correspond to the Holocene plinian activity of Ubinas (Fig. 2c). A 137
charcoal sample collected from an ash-rich paleosol layer in the lower-middle part of this cross-section, directly 138
below a 1 m-thick plinian fallout deposit (UBI-10-12 sample, Fig. 2c, 3a), was dated at 7480 ± 40 BP by Thouret 139
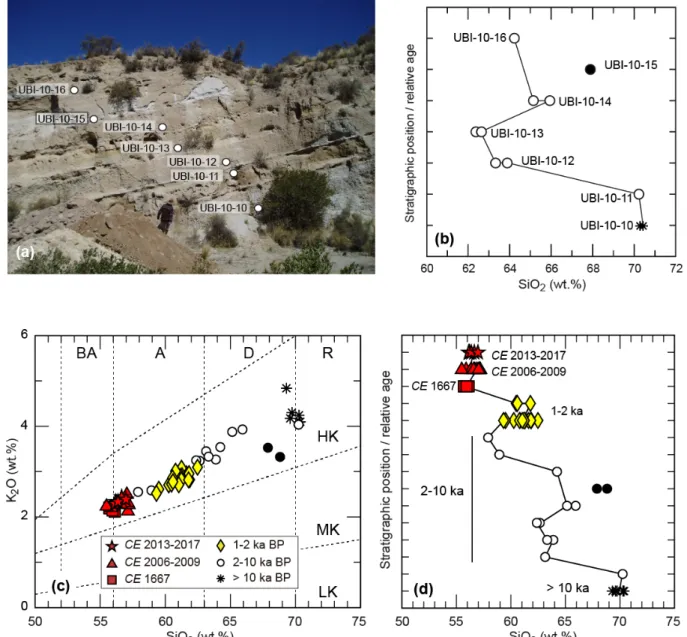
et al. (2005). This date represents the only absolute age for this tephra succession. All these tephra layers 140
correspond to Ubinas post glacial activity, excepting a 10-15 cm-thick, white, fine lapilli, tephra fallout deposit 141
that blankets the region located to the south of Ubinas (samples UBI-10-15 and UBI-10-08, Fig. 3). Based on 142
tephra dispersal studies performed by Wright et al. (2017) and the chemical composition of these samples (see 143
below), we consider the source of this deposit being a different volcano than Ubinas. At Quebrada Infiernillos 144
(5-6 km southeast of the summit), the tephra fallout deposits correlate with the middle-upper part of the Sacuhaya 145
cross-section. In addition, in this outcrop, we found the deposits of the last two plinian eruptions of Ubinas (VEI 146
4-5, Thouret et al., 2005; Siebert el al., 2010), which were dated at 980 ± 60 BP (Fig. 2a, d). During the fieldwork 147
performed for this study, we found at the base of these tephra fallout deposits, a >50 cm, ash-rich layer with 148
disseminated pumice fragments, containing non-carbonized branches that yielded an age of 1890 ± 70 BP (UBI-149
15-03, GrA 65545, Center for Isotope Research, University of Groningen, The Netherlands). Given the 150
stratigraphic position of this sample (in the underlying ash-rich layer), we consider that this age represents the 151
oldest age limit for this eruption. Based on the previous and these new data, we consider that the last plinian 152
eruption at Ubinas occurred at 1-2 ka. 153
Eruptive activity in historical and recent times has been characterized by low-to-moderate (VEI 1-2) 154
vulcanian eruptions accompanied by long-lasting ash and gas emissions. The large eruption of this period occurred 155
in CE 1667 (Thouret et al., 2005; Siebert el al., 2010) and was characterized by a moderately explosive (VEI 3) 156
event that produced low-volume, scoria-rich pyroclastic flow deposits that outcrop on the upper part of the cone, 157
close to the caldera border (Fig. 2e). During the last two decades, Ubinas has experienced several eruptive periods 158
in 2006-2009, 2013-2017 and recently in 2019 (Fig. 1b, Fig. 2f). These eruptions show very similar patterns, 159
starting with a strong phreatic phase followed by intermittent vulcanian events that progressively waned over a 160
period of a few years (Rivera et al., 2010; 2014). 161
162
Figure 2 163
164
3. Sampling and analytical methods
165Based on the comprehensive work of Thouret et al. (2005) and Rivera (2010) we sampled the key cross-166
sections of Sacuhaya and Quebrada Infiernillos as well as the historical and recent eruptive products of the CE 167
1667, 2006-2009 and 2013-2017 eruptions (Fig. 2). Major and trace element concentrations of 33 new whole-rock 168
samples from the post-glacial eruptive events, including 8 samples from the historical and recent eruptions (CE 169
1667, 2006-2009, and 2013-2017), were analysed at the Laboratoire Geosciences Océan, Université de Bretagne 170
Occidentale (Brest, France). Agate-grinded powders were dissolved in HNO3 and HF and then measured by
ICP-171
AES (Inductively Coupled Plasma-Atomic Emission Spectroscopy), following the procedure of Cotten et al. 172
(1995). Relative standard deviations are 1% for SiO2 and ≤ 2% for the other major elements, and ≤ 5% for trace
173
elements. To these data we added the major and trace element compositions of 24 samples previously published 174
by Thouret et al. (2005) and Rivera et al. (2014). Sr, Nd and Pb isotopic ratios were measured at Laboratoire 175
Magmas et Volcans (LMV), Université Clermont Auvergne (Clermont-Ferrand, France) for 15 samples that span 176
the post-glacial activity of Ubinas. Sr and Nd data were obtained following the techniques described by Pin et al. 177
(1994) and Pin and Santos Zalduegui (1997), using a TIMS and a MC-ICP-MS respectively. We include 10 Sr– 178
Nd isotopic ratios published by Thouret et al. (2005), Rivera (2010) and Rivera et al. (2014), which were also 179
analysed at LMV, following the same analytical procedure. Sr isotopic measurements were corrected for mass-180
fractionation using an exponential law and 86Sr/88Sr = 0.1194 and normalized to the value of the NIST SRM987
181
standard (87Sr/86Sr = 0.710245). Nd isotopic measurements were corrected for mass fractionation using an
182
exponential law and 146Nd/144Nd = 0.7219 and normalized to the value of JNdi-1 standard (143Nd/144Nd = 0.512100
183
± 5 (2σ), n = 5). External reproducibility was monitored by repeated analyses of JNdi-1 standard 184
(143Nd/144Nd=0.512097 ± 10 (2σ), n = 13). This value is equal, within error margins, to the proposed value for
185
JNdi-1 standard. Pb isotopic ratios were determined following the methods described by Nauret et al. (2018), using 186
a MC-ICP-MS at LMV. Pb isotope ratios were normalized to values of NIST SRM 981 given by Galer et al. 187
(1998). Total procedural blanks are lower than 0.15 ng (n = 6), which is negligible compared to the amount of Pb 188
loaded on the columns (200 to 500 ng). We used international standards (AGV2, BHVO2 and BIR-1) in order to 189
test the reproducibility of our method. Values obtained for AGV-2 are 206Pb/204Pb = 18.870; 207Pb/204Pb = 15.618;
190
208Pb/204Pb = 38.546 (n = 5), for BHVO-2: 206Pb/204Pb = 18.608; 207Pb/204Pb = 15.536; 208Pb/204Pb = 38.212 (n =
191
2) and for BIR-1: 206Pb/204Pb = 18.848; 207Pb/204Pb = 15.655; 208Pb/204Pb = 38.489 (n= 1). These results are in
192
agreement with the international reference values. All measured Pb isotope compositions were corrected for mass 193
fractionation by adding a solution of the NIST SRM 997 Tl standard to the sample before measurement. The new 194
whole-rock major and trace elements and isotopic ratios are presented in Table 1. Sample locations are given in 195
the electronic Supplementary material 1. 196
Major element compositions for minerals and matrix glasses of 11 representative samples of Ubinas 197
eruptive products were analysed at the LMV, using a CAMECA SX-100 microprobe. The operating conditions 198
for minerals were 15 kV accelerating voltage, 10–12 nA beam current, and 10 s counting time; whereas the matrix 199
glass measurements were performed using a 15 kV accelerating voltage, 4-8 nA beam current, 5-10 μm beam size, 200
10 s counting time, and using international glass standards. With these operating conditions and given that alkali 201
elements measurements were performed first, we should avoid significant Na migration under the electron beam 202
(cf. Devine et al., 1995). Selected major elements composition of Ubinas minerals are presented in Tables 2, 3, 4, 203
5; whereas the entire dataset was included in the Supplementary material 2. In order to measure trace element 204
concentrations of selected Ubinas minerals, Laser-Ablation-ICP-MS analyses were performed on phenocrysts of 205
selected Ubinas samples, using a 193 nm Resonetics M-50E excimer laser coupled to an Agilent 7500cs ICP-MS. 206
The laser energy was about 3 mJ, with a pulse frequency of 2-3 Hz. The spot diameter was set at 60-80 µm and 207
the analysis time was 100 s after a background measurement (~30 s). The technique uses calcium as an internal 208
standard and measurements were calibrated relative to the NIST-612 glass. The glass standard BCR was also 209
measured to check the reliability of the results. Data treatment was performed on Glitter software (www.glitter-210
gemoc.com). The typical analytical error for most trace elements is < 10%. 211
We measured the pre-eruptive water content on selected melt inclusions using a Renishaw InVia confocal 212
microspectrometer equipped with a 532 nm diode laser (200 mW output power), a Peltier-cooled CCD detector, a 213
motorized XYZ stage and a Leica DM2500 M optical microscope, at the LMV. The laser power was set to ~3 214
mW. A 2400 grooves/mm grating, a 100× objective and 20 μm slit aperture (high confocality setting) were used 215
for the analyses. These analytical conditions result in lateral spatial resolution of ~1 μm and spectral resolution 216
better than 1 cm-1. Daily calibration of the spectrometer was performed based on the 520.5 cm-1 peak of Si. The
217
spectra were recorded in the wavenumber ranges from ~100 to 1350 cm-1 (alumino-silicate network domain) and
218
from ~3000 to 3800 cm-1 (water domain), using Wire 4.2 software. Acquisition times were 60-240 s and 120-480
219
s for the alumino-silicate and water domains, respectively. Spectra treatment was performed using PeakFit 4.0 220
software. For determination of water content in glasses, we used the external calibration procedure and a set of 221
hydrous glass standards with rhyolitic, andesitic, and basaltic compositions (see Schiavi et al. (2018) for details 222
about the method) that were analysed at the same conditions as the samples several times a day. All the analysed 223
glass inclusions contain “nanolites” of magnetite, as revealed by the presence of its main peak centred at ~ 670 224
cm-1 (Supplementary material 3). The intensity of the magnetite peak relative to the main glass band near 500 cm
-225
1 varies significantly among the samples (intensity ratio from 0.4 to 1.8). Di Genova et al. (2017) and Schiavi et
226
al. (2018) observed that the presence of magnetite dispersed in the glass causes underestimation of the water 227
content of the inclusion. Therefore, the estimated water contents are minimum values. The water contents are 228
weakly underestimated in inclusions whose spectra show a weak magnetite signal (band intensity ratios 0.4-0.5), 229
but they are strongly underestimated in inclusions with an intense magnetite peak (Supplementary material 4). 230
231
4. Petrological data
2324.1. Whole-rock geochemistry
233
The post-glacial, historical and recent eruptive products of Ubinas form a continuous high-K magmatic 234
trend, ranging from basaltic andesites to rhyolites (55-71 wt.% SiO2; 2-4 wt.% K2O, recalculated as anhydrous,
235
Fig. 3). The most striking characteristic of this dataset is the overall decrease in silica content through time. At the 236
base of the tephra succession, we have the older rhyolitic compositions (69-71 wt.% SiO2) of the pre-Holocene
237
eruption deposits, followed by several Holocene dacitic (62-69 wt.% SiO2) tephra fall deposits. Above this is the
238
andesitic (60-62 wt.% SiO2) tephra fallout deposits that corresponds to the 1-2 ka plinian eruptions. The Ubinas
239
stratigraphic succession terminates with the historical and recent eruptive products of basaltic andesitic 240
compositions (55-57 wt.% SiO2), that include those of the CE 1667, 2006-2009 and 2013-2017 eruptions (Fig. 3).
241
A more detailed observation of this dataset reveals that the chemical variation is not uniform, there are two periods 242
of silica-rich compositions in the middle (samples UBI-10-14, 16; Fig. 3), and in the upper part of the Holocene 243
volcanic succession (the 1-2 ka eruption). Concomitantly with silica variations, the K2O and some incompatible
244
trace elements (e.g. Rb, Th) show also a decrease through time; whereas MgO concentrations, as well the 245
compatible elements (e.g. Sr, Ni, Cr) display an overall increase from the older rhyolites to the younger basaltic 246
andesites, up to a maximum for CE 1667 eruption products (Supplementary materials 5 and 6). We should 247
highlight the presence of two samples that lie off the main trend (15 from Sacuhaya section, and UBI-10-248
08 from Quebrada Infiernillos section), which are represented by black dots in Fig. 3 and the other geochemical 249
plots. Compared to the other tephra layers and for the same silica content, these samples display lower 250
incompatible elements concentrations (e.g. K2O, Rb, Th, La, Fig. 3 and 4; Supplementary materials 5 and 6).
251
Overall, the Ubinas magmatic series displays well-defined negative correlations for silica and most major 252
elements (Fig. 4, Supplementary materials 5), except for Al2O3, and Na2O that are highly scattered. Sr and the
253
transition metals (e.g. Sc, V, Co, Cr, Ni) also show negative correlations with silica increase. Conversely, some 254
trace elements (and K2O) show fairly good positive correlations with silica, especially the Large-Ion Lithophile
255
Elements (LILE; e.g. Rb, Th), while the High Field Strength Elements (HFSE; e.g. Nb and Zr) show a broad 256
scatter. The Rare Earth Elements (REE) display a notable behaviour: the light REE (LREE; e.g. La, Ce) show no 257
clear variation with silica increase, spanning over a wide range of values for the same silica content, whereas the 258
Middle and Heavy REE (MREE and HREE; e.g. Nd, Sm, Yb) display clear negative correlations. As a result, REE 259
ratios show temporal trends, such as a progressive decrease in La/Sm and increase in Sm/Yb or Dy/Yb ratios from 260
rhyolites to basaltic andesites (Supplementary materials 6). Lastly, the major and trace element variations have a 261
noticeable break-in-slope at 56-58 wt.% SiO2, with the basaltic andesitic group (BA) on one side and a more
262
widespread andesitic-dacitic-rhyolitic group (ADR) on the other side. We keep this dichotomy for the forthcoming 263
sections of this manuscript. 264 265 Figure 3 266 Figure 4 267 Table 1 268 269
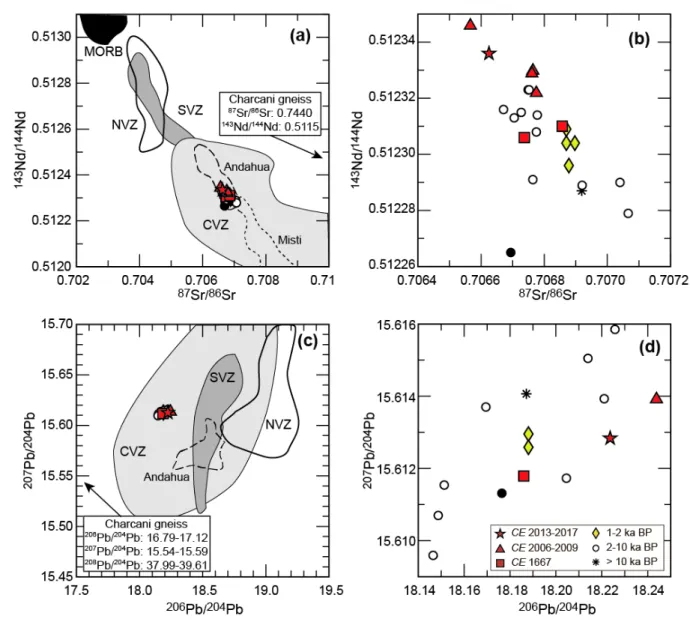
Sr and Nd isotopic data broadly display homogeneous values at the scale of the CVZ (Fig. 5a). In detail, 270
87Sr/86Sr range between 0.70657 and 0.70707 with 143Nd/144Nd between 0.51228 and 0.51235 (Fig. 5b, Table 1).
271
These isotopic ratios are plotted far from the mantle domain represented by the MORB field and they display a 272
negative correlation in 87Sr/86Sr vs. 143Nd/144Nd diagram. We should stress that sample UBI-10-15 plots off the
273
trend with low 143Nd/144Nd and relatively high 208Pb/204Pb values. This characteristic confirms the interpretation
274
that this deposit does not correspond to Ubinas. Note that although we include these samples on the geochemical 275
plots, we exclude them from the subsequent analysis. Looking in detail, BA samples display the less radiogenic 276
values in Sr and the most radiogenic in Nd, although they display a variability that accounts for at least 50% of the 277
whole Ubinas isotopic variation (Fig. 5b). Surprisingly, the most radiogenic Sr values (and conversely the less 278
radiogenic Nd values) are displayed by some dacites (rather than rhyolites, Fig. 5b). On the whole, Sr-Nd isotopic 279
ratios define fairly good correlations with most differentiation indices (e.g. SiO2, K2O, Rb, Th; Supplementary
280
materials 7). All samples fall within the isotopic field of the Andean Central Volcanic Zone (Davidson et al., 1991) 281
and roughly display less radiogenic Sr compositions (Fig. 5a) than those of El Misti volcano (Rivera et al., 2017), 282
but similar to those of the Andahua monogenetic cones (Delacour et al., 2007). Pb isotopic data also display very 283
homogeneous values at the scale of the CVZ (Mamani et al., 2010). However, looking at in detail, they display a 284
quite large range of variation (206Pb/204Pb: 18.147-18.244; 207Pb/204Pb: 15.610-15.616; 208Pb/204Pb: 38.548-38.649;
285
Fig. 5c), with no well-defined linear correlations in 206Pb/204Pb vs. 207-208Pb/204Pb diagrams (Fig. 5d). In contrast to
286
the Sr-Nd isotopic data, the Pb isotopic ratios of Ubinas differ from those of the Andahua monogenetic cones, 287
plotting at lower 206Pb/204Pb and higher 207Pb/204Pb values (Fig. 5c).
288 289
Figure 5 290
291
4.2. Petrography and mineral chemistry
292
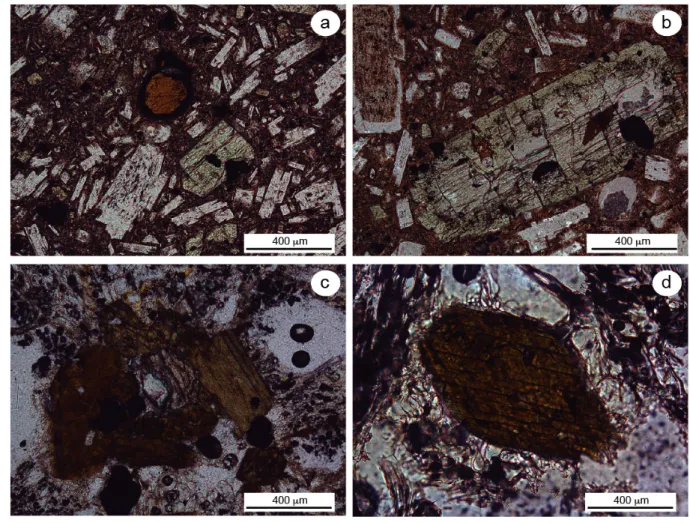
Blocks and bombs from the BA group are porphyritic, black to grey, dense to poorly vesiculated rocks 293
bearing 20-25 vol.% phenocrysts of plagioclase, ortho- and clinopyroxene and Fe-Ti oxides, with scarce amphibole 294
and olivine. On the contrary, the ADR samples are mostly phenocryst-poor (< 5 vol.%), highly vesiculated pumices 295
with variable mineral assemblages. Andesitic samples contain plagioclase, amphibole, ortho- and clinopyroxene, 296
Fe-Ti oxides and scarce phenocrysts of biotite, whereas dacites and rhyolites are composed of plagioclase, 297
amphibole, biotite, and Fe-Ti oxides. Thus, the mineral assemblage changed concomitantly with magma chemistry 298
from BA to ADR samples (Fig. 6). 299
300
Figure 6 301
302
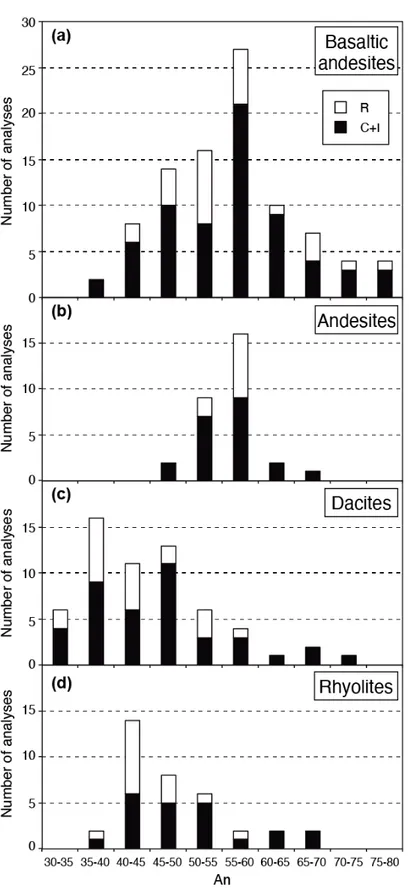
Plagioclase is the most abundant phase in Ubinas samples. In BA group, plagioclase (10-20 vol.%) occurs
303
as euhedral and subhedral phenocrysts showing a wide compositional range (An35-80, Fig. 7, Table 2), sometimes
304
within a single phenocryst (e.g. An36-65, Rivera et al., 2014; and new unpublished data from 2006 and 2015 eruptive
305
products). In spite of this diversity, most (~70%) phenocryst cores and rims display compositions between An45
306
and An65 (Fig. 7). On the basis of textural and chemical characteristics, we identified two different plagioclase
307
populations in BA samples: (1) euhedral, non-altered phenocrysts with normal, oscillatory and reverse zoning 308
patterns; and, (2) sieve-cored and sieve-ringed phenocrysts with frequent dissolution zones and clear overgrowth 309
rims displaying strong reverse zoning (e.g. An40-64). In the ADR samples, plagioclase is also the most abundant
310
phase (5-15 vol.%), displaying clear (unaltered), euhedral to subhedral forms with also large compositional 311
variations (e.g. An33-72; Fig. 7) and frequent normal zoning patterns (e.g. An65-40), while some phenocrysts display
312
no chemical variation. We also found rare reversely zoned phenocrysts (e.g. An46-51) as well as some inherited
313
cores (e.g. An70). We note that the peak for the An composition shifts from An50-65 for BA to An35-50 for ADR (Fig.
314
7). Although the compositional range observed in ADR is as large as those of for BA plagioclases, the phenocryst’s 315
rims display more restricted compositions in the ADR group (An35-55 for dacites, and An40-60 for rhyolites). Lastly,
316
the large compositional range of plagioclases from both groups suggest that some of them should be considered 317
as antecrysts (cf. Streck, 2008), i.e. the An-poor cores and rims in BA group, and the An-rich cores in ADR group. 318
319
Figure 7 320
Table 2 321
322
Amphibole phenocrysts are ubiquitous in Ubinas samples. They are an accessory phase (~1 vol.%) in BA
323
group, displaying anhedral forms with frequent opaque (black) reaction rims (cf. De Angelis et al., 2013), whereas 324
other phenocrysts are completely altered. They display homogeneous magnesium-hastingsite compositions 325
(according to the classification of Leake et al., 1997). In contrast, amphibole phenocrysts in the ADR samples are 326
much more abundant (2-5 vol.%), and appear as euhedral phenocrysts without any disequilibrium features. They 327
display wide compositional variations, spanning the hastingsite, tschermakite and magnesium-328
hornblende groups. The large compositional variation of Ubinas amphibole phenocrysts is summarized in an Al2O3
329
vs. Mg# diagram (Fig. 8a, Table 3). In this figure, amphibole from the BA samples show homogeneous, high-Al
330
contents (12.5-13.1 wt.% Al2O3) and relatively high Mg# (65-73) [where Mg# = 100 * Mg/(Mg + FeT) in mol.%,
331
and FeT is total iron as Fe2+]. Amphiboles in andesites display intermediary and homogeneous Al contents
(9.9-332
11.0 wt.% Al2O3) and homogeneous Mg# values (66-68), whereas amphibole phenocrysts in dacites and rhyolites
333
span a large compositional range (7.0-12.7 wt.% Al2O3; Mg# 61-71). Such a broad chemical composition of
334
amphiboles is usually ascribed to changes in chemical and thermodynamic parameters such as melt composition, 335
pressure, temperature and redox state (Johnson and Rutherford, 1989; Schmidt, 1992; Bachmann and Dungan, 336
2002; Prouteau and Scaillet, 2003; De Angelis et al., 2013; Krawczynski et al., 2012; Erdmann et al., 2014; Kiss 337
et al., 2014). In order to constrain the role of the main parameters controlling amphibole chemistry, a substitution 338
analysis is usually performed (cf. Poli and Schmidt, 1992; Bachmann and Dungan, 2002). Fig. 8b and c show the 339
variation of three key parameters [IVAl, VIAl and (Na+K)A] that suggest a leading role for edenite (ed) substitution,
340
a valuable proxy for temperature variations. However, the variation observed in VIAl component also points out
341
for a role of the tschermakitic (tk) substitution, which is considered as a proxy for pressure variations. In addition, 342
Kiss et al. (2014) propose that the variations in Mg# coupled with the variation in Al content of amphiboles (Fig. 343
8a) could be used as a proxy for variation in melt composition. 344 345 Figure 8 346 Table 3 347 Table 4 348 349
Clinopyroxene phenocryts in BA samples (~5 vol.%) show diopsidic to augitic compositions (En38-47
-350
Fs10-21-Wo38-46, Table 4, according to the classification of Morimoto et al., 1988), display euhedral forms, mostly
351
with reverse zoning patterns, although some phenocrysts show homogeneous compositions. The MgO content of 352
clinopyroxene, expressed by the Mg#, ranges from 65 to 82. There are also some inherited cores, which are mantled 353
by thin (10-50 µm), Mg-rich (Mg# 76-80) overgrowth rims. Clinopyroxene is also present as an accessory phase 354
(<1 vol.%) in andesitic and dacitic samples as phenocrysts or microphenocrysts with very homogeneous 355
compositions (Mg# 76-77). 356
Orthopyroxene phenocrysts appear to some extent (~2 vol.%) in BA group as well as in andesitic and
357
dacitic samples. They appear as euhedral phenocrysts, frequently associated with clinopyroxene. They have 358
enstatitic compositions (En65-71-Fs24-34-Wo2-4, Table 4, according to the classification of Morimoto et al., 1988).
359
Slight differences in Mg# have been observed between orthopyroxenes from BA and andesites (70-76) and dacites 360
(67-70). We stress that orthopyroxene is absent in rhyolites. 361
Biotite phenocrysts are ubiquitous in rhyolites (2-4 vol.%), are much scarcer (1-2 vol.%) in dacites, and
362
are absent from more mafic rocks. Biotite appears as euhedral (up to 1-2 mm long) phenocrysts without reaction 363
rims or any other disequilibrium textures. They display homogeneous compositions with Fe2+/(Fe2++Mg) ratios of
364
0.33-0.36 and very restricted Mg# values (64-67, Table 3). These characteristics confirm these micas are classified 365
as biotites (according to the classification of Deer et al., 2013). 366
Fe-Ti oxides appear throughout the Ubinas magmatic series as microphenocrysts and microlites in the
367
matrix (1-2 vol.%) as well as inclusions in other mineral phases. They mostly correspond to titanomagnetite (6-18 368
wt.% TiO2, Table 5), although rare ilmenite (37-38 wt.% TiO2) crystals are also observed in some dacites. Rivera
369
(2010) also reports some rare ilmenite crystals in dacites and rhyolites of Ubinas. 370
Olivine appears only as an accessory phase (< 1 vol.%) in BA such as those of the 2006-2009 and
2013-371
2017 eruptions. They are mostly subhedral or euhedral phenocrysts (up to 300-400 µm) or microlites with 372
homogeneous compositions (Fo66-78, Table 5), and usually normal zoning patterns. Olivine phenocrysts frequently
373
show reaction rims composed of plagioclase, pyroxene, and Fe–Ti oxides, or more scarce orthopyroxene 374
overgrowth rims. 375
Lastly, some apatite microphenocrysts and microlites are found as inclusions in plagioclase and 376
amphibole, whereas zircon microlites occurs as inclusions in biotites. 377
378
Table 5 379
380
4.3. Trace elements in minerals
381
Trace element concentrations were measured in plagioclase, ortho- and clinopyroxene, and amphibole 382
phenocrysts from three Ubinas samples, a basaltic andesite (UBI-10-18B), an andesite (UBI-10-01) and a rhyolite 383
(UBI-10-10C). Results are plotted in chondrite-normalized REE plots (Fig. 9). Plagioclase patterns are 384
fractionated, with high LREE and low HREE contents and a conspicuous positive Eu anomaly for the andesite 385
sample (Fig. 9a), as well as other notable positive anomalies for Ba and Sr (not shown). Orthopyroxene spectra 386
are homogeneous, displaying low LREE relative to HREE contents, and a small negative Eu anomaly. 387
Clinopyroxenes from the basaltic andesite sample display slightly flat spectra with maximum values for MREE 388
and a small negative Eu anomaly (Fig. 9b). Lastly, two distinct populations of amphibole are identified (Fig. 9c): 389
a REE-poor group that corresponds to amphibole from the basaltic andesite, and a REE-rich group that corresponds 390
to the andesite and the rhyolite. These two populations are also observed for HFSE (e.g. Nb, Ta, Zr, not shown). 391
Both groups display concave spectra with higher abundances of Nd (and other MREE) compared with other LREE 392
and HREE. In addition, the REE-poor group corresponds to high-Al amphibole and display no Eu anomaly; 393
whereas REE-rich group corresponds to high-Al amphibole and displays a conspicuous negative Eu anomaly. This 394
feature indicated the contemporaneous crystallization of plagioclase, low-Al amphibole, orthopyroxene and 395
clinopyroxene in the ADR group. 396
397
Figure 9 398
399
4.4. Chemical composition of interstitial matrix glass and melt inclusions
400
Interstitial matrix glass from the BA samples distributes into two compositional groups. Glasses from the 401
CE 1667 eruptive products display homogeneous compositions (62.7-64.1 wt.% SiO2; n=5, normalized to
402
anhydrous values, Table 6), whereas those from the 2006-2009 and 2013-2017 samples show slightly more 403
differentiated compositions (62.7-67.0 wt.% SiO2, n=11). In contrast, interstitial glasses from whole-rock andesite
404
samples from the 1-2 ka eruptions show dacitic to rhyolitic compositions (68.6-70.3 wt.% SiO2; n=13), and glasses
405
from whole-rock dacites and rhyolites samples display high-silica rhyolitic compositions (73.8-76.1 wt.% SiO2;
406
n=38). We analysed several melt inclusions from an andesitic and a rhyolitic tephra samples. We should stress the 407
high homogeneity of these analyses that display almost similar compositions for both samples: 66.0 ± 1.4 wt.% 408
SiO2 (n=12) for MI in plagioclase crystals from andesitic tephra and 66.2 ± 1.2 wt.% SiO2 (n=9) for MI in
plagioclase crystals from rhyolitic tephra. We should highlight that these compositions are identical to those of the 410
interstitial matrix glasses from andesitic tephra. When plotted on Harker diagrams (Fig. 10), whole-rock, matrix 411
glasses and melt inclusions samples define a single magmatic trend, although some scattering is observed for Al2O3
412
and Na2O (not shown). Matrix glasses from the BA group fall outside this trend, especially for Al2O3 and K2O. It
413
is worth noting that the matrix glass from the andesite whole-rock samples displays an almost identical rhyolitic 414
composition to the whole-rock rhyolites. 415
The water content of the matrix glasses was estimated using the “by difference” method (Devine et al., 416
1995). We stress that these values mostly correspond to degassed magmas and thus these values should be 417
considered as rough minimum estimates of the pre-eruptive water content. Concerning the ADR samples, we found 418
large glass shards that allowed us to perform defocused analyses to minimize Na migration. As a result, the water 419
content of matrix glasses from the ADR samples is 4.0 ± 1.2 wt.% (n=51). In order to better constrain the pre-420
eruptive water content for ADR samples, we analysed plagioclase-hosted melt inclusions by Raman spectroscopy. 421
The inclusions show variable water contents suggesting entrapment at different depths and/or complex degassing 422
histories. The maximum value (6 wt.%) was measured in an inclusion of the rhyolitic tephra less affected by the 423
magnetite signal (Supplementary material 3). Overall, minimum water contents of the melt inclusions from the 424
andesitic samples range from 2.3 to 3 wt.%, whereas those from the rhyolitic samples span a range of 2.3 to 6 425
wt.% H2O. Although most of the inclusions seem to be characterised by moderate water contents (2-3 wt.%), the
426
true water contents are obtained only after correction for the underestimation caused by the presence of magnetite 427
in the glass. The underestimate is proportional to the intensity of the magnetite peak and is evident in glasses with 428
low (microprobe + Raman) totals (< 97 wt.%; Supplementary material 4). When this effect is taken into account 429
and the compositions corrected, the water contents increase to varying degrees between 3 and 6 wt.%. Using the 430
“by difference” method on MI analyses we obtain an average value of 5.6 ± 1.7 wt.% H2O (n=21), in agreement
431
with the results of Raman measurements. 432 433 Figure 10 434 Table 6 435 436
5. Discussion
437 5.1. Pre-eruptive P-T conditions 438ADR magmas. Given that amphibole is ubiquitous in this magmatic group, a suitable geothermometer is based on
439
the amphibole-plagioclase equilibrium, using the edenite-richterite formulation of Holland and Blundy (1994), 440
which applies to quartz-free assemblages. We applied this geothermometer to euhedral amphibole-plagioclase 441
pairs in contact or for amphibole inclusions in plagioclase phenocrysts. We stress that this thermometer is weakly 442
affected by pressure changes (a change of 100 MPa induces a temperature difference of around 5 ºC). In Table 7, 443
the temperature estimates using the amphibole-plagioclase thermometer show a decrease in magmatic 444
temperatures from andesitic samples that yield very homogeneous values (913 ± 13 ºC, n=15), to dacites (881 ± 445
36 ºC, n=21), and rhyolites that show even lower values (846 ± 30 ºC, n=12). 446
Magnetite-ilmenite pairs are extremely rare in Ubinas magmatic series, however, we analysed 11 pairs 447
from dacites and rhyolites that follow the equilibrium criteria of Bacon and Hirschmann (1988). Using the Lindsley 448
and Spencer (1982) thermobarometric procedure, these pairs show very homogeneous T-fO2 results. For dacites,
449
the magnetite-ilmenite thermometer yields a temperature of 879 ± 4ºC (n=9) and a fO2 of -10.3 ± 0.1 (NNO+2);
450
whereas for rhyolites the temperature is slightly lower, 849 ± 3ºC (n=2) and fO2 of -10.7 ± 0.1 (NNO+2). We
451
should stress the good agreement between these temperature estimates and those obtained from the amphibole-452
plagioclase thermometer. However, as mentioned by Rutherford and Devine (1996), the magnetite-ilmenite 453
thermometer systematically displays higher values (up to 30ºC) for highly oxidized magmas (fO2 between -10 and
454
-11). If we apply this empirical correction the estimated temperature should be ~850ºC for dacites and ~820ºC for 455
rhyolites. 456
Another reliable thermometer for this magmatic group is the plagioclase-melt formulation of Putirka 457
(2008). We applied this thermometer to mineral rims in equilibrium with the adjacent matrix glasses. We ensured 458
that equilibrium conditions had been attained by selecting euhedral crystals, and by comparing the plagioclase-459
melt exchange coefficients with the putative values from the literature (KdAb-An = 0.1 ± 0.05; Putirka, 2008). Given
460
that the pressure dependency on temperature estimates is negligible, we fixed a crystallisation pressure (see below) 461
in order to better constrain the magmatic temperature. We stress that a large pressure variation of around 500 MPa 462
induces a temperature variation within the method’s error (Putirka, 2008). In contrast, a critical point with these 463
models concerns the pre-eruptive water content of magmas, because a change of 1 wt.% H2O induces a variation
464
of ~20ºC (i.e. Putirka, 2008; Samaniego et al., 2011; Arpa et al., 2017). In this work, we consider water content of 465
6 wt.%, which corresponds to the maximum values measured in melt inclusions. In Table 7, we summarize 466
temperature estimates for the ADR group. As for the previous thermometers, the plagioclase-melt formulation 467
shows a decrease in magmatic temperatures from andesites (881 ± 5 ºC, n=6) to dacites and rhyolites that show 468
lower but similar values (787 ± 11 ºC, n=5 and 813 ± 5 ºC, n=8 respectively). We should stress these estimates are 469
systematically lower than those obtained by the other methods (Table 7). 470
Amphibole stability in calc-alkaline magmas has been widely used to estimate its crystallization pressure. 471
The Al-in-hornblende barometer has been experimentally calibrated for different ranges of temperature (Johnson 472
and Rutherford, 1989; Schmidt, 1992; Mutch et al., 2016). These formulations stipulate that the aluminium content 473
(AlT) of amphibole is proportional to the crystallization pressure at specific conditions defined by a mineral
474
assemblage composed of plagioclase, sanidine, amphibole, biotite, quartz, sphene and Fe-Ti oxides. Given that 475
quartz is absent from the equilibrium assemblages at Ubinas, even from the rhyolitic magmas, this barometer 476
would yield anomalously high pressures. On the other hand, Ridolfi et al. (2010) and Ridolfi and Renzulli (2012) 477
looked again into amphibole stability in calc-alkaline magmas and proposed new empirical P-T-fO2-XH2O
478
formulations based on amphibole chemistry. However, many authors consider that AlT in amphibole is sensitive
479
to both pressure and temperature variations (Poli and Schmidt, 1992; Anderson and Smith, 1995; Bachmann and 480
Dungan, 2002; Kiss et al., 2015). This implies that this barometer should be used within the specific temperature 481
range at which it was calibrated. In order to test the accuracy of these models, Erdmann et al. (2014) compared the 482
experimentally determined P-T conditions of a set of amphiboles with the values calculated using Ridolfi et al. 483
(2010) and Ridolfi and Renzulli (2012) formulations. Based on this analysis, Erdmann et al. (2014) concluded that 484
temperature estimates are acceptable, whereas pressure values are seriously flawed. Temperature estimates 485
obtained from the Ridolfi et al. (2010) and Ridolfi and Renzulli (2012) methods also show a decrease in magmatic 486
temperature from andesites to rhyolites groups (Table 7), although the absolute values are 30-60ºC higher than 487
those obtained with the magnetite-ilmenite, amphibole-plagioclase and plagioclase-melt thermometers. It is worth 488
noting that following Ridolfi and Renzulli (2002) method, for dacitic and rhyolitic magmas we obtain very similar 489
values for fO2 that those obtained with the magnetite-ilmenite pairs (DNNO = 1.7 ± 0.3, n=45).
490
Pressure estimates are summarized in Table 7. We observe that most barometers show a progressive 491
decrease in amphibole crystallization pressure through the ADR samples. However, we should stress that the 492
temperature estimated for ADR group did not match those of the most common experimental calibrations (Johnson 493
and Rutherford, 1989; Schmidt, 1992; Mutch et al., 2016). For this reason, we focus on other calibrations that take 494
into account the influence of temperature on AlT (Anderson and Smith, 1995) or by applying the formulation that
495
uses the VIAl for barometry (Médard and Le Pennec, 2013; Manrique et al., 2020). If we focus on amphibole
496
phenocryst of rhyolites and fixing the temperature at 820ºC (see above), we obtain 228 ± 86 MPa (n = 16) using 497
the temperature-corrected barometer of Anderson and Smith (1995). Using the temperature independent barometer 498
of Médard and Le Pennec (2013), we obtain rather higher values of 316 ± 51 MPa, which are indeed in the error 499
range of the methods. Other concordant results were obtained using the empirical barometers of Ridolfi et al. 500
(2010) and Ridolfi and Renzulli (2012), which yield similar values (237 ± 81 MPa and 252 ± 91 MPa, 501
respectively). In summary, it seems plausible that amphibole in silica-rich magmas (dacites and rhyolites) 502
crystallized at 200-400 MPa (Fig. 11) and temperatures in the range of 800-850ºC. 503
504
BA magmas. Given the presence of ortho- and clinopyroxene in BA and andesitic magmas, a suitable
505
geothermometer is the two-pyroxene thermometer (cf. Lindsley, 1983). Rivera et al. (2014) applied this 506
thermometer for the 2006-2009 magmas and obtained temperatures of 950-1020ºC (n=6). A careful observation 507
of these orthopyroxene-clinopyroxene pairs reveals that most of them do not follow the equilibrium criteria defined 508
by the comparison of the calculated exchange coefficients with the putative values from the literature (KdFe-Mg =
509
1.09 ± 0.14; Putirka, 2008). This analysis shows that only two orthopyroxene-clinopyroxene pairs from Rivera el 510
al. (2014), one pair from our dataset and five additional pairs from older samples of older Ubinas samples (Rivera, 511
2010) follow the equilibrium criteria. These pairs yield a temperature of 993 ± 24 (n=8) for BA samples. This 512
value is very close to the temperatures obtained with the amphibole-based Ridolfi et al. (2010) method (994 ± 9ºC, 513
n=23). 514
Given that most barometers are not calibrated for basaltic andesitic compositions, that the mineral 515
assemblage of these magmas do not meet those needed for the method, and that the temperatures obtained for the 516
BA group are far from the calibration temperatures of most barometers, the pressure estimates for this group are 517
much more difficult to compute. In addition, we observe that the temperature-controlled edenite substitution is 518
much more important than the pressure-controlled tschermakite substitution (Fig. 8), which implies that the 519
differences in amphibole chemistry are mostly related to temperature, with a minor role for pressure and magma 520
chemistry. The empirical barometers of Ridolfi et al. (2010) and Ridolfi and Renzulli (2012) yield pressures of 521
453 ± 26 MPa and 357 ± 138 (n = 23) respectively, whereas the temperature-independent barometer of Médard 522
and Le Pennec (2013) yields values of 341 ± 35 MPa (i.e. no difference between amphiboles from ADR and BA 523
groups, Fig. 11). Given the uncertainties associated with the application of these models to the BA magmas, we 524
conclude that these amphiboles probably crystallized at higher pressure (>300-400 MPa) and temperatures (1000-525 1050ºC). 526 527 Figure 11 528
Table 7 529
530
5.2. The origin of the magmatic diversity: trans-crustal assimilation and fractional crystallization
531
processes
532
The magmatic differentiation in continental arc settings is a complex process including fractional 533
crystallization coupled with crustal assimilation at several levels in the crust. In addition, frequent recharge and 534
the subsequent magma mixing process is ubiquitous of active magmatic systems. We should stress that these 535
processes are not mutually exclusive, acting at the same time during magma ascent and storage across the crust. 536
Given that the Andean Central Volcanic Zone developed on a thick (up to 70 km) continental crust, it represents 537
the archetype for studying the crustal participation on continental arc magmatism. Most studies consider these 538
magmas stagnate at different levels in the crust and acquire its geochemical signature at the so-called MASH 539
(Melting-Assimilation-Storage-Homogenization) zones located in the deep and hot lower crust (Hildreth and 540
Moorbath, 1988; Davidson et al., 1990; Muir et al., 2014). Then, intermediate magmas could stagnate again at 541
shallow levels, where they differentiate via a coupled assimilation-fractional crystallization process. More 542
recently, Blum-Oeste and Wörner (2016) identified three different geochemical end-members able to explain the 543
whole variability of CVZ magmas: (1) a slightly evolved calc-alkaline basaltic andesite; (2) an enriched 544
shoshonitic basalt; and, (3) a crustal-derived rhyodacite. These authors propose that all CVZ magmas derived from 545
mixing process at variable proportions of these three end-members. 546
The Ubinas magmatic series, which is composed of basaltic andesites through to rhyolites, has been 547
interpreted as a result of a coupled assimilation and fractional crystallization process occurring at different depth 548
in the crust (Thouret et al., 2005; Rivera, 2010). These authors also suggest that the mafic magmas resulted of a 549
deep crustal differentiation process involving amphibole and/or garnet. Our geochemical data shows a conspicuous 550
break-in-slope observed at 56-57 wt.% SiO2 in compatible elements (MgO, Ni, Sr, Fig. 4). This feature indicates
551
the early crystallization of an olivine-dominated cumulate in BA magmas, followed by the fractionation of 552
clinopyroxene, amphibole and plagioclase for ADR magmas. In addition, the frequent zoning patterns observed 553
in plagioclase and pyroxenes; and, the fact that the matrix glass compositions fall on the main Ubinas geochemical 554
trend (Fig. 10), corroborates the progressive fractionation process. 555
Experimental data on crystallization of primitive arc magmas at mid- to lower-crustal pressures show a 556
continuous geochemical trend from primitive magnesian basalts up to high-silica rhyolites (Müntener et al., 2001; 557
Sisson et al., 2005; Pichavant and Macdonald, 2007; Alonso-Perez et al., 2009; Blatter et al., 2013; Nandedkar et 558
al., 2014). These experiments were performed from near-liquidus temperatures (~1150-1200ºC) down to 559
temperatures as low as 700ºC; pressures ranging from 900 to 400 MPa; and at oxidizing (NNO+2) and moderately 560
hydrous (~3-4 wt.% H2O) conditions. At high pressure and temperature (900-700 MPa; 1200-950ºC), the dominant
561
crystallizing minerals are clinopyroxene + olivine + Cr-Spinel ± orthopyroxene. At lower pressure and 562
temperature, plagioclase begins to crystallize, Fe-Ti oxides replaces spinel, olivine dissolves and amphibole 563
crystallization begins (at temperatures below ~1000ºC). At the end of the crystallization sequence, apatite, quartz 564
and biotite appear as liquidus phases. In Fig. 10 we compare the major element compositions of the whole-rock 565
and matrix glasses and melt inclusions from Ubinas with fields of selected experimentally-determined liquids 566
(Sisson et al., 2005; Blatter et al., 2013; Nandedkar et al., 2014). We observe a reasonable correspondence, except 567
for the mafic compositions (> 5 wt.% MgO), which are lacking in the Ubinas magmatic series, and globally lower 568
values of K2O (not shown), related to the composition of the starting material. These results imply that the
569
commonly observed mineral assemblage in Ubinas samples records a long crystallization sequence, roughly 570
spanning from 900 to 200 MPa, and from 1150 to 700ºC. 571
Additional constraints on magmatic differentiation come from trace elements systematics. The negative 572
correlation of Sr with silica increase suggest a significant role of plagioclase, whereas the decrease of the transition 573
metals (e.g. Ni, Sc, V) suggest the fractionation of clinopyroxene and olivine, namely for BA group. In addition, 574
trace element systematics supports the leading role of amphibole fractionation for the ADR group. On the basis of 575
theoretical and experimental studies, amphibole preferentially incorporates MREE over HREE and LREE (cf. 576
Davidson et al., 2007). This observation is corroborated by the Ubinas amphibole trace element patterns (Fig. 9), 577
which show that fractionation of this mineral leads to an increase in La/Nd and a decrease in Nd/Yb and Dy/Yb 578
with silica contents in the magma (Fig. 12a, b). In order to test the hypothesis of an amphibole-controlled fractional 579
crystallization process, we performed a two-steps geochemical modelling procedure. First, major element mass-580
balance calculations (Bryan et al., 1969) between mafic and felsic end-members (e.g. 18C and UBI-10-581
11, respectively) allow us to estimate the modal composition of the cumulate (46–48% Pl + 38–44% Amph + 3– 582
5% Cpx + 6% Mag + 1% Apt), as well as the degree of fractionation (50-55%) required to evolve from a BA to a 583
ryholitic end-members. It is worth noting that the modal composition of the cumulate estimated by mass-balance 584
is coherent with the observed mineral assemblage of Ubinas samples and confirms the leading role of amphibole 585
fractionation. Then, these results were used in the trace element modelling of a Rayleigh-type fractional 586
crystallization (FC), using partition coefficients for intermediate liquids (Rollinson, 1993; Bachmann et al. 2005; 587
Rivera et al., 2017). We also observe that isotopic ratios are correlated with silica as well as with some trace 588
elements ratios (e.g. Dy/Yb, Fig. 12c, d), and that the higher values for both parameters (i.e. Dy/Yb and 589
143Nd/144Nd) roughly correspond to the BA samples. Consequently, a pure fractional crystallization processes
590
cannot explain these variations: the changes in isotopic ratios clearly point at of some degree of crustal 591
assimilation. Based on this observation, we performed an assimilation-fractional crystallization (AFC, DePaolo, 592
1981) model, using exactly the same parameters than for the FC model, with different fractionation/assimilation 593
ratios (r = 0.04-0.10) and using the local upper continental crust represented by the Precambrian Charcani gneiss 594
(Boily et al., 1990; Rivera et al., 2017) as a potential contaminant. The modelling results for both FC and AFC 595
models are shown in Fig. 13. These models show a good agreement for most trace elements in the multi-parameter 596
plot (Fig. 13a), as well as in the binary plots including key trace elements ratios and isotopic rapports (Fig. 13b, 597
c), although a mismatch is observed for some trace elements as the LREE. These models suggest a proportion of 598
assimilated crust of 2-6 vol.% (following the procedure of Aitcheson and Forrest, 1994). 599
Lastly given that Sr-Nd-Pb ratios plot far beyond the mantle values, with only weak isotopic variations 600
between the basaltic andesitic and rhyolitic end-members (with a silica variation of more than 15 wt.%), we suggest 601
that the isotopic signature of BA Ubinas magmas was mostly acquired at a deep stage of magmatic differentiation, 602
probably in the lower crust MASH zone. Single mass-balance models confirm that 20-30% of a putative lower 603
crust is needed to shift the mantle-derived magmas to those of the BA Ubinas samples. Given the large 604
uncertainties concerning the deep fractionation processes as well as the lower crustal compositions, we did not 605
perform a quantitative analyse of these deep processes. However, this two-steps model has been applied on a 606
regional Andean scale (Hildreth and Moorbath, 1988; Mamani et al., 2010; Blum-Oeste and Wörner, 2016; 607
Ancellin et al., 2017) as well as to specific volcanic centres such as the Andahua monogenetic cones (Delacour et 608
al., 2007), El Misti (Rivera et al., 2017), Ollagüe (Feeley and Davidson, 1994; Matioli et al., 2006), Nevados de 609
Payachata (Davidson et al., 1990), and Lascar (Sainlot et al., 2020) in the CVZ; and Cotopaxi (Garrison et al., 610
2011) and Tungurahua volcanoes (Nauret et al., 2018) in the NVZ. 611 612 Figure 12 613 Figure 13 614 615
5.3. The magmatic plumbing system and the progressive temporal changes in magma chemistry
616
The geochemical data for the Ubinas magmatic series reveals a large compositional variation that could 617
be explained by a coupled assimilation-fractional crystallization (AFC) process involving a mineral assemblage 618
composed of plagioclase, amphibole, orthopyroxene, clinopyroxene, Fe-Ti oxides, with minor olivine and biotite 619
(at the mafic and felsic end-members respectively). A key geochemical characteristic of the Ubinas magmatic 620
series is the overall variation of most geochemical parameters. As discussed above, Ubinas magmas become less 621
differentiated through time (Fig. 3, 4, Supplementary materials 5 and 6), with the recently erupted magmas (the 622
BA group) displaying the highest 143Nd/144Nd and lowest 87Sr/86Sr isotopes (Fig. 5, Supplementary materials 6),
623
indicating that BA magmas are among the most primitive compositions erupted during the last millennium. In 624
addition, as demonstrated by Rivera et al. (2014) for the 2006-2009 eruptions, and corroborated by 2013-2017 625
magmas (this work), the BA magmas display frequent disequilibrium textures, such as inversely zoned plagioclase 626
phenocrysts with sieve textures and overgrowth rims, inversely zoned clinopyroxene phenocrysts, and rare olivine 627
crystals with reaction and overgrowth rims. These features point to a magma mixing scenario between two magmas 628
of similar basaltic andesitic compositions but different temperature and volatile contents (Rivera et al., 2014). 629
Thus, we infer that during the historical and recent eruptions the trans-crustal magmatic reservoir was fed by mafic 630
magmas at depth. In contrast, it is worth noting that disequilibrium textures and other magma mixing evidences 631
(e.g. banded samples) are absent in the ADR samples. However, we should stress that mixing of hybrid magmas 632
of different degrees of differentiation is a ubiquitous process at the trans-crustal magmatic systems. 633
Due to the thick continental crust, primitive basaltic magmas are extremely rare in the Central Andes, 634
with notable exceptions, for example the Andahua monogenetic cones in Southern Peru (Delacour et al., 2007; 635
Sørensen and Holm, 2008). On the whole, the primitive Central Andes magmas display variably enriched trace 636
element patterns as well as variable radiogenic isotopic signatures (Mamani et al., 2010; Blum-Oeste and Wörner, 637
2016), which must have been acquired at the so-called lower-crustal hot zones (Hildreth and Moorbath, 1988; 638
Annen et al., 2006). During their ascent from the lower crust, these magmas stall at different levels in the thick 639
Central Andes crust and then feed the middle-to-upper crustal magma system. 640
On the basis of the petrological data presented in this work, we are able to reconstruct the upper part of 641
the magma plumbing system over the last millennia. Although most barometers indicate two distinct pressure 642
populations for ADR and BA magmas, we cannot confirm these differences due to the fact that most magmas 643
(namely the BA group) do not meet neither the mineralogical assemblage nor the temperature range stipulated for 644
the models. If we focus on most differentiated magmas of Ubinas series (dacites and rhyolites), and taking into 645
account the intrinsic uncertainties related with the methods, we consider that amphibole from these magmas 646
crystallized in the range of 200-400 MPa, which is realistic for dacitic and rhyolitic magmas in arc settings 647
(Rutherford and Hill, 1993; Moore and Carmichael, 1998; Martel et al., 1999; Scaillet and Evans, 1999; Rutherford 648