WORKING
PAPERS
SES
N. 499
I.2019
Faculté des sciences économiques et sociales Wirtschafts- und sozialwissenschaftliche Fakultät
The effects of anti-corruption
videos on attitudes towards
corruption in a Ukrainian
online survey
Elena Denisova-Schmidt,
Martin Huber, and
Yaroslav Prytula
1
The effects of anti-corruption videos on attitudes
towards corruption in a Ukrainian online survey
Elena Denisova-Schmidt∗, Martin Huber∗∗, and Yaroslav Prytula∗∗∗ ∗ University of St.Gallen (HSG), Switzerland
∗∗ University of Fribourg, Switzerland ∗∗∗ Ukrainian Catholic University, Ukraine
Abstract: This paper presents the outcomes of an anti-corruption educational intervention among Ukrainian students based on an online experiment. More than 3,000 survey participants were randomly assigned to one of three different videos on corruption and its consequences (treatment groups) or a video on higher education (control group). The data suggest a high level of academic dishonesty and misconduct among young people, but also a negative attitude towards corruption in general, highlighting the ambivalence of corruption in the country. We find that one video, which presented a thrilling story about a victim of corruption related to common bribery in an accessible way, was effective in promoting awareness of the negative consequences of corruption. In contrast, the other two treatment videos, which more closely followed the style of TV news or documentaries on corruption, did not generally promote negative attitudes towards corruption. Presenting corruption issues in a catchy way therefore appears to matter for the effectiveness of such interventions.
Keywords: Anti-Corruption Campaigns, Experiments, Corruption, Academic Integrity, University, Students, Ukraine.
JEL classification: D73, C93.
This study was conducted with financial support provided by the Center for Governance and Culture in Europe at the University of St.Gallen (HSG), Switzerland. The sponsor influenced neither the research design nor the interpretation of the results.
Addresses for correspondence: Elena Denisova-Schmidt ([email protected]), University of St.Gallen (HSG), Gatterstr. 3, 9010 St. Gallen, Switzerland, Martin Huber ([email protected]), University of Fribourg, Bd. de Pérolles 90, 1700 Fribourg, Switzerland, and Yaroslav Prytula ([email protected]), Ukrainian Catholic University vul. Kozelnytska 2a, 79011 Lviv, Ukraine.
∗Elena Denisova-Schmidt is also affiliated with the Center for International Higher Education, Boston College, United States.
2 1. Introduction
Many universities around the world face a lack of academic integrity on the part of a range of involved stakeholders: administrators, faculty, staff and students, as well as other related actors and agencies (see the recent discussions in Chapman and Lindner, 2016, Bretag, 2016, Denisova-Schmidt, 2017). Students and their explicit and implicit involvement in such activities are especially crucial in this chain. The way young people experience and perceive corruption – its techniques, frequency and acceptance – likely affects their professional lives. The potential damage to the national and global economy can hardly be underestimated (cf. Cohn, et. al., 2014). Effective preventive and control measures are therefore crucial for tackling corruption. One such remedy might be an educational campaign using online videos highlighting the negative consequences of corruption, the design and effects of which are experimentally examined in this paper.
More concisely, we investigated how anti-corruption videos accessed via social media influenced the attitudes towards corruption of students in Ukraine that participated in an online survey. The effects that social media might have on their users are unquestionable, especially in light of the recent Facebook-Cambridge Analytica data scandal. Yet social media might also yield positive effects positive in terms of anti-corruption civic activities (cf. Marinov and Schimmelfennig, 2015). Why Ukraine? Ukraine is a rather unique case: it is one of the most corrupt countries in the world, with one of the worst ratings among post-Soviet republics (cf. Transparency International Index). At the same time, however, Ukraine is one of the leading countries protesting against corruption1
(cf. Denisova-Schmidt, et. al., 2018, Denisova-Schmidt and Prytula, 2018). Young people and students were the driving forces in all of the recent revolutions in Ukraine (the Revolution on Granite in 1990, the Orange Revolution in 2004, and the Revolution of Dignity in 2014).
Our paper is broadly related to educational campaigns, which can be effective in many different contexts. They might, for instance, forestall dangerous situations, increase safety and foster professional and personnel success (cf. Schwappach et al. 2013, Cole, 2014, and McGuigan, et. al. 2016). More specifically, we aim to contribute to the literature on lab, field or natural experiments examining causal effects on corruption-related issues; see, for example, the discussions in Armantier and Boly (2011, 2013), Barr and Serra (2010), Findley et al. (2014), Holmes (2015), Serra and Wantchekon (2012). We are particularly interested in the contradictory effects that educational interventions might produce, promoting the behaviour that they are actually trying to prevent and/or condemn, for instance by raising awareness about its existence. This may be the case
1 In this paper, we follow the definition of corruption provided by Transparency International (TI): ‘the abuse of
entrusted power for private gain’. When referring to higher education, we use a broader approach and include as corruption ‘the lack of academic integrity’ (Denisova-Schmidt, 2018).
3
with anti-drug media campaigns (Hornik et al. 2008) or reality shows on teen pregnancy (Wright, et al., 2012). More closely related to corruption, an experiment conducted by John et al. (2014) among students in the US suggests that awareness of widespread dishonest behaviour increases cheating while monetary incentives have less of an impact. Similar results were found in an information experiment by Corbacho et al. (2016) in Costa Rica. Participants who believed that everyone else was corrupt and/or who had had personal experience with corruption in the past were more likely to engage in corrupt behaviours themselves. In addition, Denisova-Schmidt et al. (2015) and Denisova-Schmidt et al. (2016a) found similarly perverse effects of anti-corruption educational campaigns for specific subgroups: students at selected Ukrainian public universities who had not previously been involved in monetary corruption or deceiving faculty members learned about the extent of this phenomenon from the anti-corruption materials used in the experiment and became more tolerant towards corruption. See also the study by Denisova-Schmidt et al. (2017), who found that, for students at public universities in the Russian Far East, anti-corruption interventions (brochures or cartoons) might increase tolerance towards academic dishonesty among specific subgroups (non-plagiarizing students) while promoting negative views on corruption in other groups (excellent students and students with well-educated fathers).
The experiment presented in this paper (a.) considers the effects of three different videos on aspects and consequences of corruption (treatment groups) compared to a video on higher education (control group) and (b.) is conducted in the context of social media among more than 3,000 online survey participants, rather than at university campuses. In contrast to our previous study (Denisova-Schmidt et. al., 2017), which tested the effects of cartoons showing rats as the main characters2, this
study used videos with real people as the main characters. Our findings suggest that videos spread via social media might be an appropriate tool to promote awareness about the negative consequences of corruption among students, but the way the corruption issue is presented and communicated matters for the effectiveness. Specifically, we find that one video, which presented the consequences of corruption in a thrilling and accessible way based on telling a personal story related to common issues of bribing, promoted negative attitudes towards corruption in several dimensions. Online survey participants exposed to this video more often judged corruption to be a crime and evil, and to have a negative impact on one’s health, security, the healthcare system and
2 ‘Ten Faces of Corruption’, a cartoon series developed by Transparency International Russia as part of the educational
project ‘The Alphabet of a Corruption Fighter’.
Transparency International Russia (2015a). Episode 1: Bribe. YouTube video. https: //www.youtube.com/watch?v=zGeworhwEFo, accessed December 2018.
Transparency International Russia (2015b). Episode 3: Corruption corporate raid.
4
the economy of Ukraine. These findings also persisted when applying machine learning methods to (a.) account for multiple hypothesis testing issues (i.e. spurious effects), and (b.) control for minor covariate imbalances across treatment groups due to attrition or imperfect randomization. The remaining two treatment videos presented corruption issues more formally in a way that resembles TV news reporting or documentaries, one of which provided statistics and information on countermeasures against corruption, while the other discussed the legitimacy of academic cheating under certain circumstances. Neither video appeared to negatively affect attitudes towards corruption. If anything, they seemed to foster sympathy for the existence of corruption, although the comparably few statistically significant effects might be spurious due to multiple hypothesis testing. The remainder of this study is organized as follows: Section 2 describes the research design and the data; Section 3 presents the empirical analysis and results. In addition to the experimental treatment effects, this section provides an analysis of sample attrition as well as a discussion of machine learning-based methods to investigate multiple hypothesis testing issues, tackle imbalances of observed covariates across treatment groups and analyse effect heterogeneity across covariates. Section 4 concludes.
2. Research design and data
The research design and data collection were implemented on our behalf by the sociological company FAMA, located in Lviv, Ukraine. A Facebook account, @atlantynespisuyut (Engl.: Atlantes do not cheat), was created and regularly updated from October 2016 on. Questions regarding academic integrity as well as some current issues in Ukrainian higher education were discussed in the Facebook group. In parallel, we assigned the PR agency Tvoe Mesto, also based in Lviv, to prepare three videos according to our guidelines showing several typical cases of corruption as well as a ‘control’ video that discusses modern means of education but does not touch on corruption at all. One video was obtained from the Kyiv-based production studio 315film for non-commercial usage. Using Facebook, direct mailings to various student groups and announcements on the FAMA homepage, as well as some additional channels, respondents were recruited to participate in our survey. A potential respondent was supposed to answer the first part of the online survey, consisting of questions about their studies (major, academic year, academic achievements), demographics and socioeconomic characteristics as well as on their personal experience with and/or witnessing of questionable behaviour related to bribing or unsound methods in the education system. Then the students were to watch a video randomly assigned to them and afterwards continued with the second part of the survey, which also contained questions related to corruption (as in Denisova-Schmidt et al., 2016b), such as whether they viewed corruption in a
5
rather negative (‘evil’ and ‘crime’), pragmatic (‘necessity’, ‘a way of solving problems’), positive (‘a way of getting income’ and ‘compensation for low wages’), neutral (‘temporary situation’ and ‘part of life’) or typically ‘Ukrainian’ (‘tradition’ and ‘national peculiarity) way. Similar to Denisova-Schmidt et al., 2017, the respondents were also asked how they perceived the impact of corruption on their personal quality of life, education, health and safety, and on the Ukrainian economy. At the end of the survey, participants could optionally take part in a lottery to win a small monetary prize, which will be analysed in a companion paper. The survey experiment was run between May and October 2017.
Students from more than 550 educational institutions in 128 cities participated in the survey, although substantial attrition occurred during question answering (the reasons for which are discussed below). Almost all regions of the country were represented, with most students coming from (in descending order) Lviv, Kyiv, Ivano-Frankivsk, Kharkiv, Ternopil and Dnipro. 99.7% of all respondents who indicated the location of their university were Ukrainian students. In some cases, the survey was completed by students who, at the time of answering, were studying abroad, particularly in Poland, Germany or the United States of America. The majority of the respondents were women (83.3%). Most respondents (89.1%) chose the Ukrainian language to complete the online application form (the questionnaires were offered in two languages – Ukrainian and Russian).
Over the data collection period, more than 15,000 users visited the website, out of which 9,152 started answering the survey questions. However, only 3,034 respondents reached the end of the survey. The high attrition rate is likely due to the following reasons:
1) Curiosity, but no willingness to participate in the survey: out of the 15,000 visitors of the site, almost six thousand of them did not interact with the questionnaire at all. 1,761 indicated a language they were comfortable with, but immediately left the questionnaire tab.
2) Sensitive questions: many respondents dropped out at the questions on personal experience with and/or witnessing questionable behaviour. These include ‘Have you, your friends or relatives ever encountered violations (bribes, gifts, help in answering) when taking the ZNO (the External Independent Exam)?’ with 339 drop-outs and ‘How often have you heard about situations where your friends or relatives solved their problems with a bribe?’ with 272 drop-outs.
3) The length of the questionnaires: during the pilot phase, we observed the duration required for filling out the questionnaire to be in the range of 7 to 27 minutes. A large number of students appear to have left the survey prematurely due to fatigue.
4) Technical problems: thanks to comments from Facebook users, we were informed about several issues with video playback in October 2017. Those problems were rapidly solved, but we had 3,017 survey participants who did not return after watching a video. It is not known how many users
6
returned to the questionnaire after encountering technical problems, and how many dropped out because of them. While the latter likely increased attrition rates, this is applicable to all videos; therefore, the experimental design based on randomization into various videos was not jeopardized by this issue. This is corroborated by similar dropout rates while watching the video across treatments that range from 24 to 26.7%, which are not statistically significantly different from each other.
In what follows, we briefly discuss the content of the four exclusively and randomly assigned videos. Three of them are treatments in the sense that they aim at creating awareness about the consequences of corruption, while the fourth, which is presented to the control group, is on modern means of education.
Video 1: ‘He paid’ (duration: 1 minute and 4 seconds)3.
The video is presented as a story told by a child who is shown only at the end of the movie. The boy begins by saying how his mother and father met each other eight years ago: a young man was in a rush early in the morning; he was driving a car and breaking the rules in order not to be late for work. A transport police officer stopped him, but the young man paid a bribe and was not punished. At this occasion, he met a young lady who was also paying a bribe to the same police officer. Later, they both became a couple. The policeman had a son, apparently a very lazy boy, who becomes – thanks to a bribe − a student at a very prestigious medical university and graduates from it. By this time, the couple is expecting a baby and the student is working as a gynaecologist. By accident, they all meet in a maternity ward, where the doctor assists the young woman with the delivery. Obviously, the doctor made some professional mistakes and the child suffered a birth trauma. Finally, the storyteller is shown sitting in a wheelchair: he has cerebral palsy and cannot move or talk to his parents. If he were able to talk, he would say to them that, by paying a bribe, they are paying with the future of their children. The video is very emotional; it appeals to the prevalence of endemic corruption in Ukrainian society by showing a worst-case scenario for corruption in higher education: that unqualified people might get positions where they are responsible for their lives of others. But the message is much broader: both parents have ‘contributed’ to the disability of their child, too, even if indirectly.
Video 2: ‘About corruption’ (duration: 1 minute and 14 seconds).
A young lady, a journalist, is making some statements on the recent anti-corruption developments in the country after the Euromaidan 2014 protest movement. She refers to the data provided by the
7
Ukrainian subchapter of Transparency International, an NGO working on corruption worldwide, and cites data from other sociological institutions and the American Chamber of Commerce. The video is much closer to a typical analysis made by TV news channels, with the pragmatic representation of information, some observations and actual statistics. The main message is that, while corruption exists, many countermeasures and remedies have been taken in the country and progress is visible.
Video 3: ‘Essays on Ecology’ (duration: 1 minute and 38 seconds).
The focus of this video is on a young lady, a full-time student in her fourth year majoring in economics. She says that she is now preparing an academic paper for a class on ecology, a discipline that is not part of her core studies. She is going to download a paper for this class from the Internet and submit it as her own. Her justification goes beyond the usual ‘unnecessary classes’ defence: she thinks that nobody will actually read this assignment. Moreover, she already works in her field. She says, however, that in her initial academic years, she attended all the lectures and completed all the homework assignments, but at one point she realized that there were other tools to do homework, especially for what she calls ‘bulimia learning’. The video focuses on the legitimacy of academic cheating under certain circumstances.
Video 4: ‘Modern Education’ (duration: 1 minute) (control video).
The video shows young people – students – working on computers in multimedia rooms and sitting in university auditoriums listening to an apparently fascinating presentation. A young lady describes how innovative the current higher education system is, how much it has to offer and how important it is for the lives of young people.
Our final evaluation sample is comprised of 3,196 respondents (see also the discussion in Section 3), for some of whom item non-responses occur for a subset of variables. While all of the oblasts of Ukraine are represented, the majority of the respondents were located the Lviv region (26.5%), Kyiv region (20.1%), Dnipro region (6%), Kharkiv region (5.6) and Ivano-Frankivsk region (5.2%). Most lived in urban areas (77.4%) while 22.2% indicated that they reside in villages and small settlements. Humanities (31.5%), social sciences (26.1%) and technical subjects (24.7%) were the dominant fields of studies, in contrast to natural (7.6%) and medical (9.0%) sciences. 73.3% of respondents studied in a publicly financed program, while 26.4% paid private tuition fees. 18% of respondents were in the first year, 18.8% in the second, 23.2% in the third and 21.3% in the fourth year of their bachelor’s program. 17.6% were enrolled in a master’s program. 94.7% of respondents were born between 1994 and 2000, i.e. they were 17 to 24 years old at the time of the survey.
8
Interestingly, and somewhat surprisingly, 82% of the respondents were female. While it is common to have a higher percentage of female response rates in surveys (Moore & Tarnai 2002; Singer et al 2000; Smith 2008), the gender difference in participation in our study is likely driven to some extent by the higher share of female students in Ukrainian universities overall and imbalances in enrolment across various fields. Kogut (2014) points out that 52.3% of all students at Ukrainian universities in the 2013-14 academic year were women, making up 79% in humanities, 77% in social sciences, 74% in medicine, 62% in natural sciences, but only 22% in technical studies. 39.3% of respondents indicated that they live in a student dorm, while 17.5% rent accommodations and the rest live with their parents or in an owned home. 39.5% worked part-time for an average of 6.2 hours per day. Only 3.8% had studied abroad. Interestingly, 21.3% claimed their most common grades to be ‘excellent’, 44.2% between ‘good’ and ‘excellent’, 14.6% ‘good’, 16.7% between ‘satisfactory’ and ‘good’ and only 2.9% to be ‘satisfactory’. 31.2% of the respondents mentioned ‘getting a good education’ as their main motivation for obtaining a university degree, while 51.1% mentioned ‘getting a good job’. Other reasons included ‘to get a university diploma’ (10%), ‘to please parents’ (2.3%) and ‘because everyone does so’ (1.6%). An almost equal number of respondents reported a daily preparatory time of more than 3 hours (31%), 2-3 hours (26.9%), or 1-2 hours (1-26.8%). 11-2.1-2% indicated less than one hour per day. Table 1 provides detailed demographic, social and educational characteristics of the respondents.
Table 1: Descriptive statistics Non-missing
observations Number of cases % of observations
Gender 3148 male 526 16.71%
female 2622 83.29%
Language 3196 Ukrainian 2848 89.11%
Russian 348 10.89%
Form of education 3186 state stipend 2342 73.51%
own costs 844 26.49%
Field of study 3186 humanities 1007 31.61%
social sciences 833 26.15%
technical studies 791 24.83%
natural sciences 243 7.63%
medical science 287 9.01%
sports sciences 25 0.78%
Study year 3186 first 576 18.08%
second 600 18.83% third 741 23.26% forth 680 21.34% fifth 384 12.05% sixth 180 5.65% internship 9 0.28% postgraduate 16 0.50%
Study mode 3186 full-time student 3044 95.54%
part-time student 138 4.33%
external student 4 0.13%
Year of birth 3143 before 1996 683 21.73%
9
1997 542 17.24%
1998 589 18.74%
after 1998 802 25.52%
Place of origin 3149 city, more than 1 mln
pop 571 18.13% city, 0.5 to 1 mln pop 425 13.50% city, 0.25 to 0.5 mln pop 468 14.86% city, 0.05 to 0.25 mln pop 449 14.26% city, 0.02 to 0.05 mln pop 278 8.83% city, 0.002 to 0.02 mln pop 257 8.16% small city 218 6.92% village 483 15.34%
What are the most frequent marks you get at the university?
3187 satisfactory 93 2.92%
between satisfactory
and good 534 16.75%
good 466 14.62%
between good and
excellent 1414 44.37%
excellent 680 21.34%
How many hours per day do you spend for
self-study/homework/preparation to classes?
3186 none 90 2.82%
less than 1 hour 389 12.21%
1-2 hours 856 26.87%
2-3 hours 860 27.00%
more than 3 hours 991 31.10% Income status of the family 3021 enough for food only 215 7.12%
enough for food and
closing 347 11.49%
not enough for
durable goods 1229 38.29%
enough for durable
goods 1069 35.38%
enough for
everything 616 20.39%
Where do you live? 3016 dormitory 1192 39.52%
with parents/relatives 1177 39.02%
rent a flat 531 17.61%
own flat/without
parents 116 3.85%
Did you take the External Independent Evaluation before entering?
3196 yes 2750 86.05%
no 446 13.95%
Do you combine your study
with job? 3007 do not work 1809 60.16%
work and study 1198 39.84%
Study abroad 2998 yes 115 3.84%
no 2883 96.16%
Reasons to get higher
education 3187 good education good job 998 1632 31.31% 51.21%
diploma 321 10.07%
parents 72 2.26%
everyone does it 50 1.57%
other 114 3.58%
53.5% indicated that they had never encountered bribery at a university (with only 9.3% claiming that they had not even heard that bribes were accepted at universities), while 19% have encountered it rarely, 13.4% sometimes, 7.6% often and 3.6% reported to see it constantly. Concerning
non-10
monetary fraudulent practices, only 16.4% stated that they never use cheat sheets during exams, 51.4% never submit ready-made course papers downloaded from the Internet as their own and 79.8% never purchase course papers from others. At the same time, only 14.8% indicated that they never copy and paste parts of course papers from the Internet and 13.6% never cheat during tests or exams. Roughly half (49.8%) claimed to have never tried to lie to a teacher when explaining learning-related issues, while 76.3% have never asked a faculty member for preferential treatment. These findings are comparable to the results obtained by the authors in a face-to-face survey of 600 students from Lviv in 2015 (Denisova-Schmidt et al., 2015 and 2016). Table 2 presents the respondents’ experiences with corruption and fraudulent behaviour in secondary school, during the university entrance process and in university, while table 3 provides descriptive statistics for the outcome variables.
Table 2. Respondents’ experience with corruption
Questions Non-missing observations Categories Yes, I personally Yes, my friends/
(relatives) No, nobody Have you, your friends or relatives ever encountered
violations (situations in admissions commissions, in granting privileges and allocation of quotas, etc.) when entering the
university? 3172 265 8.35% 709 22.35% 2198 69.29%
never rarely sometimes. often missing
If you or your parents ever gave presents to teachers at school (candies, books, computer equipment, etc.), or, for example, paid for voluntary-compulsory tutoring classes with school teachers, how often did it happen?
3252 991
30.47% 880 27.06% 832 25.58% 406 12.48% 143 4.40% Have you ever heard that bribes are taken or given in the
higher education institution? 3172 296
9.33% 395 12.45% 799 25.19% 981 30.93% 701 22.10 % Have you ever heard of the situations when your friends or
relatives solved their problems by pulling strings? 3172 438 13.81% 675 21.28% 1115 35.15% 723 22.79% 221 6.97% How often have you heard about cases when your friends or
relatives solve their problems by bribe? 3172 380 11.98% 755 23.80% 1010 31.84% 812 25.60% 215 6.78% How often do you use the following practices:
Use cheat sheets at exams 3100 525
16.94% 951 30.68% 916 29.55% 525 16.94% 183 5.90%
Submit papers downloaded from the Internet 3100 1642
52.97% 798 25.74% 427 13.77% 186 6.00% 47 1.52%
Buy papers 3100 2550
82.26% 293 9.45% 160 5.16% 72 2.32% 25 0.81% Write papers plagiarizing some chapters from the Internet 3100 474
15.29% 785 25.32% 819 26.42% 729 23.52% 293 9.45%
Copy off during exams or tests 3100 435
14.03% 1037 33.45% 907 29.26% 544 17.55% 177 5.71%
Deceive professors about study problems 3100 1592
51.35% 872 28.13% 428 13.81% 155 5.00% 53 1.71%
Ask professors for preferential treatment 3100 2437
75.71% 427 13.77% 180 5.81% 45 1.45% 11 0.35% Have you ever personally encountered bribery at a university? 3100 1709
11
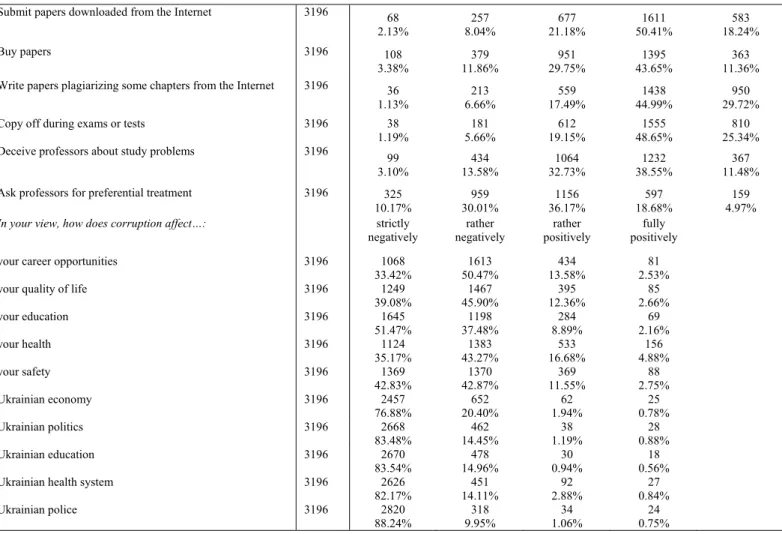
Our data suggest that students consider corruption to be a predominantly negative phenomenon: 84.83% judged corruption to be something rather ‘evil’ (answering either ‘rather so’ or ‘definitely so’; see table 3) and 87.96% to be a ‘crime’. A large share also saw corruption to be typically ‘Ukrainian’ (a ‘tradition’, 43.78%, and a ‘national peculiarity, 31.32%), considered it ‘a way of getting income’ (31.69%) or a ‘compensation for low wages’ (35.32%), a ‘temporary situation’ (14.39%) and a ‘part of life’ (14.95%). Taking a pragmatic stand, 2.44% found it to be a ‘necessity’ and 31.04% ‘a way of solving problems’. Academic dishonesty is widespread among young people. The most common cheating techniques were crib cheats: 95.08% reported using them ‘sometimes’, ‘often’ or ‘all the time’; see table 3. 93.15% engaged in other types of cheating during exams and tests, and 92.21% wrote term papers by copying and pasting from the Internet without acknowledging the sources. 84.76% reported that they ‘outsource’ their homework to other individuals and organizations, 89.83% have downloaded papers and submit them as their own. 83.32% have given misleading excuses for poor academic performance to faculty members, 59.82% to ask for preferential treatment. At the same time, the majority of respondents were concerned that corruption had a rather negative impact on their own career perspectives: 83.89% found it to be ‘strictly negative’ or ‘rather negative’. A large share also thought corruption negatively affects their own quality of life (84.98%), their own education (88.95%), their own health (78.44%) and their own security (85.70%), as well as more broadly the economy (97.27%), politics (97.93%), education (98.50%), medicine (96.28%) and the police (98.19%) in Ukraine.
Table 3. Respondents’ attitudes/opinions toward corruption after the treatment
Non-missing obs.
Categories
What does corruption mean to you?
definitely no rather no yes and no rather so definitely so
necessity 3196 2033 63.61% 23.50% 751 10.45% 334 2.00% 64 0.44% 14 means of income 3196 1173 36.70% 11.98% 383 19.62% 627 21.21% 678 10.48% 335 crime 3196 35 1.09% 1.28% 41 9.67% 309 22.25% 711 65.71% 2100 part of life 3196 1443 45.15% 19.62% 627 20.28% 648 11.48% 367 3.47% 111
means to solve problems 3196 739
23.12% 14.89% 476 30.94% 989 23.34% 746 7.70% 246
compensation for low salaries 3196 797
24.94% 14.30% 457 25.44% 813 24.53% 784 10.79% 345 temporary situation 3196 944 29.54% 30.26% 967 25.81% 825 11.92% 381 2.47% 79 tradition 3196 691 21.62% 14.39% 460 20.21% 646 31.51% 1007 12.27% 392 national peculiarity 3196 945 29.57% 18.55% 593 20.56% 657 23.12% 739 8.20% 262 evil 3196 31 0.97% 2.94% 94 11.26% 360 20.31% 649 64.52% 2062 How often do you think students use the following
practices? never rarely sometimes often all the time
Use cheat sheets at exams 3196 23
12
Submit papers downloaded from the Internet 3196 68
2.13% 8.04% 257 21.18% 677 50.41% 1611 18.24% 583
Buy papers 3196 108
3.38% 11.86% 379 29.75% 951 43.65% 1395 11.36% 363 Write papers plagiarizing some chapters from the Internet 3196 36
1.13% 6.66% 213 17.49% 559 44.99% 1438 29.72% 950
Copy off during exams or tests 3196 38
1.19% 5.66% 181 19.15% 612 48.65% 1555 25.34% 810
Deceive professors about study problems 3196 99
3.10% 13.58% 434 32.73% 1064 38.55% 1232 11.48% 367
Ask professors for preferential treatment 3196 325
10.17% 30.01% 959 36.17% 1156 18.68% 597 4.97% 159
In your view, how does corruption affect…: strictly
negatively negatively rather positively rather positively fully
your career opportunities 3196 1068
33.42% 50.47% 1613 13.58% 434 2.53% 81
your quality of life 3196 1249
39.08% 45.90% 1467 12.36% 395 2.66% 85 your education 3196 1645 51.47% 37.48% 1198 8.89% 284 2.16% 69 your health 3196 1124 35.17% 43.27% 1383 16.68% 533 4.88% 156 your safety 3196 1369 42.83% 42.87% 1370 11.55% 369 2.75% 88 Ukrainian economy 3196 2457 76.88% 20.40% 652 1.94% 62 0.78% 25 Ukrainian politics 3196 2668 83.48% 14.45% 462 1.19% 38 0.88% 28 Ukrainian education 3196 2670 83.54% 14.96% 478 0.94% 30 0.56% 18
Ukrainian health system 3196 2626
82.17% 14.11% 451 2.88% 92 0.84% 27
Ukrainian police 3196 2820
88.24% 9.95% 318 1.06% 34 0.75% 24
3. Empirical analysis and results
As has already been mentioned, our initial sample was prone to large attrition rates. Out of the 9,152 participants who started the online survey, 2,751 dropped out of the study prior to treatment assignment for the potential reasons given above. Therefore, the treatment was randomly assigned to the remaining 6,401 individuals. However, attrition or item non-response was also substantial after treatment randomization, when measuring the outcome variables: for only 3,196, or roughly half of the observations who were assigned a treatment, all outcomes are observed, while for 3,205 observations at least one outcome is missing. Such post-assignment attrition jeopardizes the consistency of the experimental evaluation of treatment effects if it is jointly influenced by the treatment and background characteristics that also affect the outcomes. This issue is known as Heckman-type sample selection (see for instance Heckman, 1979) in economics or collider bias in statistics.
13
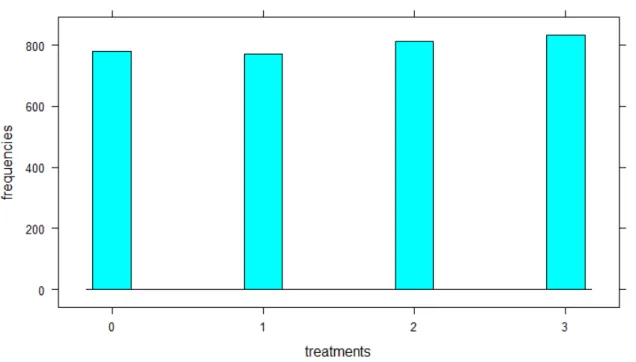
Note: 0 is control, 1 is treatment ‘he paid’, 2 ‘about corruption’. 3 ‘essays on ecology’.
To investigate whether attrition is selective with regard to the treatment, Figure 1 displays the frequencies of treatments among observations for whom all outcomes are observed. The treatment distribution appears to roughly follow a uniform distribution as expected under random assignment with constant treatment probabilities. In fact, the p-value of a chi2 test on differences in the
frequencies is 0.393, such that the uniform distribution cannot be rejected at any conventional level of significance in the sample without missing outcomes. As a second check for the selectivity of attrition, we create a binary indicator, which is 1 if at least one outcome is missing and 0 if all outcomes are observed and regress it on the treatment dummies. Table 4 presents the results. We do not find a statistically significant effect of the first video (‘He paid’) on attrition when compared to the control group, such that attrition appears to be random with regard to. the first treatment. Videos 2 and 3, however, statistically significantly (at the 5% level) reduce attrition by roughly 4% points, which may cause selectivity bias if attrition induces background characteristics to be imbalanced across treatments.
Table 4: Treatment effects on attrition and nonresponse
est se pval
constant (average attrition for control group with education treatment) 0.52 0.01 0.00
treatment he paid -0.01 0.02 0.72
treatment about corruption -0.04 0.02 0.04
treatment ecology -0.04 0.02 0.02
Note: OLS regression with binary attrition indicator as dependent variable. ‘est’, ‘se’ and ‘pval’ report the coefficients, heteroscedasticity robust standard errors and p-values, respectively.
14
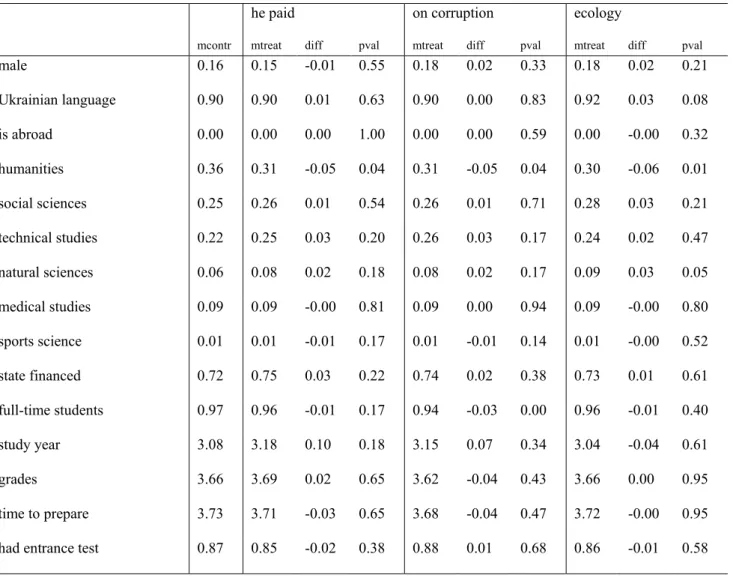
Table 5 therefore presents balance tests that compare the means of observed covariates across different treatments in the absence of attrition. It thus allows the investigation of selectivity with regard to observed covariates by checking whether the treatments are (still) balanced when considering only cases with non-missing values in the outcomes and covariates. If this is the case and the covariates either include or behave (in terms of attrition) like the background characteristics affecting the outcome, then the effects of the treatments are consistently estimated for sample without attrition – i.e. they are internally valid (see the discussion in Huber, 2012). We use two sample t-tests for pairwise comparisons of the covariate means of each treatment with the control group and find that only few variables are statistically significantly different at the 5% level: Studying humanities is significant for all treatments, studying natural science is significant for the third video (ecology), while studying as full-time students, studying for a good education, and cheating during exams are significant for the second video (about corruption). Given the large amount of covariate-treatment combinations tested, the few statistically significant differences do not point to important covariate imbalances after attrition.
Table 5: Covariate balance across treatments
he paid on corruption ecology
mcontr mtreat diff pval mtreat diff pval mtreat diff pval
male 0.16 0.15 -0.01 0.55 0.18 0.02 0.33 0.18 0.02 0.21 Ukrainian language 0.90 0.90 0.01 0.63 0.90 0.00 0.83 0.92 0.03 0.08 is abroad 0.00 0.00 0.00 1.00 0.00 0.00 0.59 0.00 -0.00 0.32 humanities 0.36 0.31 -0.05 0.04 0.31 -0.05 0.04 0.30 -0.06 0.01 social sciences 0.25 0.26 0.01 0.54 0.26 0.01 0.71 0.28 0.03 0.21 technical studies 0.22 0.25 0.03 0.20 0.26 0.03 0.17 0.24 0.02 0.47 natural sciences 0.06 0.08 0.02 0.18 0.08 0.02 0.17 0.09 0.03 0.05 medical studies 0.09 0.09 -0.00 0.81 0.09 0.00 0.94 0.09 -0.00 0.80 sports science 0.01 0.01 -0.01 0.17 0.01 -0.01 0.14 0.01 -0.00 0.52 state financed 0.72 0.75 0.03 0.22 0.74 0.02 0.38 0.73 0.01 0.61 full-time students 0.97 0.96 -0.01 0.17 0.94 -0.03 0.00 0.96 -0.01 0.40 study year 3.08 3.18 0.10 0.18 3.15 0.07 0.34 3.04 -0.04 0.61 grades 3.66 3.69 0.02 0.65 3.62 -0.04 0.43 3.66 0.00 0.95 time to prepare 3.73 3.71 -0.03 0.65 3.68 -0.04 0.47 3.72 -0.00 0.95 had entrance test 0.87 0.85 -0.02 0.38 0.88 0.01 0.68 0.86 -0.01 0.58
15
studying for good education 0.34 0.31 -0.03 0.17 0.29 -0.05 0.03 0.32 -0.02 0.47 studying for diploma 0.10 0.10 0.01 0.70 0.09 -0.01 0.65 0.10 0.00 0.96 studying because of parents 0.02 0.02 -0.00 0.74 0.02 0.00 0.98 0.02 -0.00 0.58 studying because all do 0.01 0.02 0.00 0.67 0.01 -0.00 0.75 0.02 0.00 0.81 bribes: personal experience 0.06 0.06 0.00 0.72 0.07 0.02 0.23 0.05 -0.00 0.73 bribes: friends 0.14 0.15 0.01 0.43 0.15 0.01 0.47 0.16 0.02 0.32 bribes: no experience 0.67 0.65 -0.02 0.42 0.67 -0.00 0.93 0.66 -0.01 0.65 presents to teacher 2.40 2.34 -0.06 0.33 2.37 -0.03 0.63 2.38 -0.01 0.83 violations in uni: pers. 0.07 0.08 0.01 0.35 0.09 0.02 0.08 0.08 0.02 0.18 viol. in uni: friends 0.23 0.25 0.02 0.46 0.20 -0.03 0.21 0.21 -0.02 0.42 viol. in uni: no one 0.71 0.68 -0.03 0.22 0.71 0.00 0.91 0.70 -0.00 0.97 heard: bribes in uni 3.43 3.46 0.03 0.63 3.46 0.03 0.68 3.38 -0.05 0.39 heard: pulling strings 2.90 2.89 -0.01 0.86 2.88 -0.03 0.65 2.84 -0.06 0.28 uses cheat sheets 2.66 2.65 -0.01 0.89 2.69 0.04 0.52 2.58 -0.07 0.21 downloads papers etc. 1.80 1.78 -0.02 0.68 1.78 -0.02 0.66 1.75 -0.06 0.27 buys papers etc. 1.31 1.30 -0.01 0.75 1.26 -0.05 0.18 1.32 0.01 0.78 copies parts 2.83 2.88 0.05 0.40 2.94 0.11 0.07 2.83 -0.00 0.99 cheats during exams 2.63 2.70 0.07 0.23 2.75 0.13 0.03 2.63 -0.00 0.97 lies to teacher 1.77 1.74 -0.03 0.52 1.79 0.01 0.82 1.81 0.03 0.49 asks for special treatment 1.30 1.35 0.05 0.20 1.29 -0.02 0.58 1.32 0.01 0.82 encountered bribery at uni 1.83 1.83 -0.01 0.93 1.92 0.08 0.18 1.83 -0.01 0.93 Note: ‘mcontr’: mean of control group (education treatment); ‘mtreat’: mean of respective treatment; ‘diff’: mean difference; ‘pval’: p-value of mean difference based on a two sampe t-test allowing for heteroscedasticity. Regional dummies are omitted.
Our findings about nonselective attrition are also corroborated when using a machine learning-based test to investigate the joint balance of all covariates together, separately for each treatment-control comparison. To this end, we apply an approach suggested by Ludwig, Mullainathan, and Spiess (2017). It is based on the intuition that the problem of obtaining too many significant differences when testing multiple hypotheses (e.g. differences in multiple covariates across treatments), or false positives, is similar to the concern of overfitting in machine learning, or including too many regressors when predicting a variable. In our case, the question is whether the treatment can be predicted by the covariates, which would point to imbalances.
16
We thus follow Ludwig et al (2017), who propose applying the machine learning logic to the context of multiple testing, and split our data into training and testing data. In the training data, we run a lasso logit regression of the respective treatment (vs. control) on the covariates using the ‘rlogit’ command with its default values in the ‘hdm’ package by Chernozhukov, Hansen, and Spindler (2015) for the statistical software ‘R’. We then use the obtained coefficients for predicting the treatment in the test data and compare the prediction to the actual treatment to compute the mean squared error. We use 5-fold cross-validation, such that the roles of training and test data are swapped, and take the average of the 5 mean squared errors obtained (in order to reduce its variance). In a next step, we randomly relabel (or permute) the treatment variables and re-estimate the MSE using the same procedure; see Ludwig et al (2017). Repeating the permutation 999 times, we compute the p-value for the joint significance of the covariates as the share of permutation based MSEs that are lower than the MSE with the correct coding of the treatment. The permutation test’s intuition is that if the covariates are balanced across treatments, relabelling the latter will not seriously affect (i.e. increase) the MSE. If, on the other hand, covariates are predictive for the treatment, then the correct coding of the treatment should entail a smaller MSE than the permuted versions.
The first line in Table 6 provides the results of the machine learning-based test for assessing the joint balance of all covariates separately for each treatment-control comparison. For the first and third video, the null hypothesis is not rejected at any conventional level of significance (with p-values of 53 and 37%, respectively), while for the second video, the differences in covariates are marginally significant at the 10%, but not at the 5% level. Finally, a joint test over all treatments, which is obtained by arranging the four treatments into two groups (first and second video vs. third video and control group), yields again a p-value far beyond any conventional level of significance. Our overall conclusion thus is that despite substantial outcome attrition, covariates are decently balanced across treatment states such that causal inference is likely internally valid for the observations among which the treatments were randomized.
Table 6: P-values of machine learning-based tests
paid corruption ecology paid/corruption vs. ecology/education(control)
covariates 0.53 0.37 0.10 0.97
outcomes 0.00 0.52 0.92 0.00
Note: ‘covariates’: provides the p-values of machine learning-based tests (following Ludwig et al, 2017) of joint covariate associations with the respective treatment; ‘outcomes’: provides the p-values of machine learning-based tests of joint outcome associations with the respective treatment.
17
We subsequently analyse the effects of the various treatments on the outcomes of interest. Due to the large amount of outcome variables considered, we are confronted with similar multiple hypothesis testing issues as previously discussed for checking covariate balance. To jointly test whether some treatment (compared to the control group) has an effect on any of the outcomes considered, we again apply the machine learning-based test of Ludwig et al (2017) outlined above. However, the causal order of the treatment and outcomes is reversed in the lasso regression: it is the treatment that is regressed on all outcome variables, rather than the other way around. The intuition is that if the treatment affects some of the outcomes considered, then some of the lasso coefficients are non-negligibly different from zero and the MSE with the original labelling of the treatment is again likely lower than under permuted treatment labels. The second line of Table 6 presents the testing results for pairwise comparisons of each treatment with the control group. We find that the first video (‘He paid’) statistically significantly affects the outcome variables with a p-value that is essentially zero. In contrast, the p-values for the second and third video are beyond any conventional level of significance such that the null that these videos do not affect the outcomes cannot be rejected. Finally, when running a joint test for all treatments by grouping them into two categories (first and second video vs. third video and control group), we obtain again a p-value close to zero. This indicates that the treatments jointly affect the joint distribution of the outcomes, but this effect appears to be entirely driven by the first video.
Table 7 provides the experimental treatment effect estimates separately for each of the outcomes based on two sample t-tests of mean differences between the respective treatment and control groups. We find that the first video (‘He paid’) statistically significantly modifies several attitudes towards corruption: the treated more often believe that corruption is a ‘crime’ and ‘evil’ (significant at the 5% and 1% levels, respectively), has a negative impact on one’s health, security, the health care system (all significant at the 1% level), and the economy of Ukraine (significant at the 10% level). Furthermore, those exposed to the first video report less often that corruption is a ‘means to earn money’ (significant at the 1% level) and believe more often that corruption is a ‘compensation for low salaries’ (significant at the 10% level). Hence, this video has the largest impact among any intervention and induces a more negative view of corruption overall.
The second video (‘About corruption’) shows some individual effects especially on attitudes towards corruption, although we acknowledge that they could be spurious due to multiple testing (as the joint test on all outcomes presented above was not statistically significant). Individuals exposed to the video more often reported that corruption is ‘a necessity’ and ‘a way of solving problems’ (significant at the 1% level), ‘a compensation for low salaries’ (significant at the 5% level), ‘a part of life’ and ‘a temporary phenomenon’ (significant at the 10% level) and also that it has a generally positive influence on education in Ukrainian (significant at the 10% level). The
18
treatment also decreases the view that corruption is a ‘national peculiarity’ (significant at the 5% level). Taken at face value, the results for the second video bear similarities with those obtained in Denisova-Schmidt et al. (2015, 2016) and Corbacho et al. (2016), where an exposure to information on the spread of corruption had a promoting effect (i.e. ‘corruption corrupts’).
For the third video, ‘Essays on Ecology’, we find only a handful of significant effects, namely negative impacts on the view that corruption is ‘a crime’ and ‘evil’ (significant at the 5% level) and positive impacts on the judgement that corruption is ‘a necessity’ (significant at the 10% level) and on the health conditions of respondents. However, these comparably few effects are likely spurious and due to the large number of hypotheses tested, which is supported by the fact that the joint significance test presented in Table 6 yields a p-value close to one.
Table 7: Treatment effects (mean differences)
he paid on corruption ecology
mcontr est se pval est se pval est se pval
corruption is a necessity 1.49 -0.03 0.04 0.51 0.14 0.04 0.00 0.07 0.04 0.07 ...is a means to earn money 2.59 -0.21 0.07 0.00 0.04 0.07 0.56 0.11 0.07 0.13 ...is a crime 4.50 0.09 0.04 0.03 -0.04 0.04 0.33 -0.09 0.04 0.03 ...is a part of life 2.04 0.05 0.06 0.40 0.11 0.06 0.06 0.04 0.06 0.49 ...way of solving problems 2.72 -0.05 0.06 0.43 0.16 0.06 0.01 0.09 0.06 0.15 ...compensation for low
salaries 2.75 0.12 0.07 0.07 0.15 0.07 0.02 0.03 0.07 0.63 ...temporary phenomenon 2.26 -0.03 0.05 0.63 0.09 0.05 0.08 0.03 0.05 0.53 ...tradition 2.99 -0.02 0.07 0.75 -0.05 0.07 0.45 0.01 0.07 0.94 ...national peculiarity 2.65 0.01 0.07 0.86 -0.13 0.07 0.05 -0.03 0.07 0.61 ... evil 4.43 0.16 0.04 0.00 -0.00 0.04 0.94 -0.11 0.05 0.02 ...influences my career 1.82 0.05 0.04 0.20 0.03 0.04 0.39 0.06 0.04 0.12 ...my quality of life 1.77 0.01 0.04 0.83 0.03 0.04 0.43 0.05 0.04 0.21 ...my education 1.61 -0.03 0.04 0.41 0.02 0.04 0.56 0.05 0.04 0.17 ...my health 1.92 -0.15 0.04 0.00 0.02 0.04 0.68 0.10 0.04 0.01 ...my security 1.78 -0.13 0.04 0.00 -0.04 0.04 0.32 0.02 0.04 0.54 ...influences Ukrainian economy 1.28 -0.04 0.03 0.08 -0.01 0.03 0.73 0.01 0.03 0.57 ...Ukrainian politics 1.18 -0.01 0.02 0.67 0.02 0.02 0.40 0.04 0.02 0.11 ...Ukrainian education 1.17 0.01 0.02 0.56 0.04 0.02 0.09 0.02 0.02 0.46 health care system in Ukraine 1.24 -0.08 0.03 0.00 0.02 0.03 0.43 -0.01 0.03 0.61
19 ...Ukrainian law-enforcement
system 1.13 -0.00 0.02 1.00 0.01 0.02 0.59 0.03 0.02 0.23
Note: ‘mcontr’: mean of control group (education treatment); ‘est’: estimated effect (mean difference); ‘se’: heteroscedasticity robust standard error; ‘pval’: p-value of the effect.
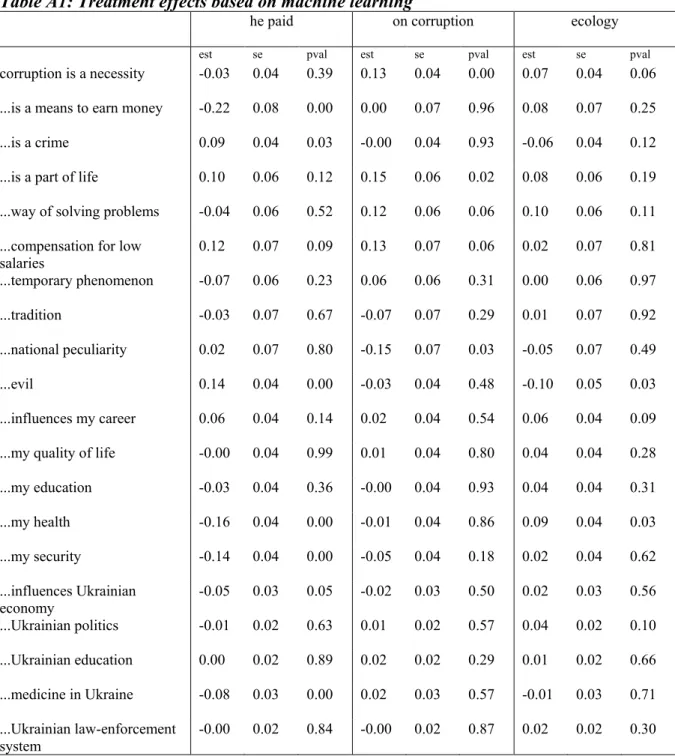
As a robustness check, Table A1 of the appendix presents the effect estimates when controlling for differences in covariates across treatment and control groups in a data driven way. To this end, we apply the machine learning approach implemented in the ‘lassoATE’ command (with default values) in the ‘hdm’ package by Chernozhukov, Hansen and Spindler (2015) for the statistical software ‘R’. This procedure selects all the covariates either importantly affecting the treatment or the respective dependent variable by (double) lasso regression and uses them as control variables when estimating average treatment effects. Due to the a priori decent covariate balance in our evaluation sample (see Tables 5 and 6), the results obtained by this approach are almost identical to the mean differences presented in Table 7.
Finally, we investigate whether effects are heterogeneous across specific background characteristics for two negatively loaded outcomes, namely ‘corruption is a crime’ and ‘corruption is evil’. The background characteristics of interest include gender, study program, program state financed, study year, grades, time to prepare, entrance test and reasons for studying, as well as questions concerning experience with bribery and cheating asked prior to treatment assignment. We again use a machine learning approach to analyse effect heterogeneity: We split our evaluation data into a training sample corresponding to 75% of the observations and a test sample (25%). In the training data, we train a random forest for evaluating conditional (rather than average) treatment effects given the observed background characteristics using the ‘causal_forest’ command (with default values) of the ‘grf’ package by Tibshirani, Athey, Wager, Friedberg, Miner and Wright (2018). For each observation in the test data, we predict the conditional treatment effects and use the latter as outcomes in a lasso regression on the background characteristics based on the ‘rlasso’ command in the ‘hdm’ package. This allows finding the best predictors of the conditional treatment effects and thus the drivers of effect heterogeneity (if any) across individuals. Table 8 reports the (so-called post-lasso) OLS coefficients when regressing the conditional treatment effects on the lasso-selected background characteristics in the test data, separately for each video-control comparison. We note that only coefficients with an absolute value larger than or equal to 0.01 (or 1% point) are reported. According to this analysis, we find that, in general, personal cheating and bribing behaviour, the field of studies and the study year are the relatively most important predictors of heterogeneity for the various treatments. However, in absolute terms, the magnitude of effect heterogeneity is often limited.
20
Table 8: Effect heterogeneity analysis
he paid on corruption ecology
outcome ‘corruption is crime’
lies to teacher 0.01 technical studies 0.02 humanities 0.02 copies parts 0.01 uses cheat sheets -0.01 copies parts 0.01
downloads
papers etc. -0.01 uses cheat sheets 0.01 buys papers etc. -0.01 outcome ‘corruption is evil’
bribes: personal
experience 0.03 violations in uni: pers. 0.02 bribes: personal experience 0.08 copies parts 0.02 study year 0.02 technical studies 0.04 study year 0.01 medical studies 0.02 copies parts 0.02 uses cheat sheets -0.01 lies to teacher -0.01
heard: pulling
strings -0.01 study year 0.01
Note: Post-lasso coefficients when regressing random forest-based predictions of treatment effects on covariates. Only (rounded) coefficients that are in absolute terms larger than or equal to 0.01 are included.
Conclusion
This paper considers academic dishonesty and corruption based on an online survey among Ukrainian students. We conducted an online experiment examining the effects of educational anti-corruption interventions by randomizing three different videos on anti-corruption and its consequences (treatment groups) as well as one video on higher education, but not related to corruption (control group) among survey participants. Our data point to substantial academic dishonesty among students in Ukraine: about 90% of respondents were involved, to differing extents, in various types of cheating, plagiarism and other forms of academic misconduct. At same time, a majority judged corruption to negatively affect the economy, politics, education, health and the police in Ukraine. Furthermore, many perceived corruption to be an impediment for their own career opportunities, quality of life, education, health and safety. For many respondents, corruption seems to be an ambivalent phenomenon: most students considered corruption to be a ‘crime’ and ‘evil’, but also ‘a tradition’, ‘a way of solving problems’ and ‘a compensation for low salaries’.
Concerning our experimental interventions, we found that one out of the three videos on corruption promoted a more negative attitude towards corruption when compared to the control group. The video showed (a.) how a student who obtained a medical degree through bribes and other fraudulent means became an unqualified physician whose mistake entailed the disability of a newborn child and (b.) how a person paying a bribe to a police officer might thus indirectly contribute to a system
21
that endangers the health of one’s own children. Respondents exposed to this video more often judged corruption to be a crime and evil and to have a negative impact on one’s health, security, the health care system and the economy of Ukraine. The other two videos conveyed a less emotional message but reported information on corruption in a way that resembles TV news reporting or documentaries. Specifically, the second video presented statistics on and information about countermeasures against corruption, while the third one discussed the legitimacy of academic cheating under certain circumstances. If anything, these two videos (and in particular the second one) appeared to promote (rather than reduce) understanding about the existence of corruption, although the comparably few statistically significant effects might be spurious due to multiple hypothesis testing. Our results thus suggest that presenting corruption issues in a catchy way, e.g. by means of a thrilling story that includes commonly known issues like bribing police officers, can be more effective for creating awareness about its negative consequences among students than a rational discussion of facts and figures.
22 Appendix
Table A1: Treatment effects based on machine learning
he paid on corruption ecology
est se pval est se pval est se pval
corruption is a necessity -0.03 0.04 0.39 0.13 0.04 0.00 0.07 0.04 0.06 ...is a means to earn money -0.22 0.08 0.00 0.00 0.07 0.96 0.08 0.07 0.25 ...is a crime 0.09 0.04 0.03 -0.00 0.04 0.93 -0.06 0.04 0.12 ...is a part of life 0.10 0.06 0.12 0.15 0.06 0.02 0.08 0.06 0.19 ...way of solving problems -0.04 0.06 0.52 0.12 0.06 0.06 0.10 0.06 0.11 ...compensation for low
salaries 0.12 0.07 0.09 0.13 0.07 0.06 0.02 0.07 0.81 ...temporary phenomenon -0.07 0.06 0.23 0.06 0.06 0.31 0.00 0.06 0.97 ...tradition -0.03 0.07 0.67 -0.07 0.07 0.29 0.01 0.07 0.92 ...national peculiarity 0.02 0.07 0.80 -0.15 0.07 0.03 -0.05 0.07 0.49 ...evil 0.14 0.04 0.00 -0.03 0.04 0.48 -0.10 0.05 0.03 ...influences my career 0.06 0.04 0.14 0.02 0.04 0.54 0.06 0.04 0.09 ...my quality of life -0.00 0.04 0.99 0.01 0.04 0.80 0.04 0.04 0.28 ...my education -0.03 0.04 0.36 -0.00 0.04 0.93 0.04 0.04 0.31 ...my health -0.16 0.04 0.00 -0.01 0.04 0.86 0.09 0.04 0.03 ...my security -0.14 0.04 0.00 -0.05 0.04 0.18 0.02 0.04 0.62 ...influences Ukrainian economy -0.05 0.03 0.05 -0.02 0.03 0.50 0.02 0.03 0.56 ...Ukrainian politics -0.01 0.02 0.63 0.01 0.02 0.57 0.04 0.02 0.10 ...Ukrainian education 0.00 0.02 0.89 0.02 0.02 0.29 0.01 0.02 0.66 ...medicine in Ukraine -0.08 0.03 0.00 0.02 0.03 0.57 -0.01 0.03 0.71 ...Ukrainian law-enforcement system -0.00 0.02 0.84 -0.00 0.02 0.87 0.02 0.02 0.30
Note: Estimates are based on the ‘lassoATE’ command of the ‘hdm’ package by Chernozhukov, Hansen and Spindler (2015) for the statistical software ‘R’. ‘mcontr’: mean of control group (education treatment); ‘est’: estimated effect (mean difference); ‘se’: heteroscedasticity robust standard error; ‘pval’: p-value of the effect.
23 References
Armantier, O. and Boly, A. (2011). A controlled field experiment on corruption. European Economic Review, 55(8), 1072–1082.
Armantier, O. and Boly, A. (2013). Comparing corruption in the laboratory and in the field in Burkina Faso and in Canada. The Economic Journal, 123(573), 1168–1187.
Barr, A. and Serra, D. (2010). Corruption and culture: An experimental analysis. Journal of Public Economics, 94(11-12), 862–869.
Bretag, T. (ed.) (2016). Handbook of Academic Integrity. Springer.
Chapman, D.W. and Linder, S. (2016). Degrees of integrity: the threat of corruption in higher education. Studies in Higher Education, 41(2), 247–268.
Chernozhukov, V., Hansen, C., and Spindler, M. (2015). hdm: High-dimensional metrics. Package for the statistical software R.
Cohn, A., Fehr, E. and Maréchal, M. (2014). Business culture and dishonesty in the banking industry. Nature, 516, 86–89.
Corbacho, A., Gingerich, D.W., Oliveros, V. and Ruiz-Vega, M. (2016). Corruption as a self-fulfilling prophecy: Evidence from a survey experiment in Costa Rica. American Journal of Political Science. 60(4), 1077–1092.
Cole, M. (2014). Best practices for running an educational campaign. Modern Healthcare, 44(39), S012.
Denisova-Schmidt, E. (2017). The challenges of academic integrity in higher education: current trends and outlook. CIHE Perspectives (Vol. 5). Boston: Boston College.
Denisova-Schmidt, E. (2018). Corruption in higher education. In Teixeira, P., Nuno and Shin, Jung-Cheol (eds). Encyclopedia of International Higher Education Systems and Institutions. Springer.
Denisova-Schmidt, E., Huber, M. and Prytula, Y. (2015). An experimental evaluation of an anti-corruption intervention among Ukrainian university students. Eurasian Geography and Economics, 56(6), 713–734.
Denisova-Schmidt E., Huber M. and Leontyeva E. (2016a). Do anti-corruption educational campaigns reach students? Some evidence from two cities in Russia and Ukraine, Voprosy obrazovaniya / Educational Studies Moscow, 1, 61–83.
Denisova-Schmidt, E., Huber, M. and Leontyeva, E. (2016b). On the development of students’ attitudes towards corruption and cheating in Russian universities, European Journal of Higher Education, 6(2), 128–143.
24
Denisova-Schmidt E. and Prytula, Y. (2017). Ukraine: endemic higher education corruption. International Higher Education, 90, 16–18.
Denisova-Schmidt E., Huber, M., Leontyeva, E. and Solovyeva, A. (2017). Combining experimental evidence with machine learning to assess anti-corruption educational campaigns among Russian university students, SES Working Paper Nr 487, University of Fribourg. Denisova-Schmidt E. and Prytula, Y. (2018). Corruption in doing business in Ukraine: a way to get
things done? Business Horizons, 61(6), 867–879.
Denisova-Schmidt E., Prytula, Y. and Rumyantseva, N. (2018). Beg, borrow, or steal: determinants of student academic misconduct in Ukrainian higher education. Policy Review in Higher Education, in press.
Findley, M., Nielson, D., and Sharman, J. (2014). Global shell games. Cambridge University Press, Cambridge.
Heckman (1979). Sample selection bias as a specification error. Econometrica, 47, 153−161. Holmes, L. (2015). Corruption: a very short introduction. Oxford University Press, Oxford.
Hornik, R., Jacobsohn, L., Orwin, R., Piesse, A. and Kalton, G. (2008). Effects of the national youth anti-drug media campaign on youths. American Journal of Public Health 98, 2229– 2236.
Huber, M. (2012). Identification of average treatment effects in social experiments under alternative forms of attrition. Journal of Educational and Behavioral Statistics, 37(3), 443–474.
John, L. K., Loewenstein, G., and Rick, S. I. (2014). Cheating more for less: Upward social comparisons motivate the poorly compensated to cheat. Organizational Behavior and Human Decision Processes, 123(2), 101–109.
Kogut, I. (2014). How men and women differ: on gender (in)equality in higher education. CEDOS https://cedos.org.ua/uk/articles/chym-vidrizniaiutsia-zhinky-i-choloviky-pro-hendernu-ne-rivnist-u-vyshchii-osviti Accessed 19 December 2018
Ludwig, J., Mullainathan, S. and Spiess, J. (2017). Machine learning tests for effects on multiple outcomes. Unpublished paper. https://scholar.harvard.edu/spiess/publications/machine-learning-tests-effects-multiple-outcomes Accessed 8 January 2019
Marinov, N. and Schimmelfennig, F. (2015). Does social media promote civic activism? Evidence from a field experiment. Center for Comparative and International Studies, ETH Zürich.
http://www.cis.ethz.ch/content/dam/ethz/special-interest/gess/cis/cis-dam/News_Events/Events_2015/CIS_Colloquium_2015/SS_2015/Papers/Niki%20Marinov_ Social%20Media.pdf Accessed 19 December 2018
25
McGuigan, M., McNally, S., and Wyness, G. (2016). Student awareness of costs and benefits of educational decisions: effects of an information campaign. Journal Of Human Capital, 10(4), 482–519.
Moore, D. L., and Tarnai, J. (2002). Evaluating nonresponse error in mail surveys. In: Groves, R. M., Dillman, D. A., Eltinge, J. L., and Little, R. J. A. (eds.), Survey Nonresponse, John Wiley & Sons, New York, 197–211.
Schwappach, D. L., Frank, O., Buschmann, U. and Babst, R. (2013). Effects of an educational patient safety campaign on patients' safety behaviours and adverse events. Journal of Evaluation in Clinical Practice, 19: 285–291.
Serra, D. and Wantchekon, L. (2012). New advances in experimental research on corruption. Emerald, Bingley, U.K.
Shaw, Ph., Katsaiti, M-S., and Pecoraro, B. (2015). On the determinants of educational corruption: the case of Ukraine. Contemporary Economic Policy, 33(4), 698–713.
Singer, E., van Hoewyk, J. and Maher, M. P. (2000). Experiments with incentives in telephone surveys. Public Opinion Quarterly 64, 171–188.
Smith, W. (2008). Does Gender Influence Online Survey Participation?: A Record-linkage Analysis of University Faculty Online Survey Response Behavior. https://files.eric.ed.gov/fulltext/ED501717.pdf Accessed 19 December 2018
Tibshirani, J., Athey, S., Wager, S., Friedberg, R., Miner, L. and Wright, M. (2018). Grf: Generalized Random Forests. Package for the statistical software R.
Wright, P. J., Randall, A. K., and Arroyo, A. (2012). Father-daughter communication about sex moderates the association between exposure to MTV’s 16 and Pregnant/Teen Mom and female students’ pregnancy-risk behavior. Sexuality & Culture. 17(1), 50–66.
Authors
Elena DENISOVA-SCHMIDT
University of St. Gallen (HSG), Gatterstr. 3, 9010 St. Gallen, Switzerland. Phone: +41 71 224 2581; Email: [email protected]; Website: elena-denisova-schmidt.de
Martin HUBER
University of Fribourg, Department of Economics, Bd. de Pérolles 90, 1700 Fribourg, Switzerland. Phone: +41 26 300 8274; Email: [email protected]; Website: http://www3.unifr.ch/appecon/de/lehrstuhl/team/prof
Yaroslav PRYTULA
Ukrainian Catholic University, Faculty of Applied Sciences, vul. Kozelnytska 2a, 79011 Lviv, Ukraine. Phone: +38 032 240 3604; Email: [email protected]; Website: http://lnu.academia.edu/YaroslavPrytula
Bd de Pérolles 90, CH-1700 Fribourg Tél.: +41 (0) 26 300 82 00
[email protected] www.unifr.ch/ses Université de Fribourg, Suisse, Faculté des sciences économiques et sociales
Universität Freiburg, Schweiz, Wirtschafts- und sozialwissenschaftliche Fakultät University of Fribourg, Switzerland, Faculty of Economics and Social Sciences
Working Papers SES collection
Abstract
This paper presents the outcomes of an anti-corruption educational intervention among Ukrainian students based on an online experiment. More than 3,000 survey participants were randomly assigned to one of three different videos on corruption and its consequences (treatment groups) or a video on higher education (control group). The data suggest a high level of academic dishonesty and misconduct among young people, but also a negative attitude towards corruption in general, highlighting the ambivalence of corruption in the country. We find that one video, which presented a thrilling story about a victim of corruption related to common bribery in an accessible way, was effective in promoting awareness of the negative consequences of corruption. In contrast, the other two treatment videos, which more closely followed the style of TV news or documentaries on corruption, did not generally promote negative attitudes towards corruption. Presenting corruption issues in a catchy way therefore appears to matter for the effectiveness of such interventions.
Citation proposal
Elena Denisova-Schmidt, Martin Huber, Yaroslav Prytula. 2019. «The effects of anti-corruption videos on attitudes towards corruption in a Ukrainian online survey». Working Papers SES 499, Faculty of Economics and Social Sciences, University of Fribourg (Switzerland)
Jel Classification
D73, C93.
Keywords
Anti-Corruption Campaigns, Experiments, Corruption, Academic Integrity, University, Students, Ukraine.
Last published
492 Andresen M.E., Huber M.: Instrument-based estimation with binarized treatments: Issues and tests for the exclusion restriction; 2018
493 Bodory H., Huber M.: The causalweight package for causal inference in R; 2018
494 Huber M., Imhof D.: Machine Learning with Screens for Detecting Bid-Rigging Cartels; 2018
495 Hsu Y.-C., Huber M., Lee Y.-Y.: Direct and indirect effects of continuous treatments based on generalized propensity score weighting; 2018
496 Huber M., Solovyeva A.: Direct and indirect effects under sample selection and outcome attrition; 2018 497 Huber M., Solovyeva A.: On the sensitivity of wage gap decompositions; 2018
498 Isakov D., Pérignon C., Weisskopf J.-P.: What if dividends were tax-exempt? Evidence from a natural experiment; 2018
Catalogue and download links
http://www.unifr.ch/ses/wp
http://doc.rero.ch/collection/WORKING_PAPERS_SES
Publisher