Nanna Bjerregaard Pedersen*, Notburga Gierlinger and Lisbeth Garbrecht Thygesen
Bacterial and abiotic decay in waterlogged
archaeological Picea abies (L.) Karst studied
by confocal Raman imaging and ATR-FTIR
spectroscopy
Abstract: Waterlogged archaeological Norway spruce
[Picea abies (L.) Karst] poles were studied by means of
con-focal Raman imaging (CRI) and attenuated total reflection
Fourier transform infrared spectroscopy (ATR-FTIR)
anal-ysis to determine lignin and polysaccharide composition
and distribution in the cell wall. The waterlogged
archaeo-logical wood (WAW) was submerged under anoxic
condi-tions for approximately 400 years and solely decayed by
erosion bacteria (EB). CRI showed that decayed tracheids
contain a residual material (RM) with heterogeneous lignin
distribution; within the same tracheid RM often contained
regions with intensities lower than sound S2 layers up to
intensity values as high as the compound middle lamella
(CML). CRI revealed strong depletion of carbohydrates in
RM which indicated that EB are able to utilise the
carbo-hydrate fraction of the cell wall effectively. Raman bands
assigned to lignin did not show any difference between
RM and sound S2. This is a hint that EB do not modify the
lignin structure. Sound WAW free from EB decay showed
evidence of loss of acetyl groups in glucomannan, loss of
un-conjugated ester linkages in the lignin-carbohydrate
complexes between xylan and lignin, and minor
oxida-tion of the lignin polymer compared to recent reference
material. This is evidence for abiotic decay in the course
of waterlogging.
Keywords: abiotic decay, anaerobic decay, ATR-FTIR,
car-bohydrates, confocal Raman imaging, erosion bacteria,
lignin, Norway spruce, Picea abies, waterlogged
archaeo-logical wood
DOI 10.1515/hf-2014-0024
Received January 28, 2014; accepted April 10, 2014; previously published online May 28, 2014
Introduction
Wood is preserved for centuries or even millennia in
anoxic waterlogged soils and sediments in absence of
fast lignocellulose degrading microorganisms. However,
microbial degradation is facilitated by erosion bacteria
(EB) (Björdal et al. 1999; Kim and Singh 2000; Klaassen
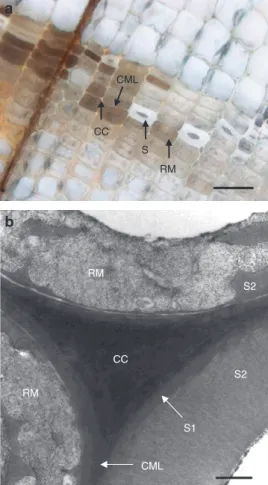
2008). Typical EB decay is observed as a random mixture
of sound and decayed tracheids in cross section (CS).
Lignin rich cell corners (CC) and compound middle lamella
(CML) are intact whereas decayed tracheids contain partly
preserved S1 and S3 layers and a residual material (RM)
from the decayed S2 layer (Figure 1) (Holt and Jones 1983;
Singh et al. 1990; Singh and Butcher 1991; Kim et al. 1996;
Björdal et al. 2000).
Anaerobic microbiological degradation of
lignocel-lulosic materials is not fully understood. There is a lack
of species description of the microorganism
communi-ties acting on the material, the enzymatic pathways are
not completely surveyed, and the chemical composition
of the residual wood structure is not fully elucidated
(van der Lelie et al. 2012). Waterlogged archaeological
wood (WAW) is well suited for studying the slow
anaer-obic microbiological degradation. Studies of chemical
changes in this context show mainly lignin conservation
and carbohydrate depletion independently of decay type,
wood species, and submerging environment (Pedersen
et al. 2013). However, degradation of WAW is a complex
process. The characteristics of the residual wood
struc-ture depend on the composition and conformation of the
biopolymers and the 3D architectural organisation.
Spa-tially resolved chemical information at the molecular level
is needed to gain in-depth insights into the decay
mecha-nisms and residual cell wall structure. Chemical imaging
*Corresponding author: Nanna Bjerregaard Pedersen, Universityof Copenhagen, Faculty of Science, Rolighedsvej 23, 1958 Frederiksberg C, Denmark, e-mail: [email protected]
Notburga Gierlinger: ETH Zurich, Institute of Building Materials, Stefano-Franscini-Platz 3, 8093 Zurich, Switzerland
Lisbeth Garbrecht Thygesen: University of Copenhagen, Faculty of Science, Rolighedsvej 23, 1958 Frederiksberg C, Denmark
methods are well suited for studying individual wood cell
wall layers in situ (Fackler and Thygesen 2013).
WAW has already been studied by high resolution
UV-microspectrophotometry (UMSP) (Cufar et al. 2008;
Rehbein et al. 2013; Pedersen et al. 2014). UMSP permits
determination of the lignin content and distribution in
the cell wall with a spatial resolution of 0.25 μm × 0.25 μm
(Koch and Kleist 2001). The previous studies involved Pinus
sylvestris (50–80 years), Picea abies (400 years), Quercus
sp. (∼4500 years), and Fraxinus sp. (∼5200 years). All
samples showed signs of EB decay (Nilsson and Klaassen
2008). The RMs of these woods contained lignin or
lignin-like compounds, but the UV-absorbance images showed
a great variety of lignin content in the RM. This was
inter-preted as lignin aggregation following EB decay (Pedersen
et al. 2014). UMSP line scans of RM were similar to those
of sound S2. This indicated that the chemical structure of
the aromatic ring system in lignin did not change during
EB decay; depolymerisation of lignin could however not be
ruled out.
Confocal Raman imaging (CRI) is another imaging
technique suitable for studying plant materials in situ.
The method makes it possible to study changes in
chem-istry and microfibril orientation in cell wall layers with
a spatial resolution higher than 0.5 μm (Agarwal 2006;
Gierlinger and Schwanninger 2007; Richter et al. 2011;
Gierlinger et al. 2012). Highly polar bonds such as in
water have weak Raman intensities, and do not
inter-fere with the Raman spectrum of wood (Wiley and Atalla
1987; Gierlinger and Schwanninger 2007). The method is
therefore highly relevant for WAW which can be sampled
without any dehydration of the material. On the other
hand, the interpretation of Raman images and
underly-ing Raman spectra is not straight forward because of the
overlapping bands of cellulose, hemicelluloses, lignin,
and pectin (Gierlinger et al. 2012). Hemicelluloses and
cellulose have similar types of chemical bonds, while
the former have broader bands and lower signal
inten-sities than the latter. Thus the contribution of
hemicel-luloses is hidden. But characteristic bands of lignin do
not overlap with those of polysaccharides (Agarwal and
Ralph 1997). Therefore, the contribution of these two
essential cell wall polymers can be well distinguished
by CRI in situ.
The present work apply CRI to study the decay pattern
of lignocelluloses in WAW poles (Norway spruce) solely
decayed by EB under anoxic conditions. The aim is to get
detailed spatially resolved information on the distribution
and molecular structure of both lignin and carbohydrates
in WAW. Attenuated total reflection Fourier transform
infrared spectroscopy (ATR-FTIR) will also be applied for
comparison and complementary information.
Material and methods
The used sample material was wood discs from the bottom part of three 400-year-old Norway spruce [Picea abies (L.) Karst] poles; recent Norway spruce served as reference. The waterlogged poles had most likely been standing in anoxic sediment or soil from con-struction until excavation in 2011. The discs were stored in tap water in individual plastic buckets, purged with nitrogen gas and sealed with an airtight lid until sample preparation and analysis. Previous microscopy studies of the WAW discs showed typical EB decay and no trace of soft rot fungi or tunnelling bacteria (Figure 1) (Pedersen et al. 2014).
CRI was performed on cross sections from the sapwood of the three WAW discs. Specimens were hand cut with razor blades in a distance of 0–5 mm or 10–15 mm from the surface of each pole with
a
b
CC S2 RM RM S2 S1 CML S RM CC CMLFigure 1 Light (a) and transmission electron microscopy (b) images of waterlogged archaeological wood decayed by erosion bacteria. Sound tracheids (S/S2) are distributed among decayed. Decayed tracheids hold an amorphous residual material (RM). Cell corners (CC), compound middle lamella (CML), and S1 are intact. Scale bars = 50 μm (a) and 1 μm (b).
at least one growth ring present in each specimen. The same sam-ple regions had previously been examined with LM, TEM, and UMSP (Pedersen et al. 2014). Three specimens were taken from pole 1, and one specimen from each of pole 2 and pole 3. Two specimens were prepared from sapwood of the reference material. The specimens were placed on a microscope slide, immersed in water, covered with a cover-slip, and sealed with nail polish. The specimens were aligned under the CRI microscope so that the tangential directions were paral-lel to the laser polarisation. Raman spectra were acquired with a con-focal Raman microscope (alpha300, WITec GmbH, Ulm, Germany) equipped with an objective [100 × , oil, NA = 1.25, 0.17 mm cover slip correction from Nikon Instruments (Amstelveen, The Netherlands)] and a high-precision motorized scan stage. A linear polarised laser with 532 nm wavelength (Crysta Laser, Reno, NV, USA) was focused with a diffraction limited spot size of 0.61 × λ/NA. Raman light was detected with an air cooled back-illuminated charge-coupled device (CCD) detector (DV401_BV, Andor, Belfast, UK) with a spectral resolu-tion of 6 cm-1. It has been observed that the 1600 cm-1 band assigned to lignin is declined in wood tissue sampled in water when exposed to an intense laser beam (Agarwal 2006). Thus the laser beam inten-sity was reduced to half of the power to avoid sample degradation. In addition, all specimens were observed with the same instrument parameters. Latewood areas of interest were chosen for sequential scanning of spectra of adjacent sample positions by means of the motorised stage (mapping). An integration time of 0.4 s was cho-sen and every pixel corresponded to one scan. One spectrum was acquired for every 0.33 μm step. Every Raman image is thus based on thousands of spectra, each being a spatially resolved molecular “fingerprint” of the cell wall.
The ScanCtrlSpectroscopy 2.08 software (WITec, Ulm, Germany) was used for the measurement setup, the spectral analysis, and the image processing. Raman images were produced with a sum filter that calculated the integrated band area intensity within the cho-sen wavenumber interval (linear baseline subtracted). The band at 1095 cm-1 (1080–1190 cm-1, CC and CO stretching of carbohydrates) was selected for imaging of the carbohydrate distribution (Wiley and Atalla 1987; Agarwal and Ralph 1997). The distribution of the lignin content was depicted based on the band at 1600 cm-1 (1540–1720 cm-1, aromatic ring stretching) (Agarwal and Ralph 1997). This band interval contains a bending mode for water at 1640 cm-1 but this weak band (even in presence of pure water in the lumens) is not expected to contribute significantly to the total intensity of the lignin band. The CH and CH2 stretching vibrations at 2900 cm-1 (2840–3000 cm-1) were used for a general view of the wood structure and the quality of the analysed specimens. To overcome artefacts caused by uneven surfaces and changes in laser intensity, ratios were constructed based on the lignin (1600 cm-1) and carbohydrate (1095 cm-1) bands (Hän-ninen et al. 2011; Gierlinger et al. 2012). However, decayed tracheids were evaluated by images constructed from the area of the chosen Raman bands rather than from peak area ratios due to massive loss of carbohydrates, which made the ratio method impracticable.
Average spectra were constructed by marking selected areas on the Raman image. Average spectra were generated on all obtained Raman images from CC areas, radial (R) and tangential (T) CML areas, sound S2 areas, S1 areas parallel to the laser light, RM areas, and RM areas with high, low, and intermediate lignin contents. Each area was a sum of as many cell wall compartment areas as possible. Summed areas varied from approximately 10 μm2 (CC areas) to 1000 μm2 or more (S2 and RM areas). All average Raman spectra are pre-sented without further modification.
Sample areas for ATR-FTIR with complete EB decay (where no intact tracheids are left) and inner parts of the poles without micro-biological decay were located in the three WAW discs by LM examina-tion of hand cut cross secexamina-tions with light microscope (Zeiss Axioplan, Jena, Germany). Specimens were hand cut in radial-longitudinal direction (RL) with a thickness of approximately 1 mm. Five speci-mens were taken from a distance of 0–2 mm from the surface in two different areas on two of the discs (10 specimens for each disc) repre-senting xylem with complete EB decay of the S2 layer. Five specimens were taken in a distance of 30–50 mm from the surface in two differ-ent areas on all three discs (10 specimens for each disc) represdiffer-enting sound xylem without microbiological decay. Reference material was hand cut randomly in RL direction from P. abies sapwood (10 speci-mens) and heartwood (10 specispeci-mens). ATR-FTIR measurements were recorded on a Thermo Scientific (Waltham, MA, USA) Nicolet 6700 FT-IR, Pike Technologies GladiATR diamond spectrometer, a work-ing temperature of 25°C in the range 4000 cm-1 to 600 cm-1 with 100 scans and a resolution of 4.0 cm-1; a background was taken with 200 scans. All IR spectra were normalised by standard normal variate (SNV) transformation. This is a data pre-treatment that scales and centres each spectrum and removes light scattering effects (Barnes et al. 1989).
Results and discussion
Sound tracheids
CRI of reference material (Figure 2a) showed expected
high levels of lignin in CC and CML and high
polysaccha-ride contents in the secondary (S2) cell wall (Fengel 1969;
Fergus et al. 1969). However, lignin in both S2 and CC
may be more heterogeneously distributed than suggested
by UV studies (Tirumalai et al. 1996; Singh et al. 2002;
Agarwal 2006). In this context, the heterogeneity of the
0 0.467 0 0.446
a
S RM
RM
b
Figure 2 Raman images of Norway spruce generated as ratios of sum filters from 1080 to 1190 cm-1 (CC and CO stretching vibrations, carbohydrates) and from 1540 to 1720 cm-1 (aromatic ring stretching, lignin). (a) Reference (b) waterlogged archaeological wood decayed by erosion bacteria; sound tracheids (S) have the same carbohy-drate and lignin distribution as the reference. Scale bars = 5 μm.
reference was moderate (Figure 2a). Sound tracheids in
WAW had overall the same carbohydrate and lignin
dis-tribution as the reference (Figure 2b). This was expected
based on LM, TEM and UMSP analysis of the same
mate-rial (Pedersen et al. 2014) and from earlier microscopic
studies of waterlogged archaeologcial wood (WAW)
(Blanchette et al. 1990; Björdal et al. 2000).
Tracheids decayed by EB
Distinct band increments assigned to lignin (1605 cm
-1,
1590 cm
-11508 cm
-1, 1263 cm
-1, 1215 cm
-1, 1140 cm
-11086
cm
-1, and 856 cm
-1) and band decrements assigned to
carbohydrates (1732 cm
-1, 1307 cm
-1, 1095 cm
-1, 1050 cm
-1,
1024 cm
-1, and 895 cm
-1) were seen in ATR-FTIR spectra of
heavily decayed WAW xylem from the outermost growth
rings compared to the reference (Marchessault 1962; Faix
1991; Schwanninger et al. 2004; Fackler et al. 2010) (Figure
3). This is in agreement with previous FT-IR spectroscopy
studies of WAW (Pavlikova et al. 1993; MacLeod and
Rich-ards 1997; Gelbrich et al. 2008; Giachi and Pizzo 2009;
Petrou et al. 2009). Even though the analysed WAW did not
have any intact S2, the carbohydrate contributions were
still strong except for the band assigned to C = O stretch in
unconjugated carbonyls at 1735 cm
-1(Schwanninger et al.
2004), which was completely lost. The relatively strong
carbohydrate contribution is expected to stem from
pol-ysaccharides in CML, sound S1, and fractions of S3 still
present in the heavily decayed xylem.
CRI (Figure 2b) shows massive loss of carbohydrates
in the RM left after S2 decay. This is the results of the
preferential decay of polysaccharides in the S2 by EB
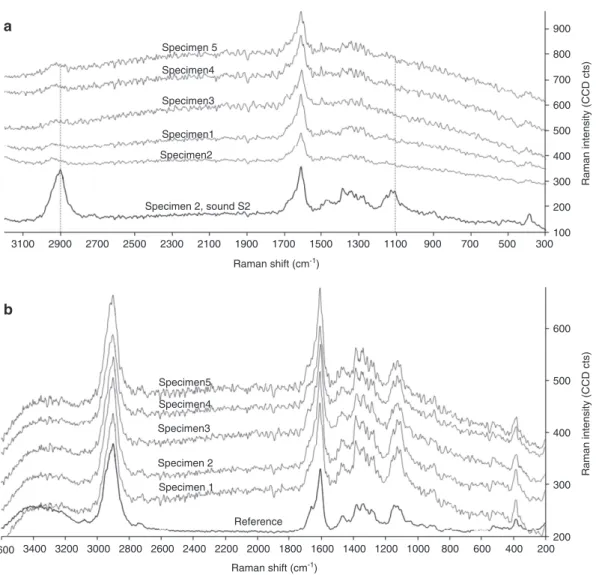
(Pedersen et al. 2013). Average spectra from CRI in RM
areas and sound S2 layers confirmed strong depletion of
polysaccharides (Figure 4a). The band at 1095 cm
-1(car-bohydrates) was completely lost. The band at 2900 cm
-1(CH and CH
2stretching) was heavily reduced, which
further confirms loss of carbohydrates. Raman spectra
obtained from the WAW specimens had noisier Raman
spectra than the reference (Figure 4b). This is most likely
due to an increased fluorescence caused by the higher
relative lignin content and/or chromophores formed
in WAW. Due to the high fluorescence, the
polysaccha-ride bands in WAW were expected to be less resolved.
On the other hand, sound cell wall areas in WAW had
polysaccharide band intensities (1095 cm
-1and 2900 cm
-1)
comparable to the reference (Figure 4b). Thus the
poly-saccharide depletion in the RM of decayed tracheids can
be ascribed to EB decay.
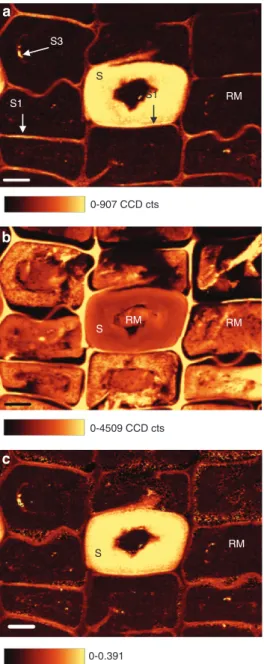
CRI constructed as sum filters from 1080 to 1190 cm
-1(carbohydrates) also showed very low carbohydrate
content in the RM (Figure 5a). The carbohydrate content
was less than observed in CML and in some CC areas.
This is a sign of effective polysaccharide degradation by
EB. However, a few small areas with carbohydrate levels
as high as in sound S2 were also observed (Figure 5a).
These areas were interpreted as un-decayed fractions of
S3, as such fractions have been observed previously by
TEM (Pedersen et al. 2014). The tangential CMLs showed
1735 180 0 1750 1700 1650 1600 1550 1500 1450 1400 1350 1300 1250 1200 1150 1100 1050 1000 950 900 850 800 750 809 4.2 3.7 3.2 2.7 2.2 1/rel. 1.7 1.2 0.7 0.2 Sound xylem Heavily decayed xylem
Reference material
Wavenumber (cm-1)
867
Figure 3 Average ATR-FTIR spectra of sound waterlogged archaeological spruce xylem, of heavily decayed surface layers of spruce xylem, and of reference. Band positions for unconjugated C = O stretching in acetyl groups in glucomannan and ester linkages in the carbohydrate lignin complex (1735 cm-1) and for the glucomannan backbone (867 and 809 cm-1) are indicated with arrows.
in general higher Raman intensities of the carbohydrate
bands than those of the radial CML (Figure 5a). This is
not due to concentration differences, but to the various
microfibril orientations in T and R oriented cell walls in
the preserved S1 layer relative to the laser polarisation.
Changing the laser polarization from parallel (0°) to
per-pendicular (90°) to the microfibril angle (MFA) in cross
sections leads to large changes in the Raman intensity of
almost all characteristic bands (Agarwal and Atalla 1986;
Gierlinger et al. 2010; Thygesen and Gierlinger 2013).
Images constructed as sum filters from 1540 to
1720 cm
-1(aromatic ring stretching; Figure 5b) showed a
better distinction between RM and empty lumen areas,
and a more varied distribution of lignin in the RM
com-pared to images constructed as band ratios (Figure 5c).
The lignin distribution images showed that all decayed
tracheids contained RM with high, intermediate, and low
levels of aromatic compounds within the same tracheids
(Figure 5b). These lignin concentrations corresponded
to normal levels in CML, normal levels in sound S2, and
lower levels than seen in sound S2, respectively. This lignin
distribution pattern was also observed with UMSP of the
same sample material (Pedersen et al. 2014). The Raman
data demonstrated that the uneven lignin distribution in
the RM is not an artefact due to sample modification (e.g.,
embedding in Spurr’s resin for UMSP measurements), as
the sampling for CRI does not need dehydration or
embed-ding in a resin.
The lignin contribution in FT-IR spectra of EB
degraded WAW was much stronger than in the reference,
but no band broadening was observed. The Raman band
at 1600 cm
-1(aromatic ring stretching) revealed different
Specimen4 Specimen3 Specimen1 Specimen2 Specimen 2, sound S2 3100 2900 2700 2500 2300 2100 1900 1700 1500 1300 1100 900 700 500 300 Raman intensity (CCD cts) 900 800 700 600 500 400 300 200 100 Raman intensity (CCD cts) 200 300 400 500 600 Specimen 5 Specimen5 Reference Specimen 1 Specimen 2 Specimen3 Specimen4a
b
Raman shift (cm-1) 3200 3400 3600 3000 2800 2600 2400 2200 2000 1800 1600 1400 1200 1000 800 600 400 200 Raman shift (cm-1)Figure 4 Average Raman spectra of (a) residual material (RM) and of (b) sound S2 in waterlogged archaeological spruce in five different specimens (grey lines) compared to a spectrum of either sound S2 (a) or S2 in reference (b) (black lines). (a) RM show total lack of carbo-hydrates contributions (1095 cm-1 and 2900 cm-1, dotted lines) (b) Spectra of sound S2 in waterlogged spruce show minor spectral changes compared to reference (1600 cm-1 and 1100 cm-1).
intensities for the RM but no band broadening,
evolve-ment of new shoulders, or any band shifts compared to
sound S2 in WAW (Figure 6). This indicates that the
chem-ical composition of lignin in the S2 did not change due to
EB decay. However, depolymerisation of lignin cannot be
ruled out.
Abiotic decay in morphologically sound
xylem
Average Raman spectra of morphologically sound cell wall
compartments (CC, CML, S2, and S1) in WAW showed small
spectral differences compared to those of the reference
(Figure 4b). ATR-FTIR analysis of sound WAW xylem
con-firmed that minor chemical changes had occurred in areas
free from microbiological decay compared to the reference
(Figure 3). The cell walls were morphologically intact and
the chemical changes must therefore be assigned to abiotic
decay as a consequence of waterlogging for 400 years.
In ATR-FTIR spectra of sound xylem, the band at
1735 cm
-1was completely lost, as was seen in heavily
decayed xylem (Figure 3). The band is assigned to C = O
stretch in unconjugated carbonyls (Schwanninger et al.
2004) or more limited to C = O stretching of acetyl or
carboxylic acid in hemicelluloses (Marchessault 1962).
Complete loss of the band at 1735 cm
-1has been observed
earlier in WAW and has in some cases been ascribed to
degradation of hemicelluloses (Kim 1990; Wilson et al.
1993; MacLeod and Richards 1997; Giachi and Pizzo 2009;
Sandak et al. 2010). Band positions for unconjugated
carbonyl groups are in the range from 1810 to 1690 cm
-1with esters giving the best match at 1735 cm
-1(Pavia et al.
2009). Un-conjugated carbonyl groups are not present
in softwood lignin in significant amounts (Brunow and
Lundquist 2010). In softwood hemicelluloses, esters are
mainly acetyl groups in galactoglucomannans and in
lignin-carbohydrate complexes between the carboxylic
a
S RM S3 S1 S1b
S RM RM S RM 0-907 CCD cts 0-4509 CCD cts 0-0.391c
Figure 5 Raman images of one waterlogged archaeological wood specimen decayed by erosion bacteria generated as sum filters from 1080 to 1190 cm-1 (carbohydrates) (a) and 1540 to 1720 cm-1 (lignin) (b). Or generated as a ratio of sum filters from 1080 to 1190 cm-1 and 1540 to 1720 cm-1 (c). One sound tracheid (S) is surrounded by decayed tracheids that contain residual material (RM) with variable levels of lignin (b) but no signal from carbohydrates (a and c); the sound tracheid contains RM due to decay situated elsewhere in the tracheid. Remnants of S3 and S1 can be detected (a). Scale bar = 10 μm. Sound 1800 1700 1600 1500 1400 Raman shift (cm-1) Low Intermediate High
Figure 6 Average Raman spectra of residual material with high, low, and intermediate levels of aromatic ring stretching contribu-tions in the band area assigned to lignin (1600 cm-1) compared to sound S2. The lignin bands do not show any band broadening but merely a difference in intensity.
acid groups in glucopyranosyluronic acid side chains of
heteroxylans and OH groups of lignin (Balakshin et al.
2007; Harris and Stone 2008; Balakshin et al. 2011).
Con-sequently, the band can be assigned to carbonyl groups
in side groups of hemicelluloses. The FTIR spectrum
shows indeed larger contribution from glucomannan at
867 cm
-1and 809 cm
-1(Marchessault 1962) in WAW
com-pared to reference (Figure 3). Accordingly, the
glucoman-nan backbone was preserved but the acetyl groups lost.
This finding is supported by a study by Pan et al. (1990)
on 6600 years old waterlogged intact hardwood
(Bischo-fia polycarpa).
13C NMR analyses on milled wood lignin
(MWL) from the WAW showed that the remaining
hemi-cellulose fraction did not contain any O-acetyl groups,
which was believed to be caused by slow in situ
hydroly-sis of the acetyl groups to acetic acid. The enhanced
acidity that results from this process has the potential
to depolymerise the biopolymers by catalysing
hydroly-sis of glycosidic bonds in polysaccharides and ether
bonds in lignin. The process is believed to be very slow
for the material studied here due to low temperature,
low concentration of acetic acid, relatively high pK
aof
acetic acid, and steric hindrance in the solid
lignocellu-losic material. It is not clear to which degree xylan was
degraded apart from the loss of ester linkages. Splitting
ester linkages within the lignin-carbohydrate complex
should lead to a weakening of the cell wall though the
microfibrils remain intact. This is consistent with
obser-vations by Borgin et al. (1975). In Raman spectra, bands
of hemicelluloses are not clearly visible as they are
over-lapping with cellulose bands (Agarwal and Ralph 1997).
However, small spectral changes are observed in Raman
spectra of sound S2 compared to the reference around
1100 cm
-1and 2900 cm
-1(Figure 4b). This supports the
observed modification of hemicelluloses from the
ATR-FTIR analysis.
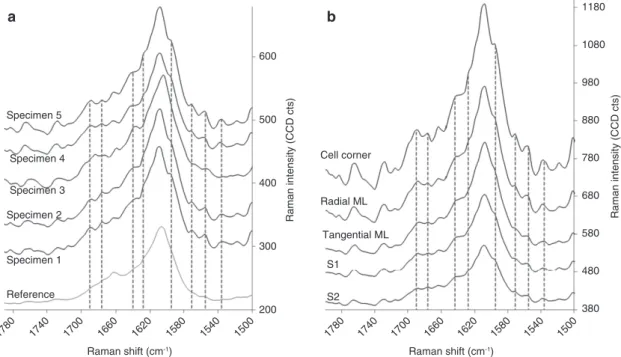
The spectral fingerprint of the Raman band at 1600 cm
-1(lignin) is identical in sound cell wall compartments and
in RM of WAW, but slightly different to that of the
refer-ence (Figure 7a). This indicates small abiotic modifications
of the lignin due to the waterlogged environment. All five
WAW specimens feature several shoulders that were not
observed in the reference. Comparing the different sound
cell wall compartments (S2, S1, CC, and R and T CML) in
individual specimens showed unchanged spectral
finger-print for the aromatic ring stretching region (Figure 7b).
The more noisy character of the WAW Raman spectra has
to be taken into consideration. Nevertheless, it is striking
that four specimens (specimen 1, 2, 4, 5) of the five show
the same trends. The aromatic ring stretching at 1607 cm
-1and 1664 cm
-1appear at the same wavenumber but
shoul-ders at approximately 1555, 1571, 1595, 1628, 1644, 1676, and
a
Specimen 5 Specimen 4 Specimen 3 Specimen 2 Specimen 1 Referenceb
S2 S1 Tangential ML Radial ML Cell cornerRaman shift (cm-1) Raman shift (cm-1)
Raman intensity (CCD cts) Raman intensity (CCD cts) 1180 1080 980 600 500 400 300 200 178 0 174 0 170 0 166 0 162 0 158 0 154 0 150 0 178 0 174 0 170 0 166 0 162 0 158 0 154 0 150 0 880 780 680 580 480 380
Figure 7 Average Raman spectra in the band area assigned to lignin (1600 cm-1). (a) Sound S2 in five waterlogged
archaeo-logical wood specimens and in reference material (detail of spectrum in Figure 5); shoulders that are not present in reference is shown with vertical dashed lines. (b) Sound cell wall compartments of specimen 4; all shoulders in the 1600 cm-1 band area are identical in all cell wall compartments.
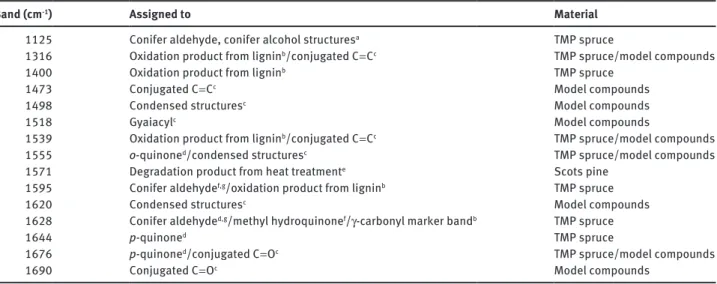
Table 1 Raman bands assigned to oxidation of lignin collected from the literature.
Band (cm-1) Assigned to Material
1125 Conifer aldehyde, conifer alcohol structuresa TMP spruce
1316 Oxidation product from ligninb/conjugated C = Cc TMP spruce/model compounds
1400 Oxidation product from ligninb TMP spruce
1473 Conjugated C = Cc Model compounds
1498 Condensed structuresc Model compounds
1518 Gyaiacylc Model compounds
1539 Oxidation product from ligninb/conjugated C = Cc TMP spruce/model compounds
1555 o-quinoned/condensed structuresc TMP spruce/model compounds
1571 Degradation product from heat treatmente Scots pine
1595 Conifer aldehydef,g/oxidation product from ligninb TMP spruce
1620 Condensed structuresc Model compounds
1628 Conifer aldehyded,g/methyl hydroquinonef/γ-carbonyl marker bandb TMP spruce
1644 p-quinoned TMP spruce
1676 p-quinoned/conjugated C = Oc TMP spruce/model compounds
1690 Conjugated C = Oc Model compounds
aAgarwal and McSweeny (1997). bVester et al. (2004).
cSaariaho et al. (2005). dAgarwal (1998). eNuopponen et al. (2004). fAgarwal (2008).
gAgarwal and Ralph (2008).
1690 cm
-1emerged in the WAW. Specimen 3 was regarded
as an outlier since this specimen is from the same pole
as specimens 1 and 2. Based on the literature concerning
photochemically or enzymatically oxidised or heat treated
wood or thermo mechanical pulp (TMP) presented in Table
1, it can be concluded that lignin is most likely oxidised in
WAW to structures such as conifer aldehyde, conjugated
C = C, conjugated C = O, o-quinone, and p-quinone (Pandey
and Vuorinen 2008). Comprehensive oxidation of
aro-matic rings will lower and broaden the 1600 band cm
-1and
give rise to spectral changes in the 1500–1000 cm
-1range
as a consequence of degradation products (Agarwal and
McSweeny 1997; Pandey and Vuorinen 2008). However,
this is not the case for the WAW but could be explained by
the fact that the cell walls of the WAW are morphologically
intact; de-polymerisation has not occurred within the
lig-nocellulosic matrix of the cell wall at this initial stage of
oxidation.
Conclusion
CRI of waterlogged archaeological wood (WAW) P. abies
found as poles submerged under anoxic condition for
approximately 400 years and solely decayed by EB
con-firmed that decayed tracheids hold a lignin containing RM
and that the distribution of lignin varies within the same
tracheid from lower levels than seen in sound S2 to levels
as high as in the CML. Raman spectra show that the
chem-ical composition of the lignin in the RM do not differ from
intact S2. However, the RM reveals strong depletion of
car-bohydrates indicating an effective carbohydrate
metabo-lism by EB. Evidence for abiotic decay due to waterlogging
was found in intact xylem free from microbiological decay.
ATR-FTIR spectra showed complete loss of acetyl groups
in hemicelluloses and loss of ester linkages, probably from
lignin-carbohydrate complexes, whereas Raman spectra
revealed minor oxidation of the lignin polymer.
Acknowledgments: Nanna Bjerregaard Pedersen would
like to thank COST Action FP0802 for supporting the work
as a Short Term Scientific Mission. We thank Institute of
Polymer Science, Johannes Kepler University, Linz,
Aus-tria for hosting the experiments and Museum of
Copenha-gen for donation of the test material.
References
Agarwal, U.P. (1998) Assignment of the photoyellowing-related 1675 cm-1 Raman/IR band to p-quinones and its implications to the mechanism of color reversion in mechanical pulps. J. Wood Chem. Technol. 18:381–402.
Agarwal, U.P. (2006) Raman imaging to investigate ultrastructure and composition of plant cell walls: distribution of lignin and cellulose in black spruce wood (Picea mariana). Planta 224:1141–1153.
Agarwal, U.P. (2008) Raman spectroscopic characterization of wood and pulp fibers. In: Characterization of Lignocellulosic Materi-als. Blackwell Publishing Ltd., Oxford, UK. pp. 17–35. Agarwal, U.P., Atalla, R.H. (1986) In-situ Raman microprobe studies
of plant cell walls: Macromolecular organization and composi-tional variability in the secondary wall of Picea mariana (Mill.) B.S.P. Planta 169:325–332.
Agarwal, U.P., McSweeny, J.D. (1997) Photoyellowing of thermome-chanical pulps: looking beyond alpha-carbonyl and ethylenic groups as the initiating structures. J. Wood Chem. Technol. 17:1–26.
Agarwal, U.P., Ralph, S.A. (1997) FT-Raman spectroscopy of wood: identifying contributions of lignin and carbohydrate polymers in the spectrum of black spruce (Picea mariana). Appl. Spec-trosc. 51:1648–1655.
Agarwal, U.P., Ralph, S.A. (2008) Determination of ethylenic resi-dues in wood and TMP of spruce by FT-Raman spectroscopy. Holzforschung 62:667–675.
Balakshin, M.Y., Capanema E.A., Chang, H.-M. (2007) MWL fraction with a high concentration of lignin-carbohydrate linkages: isolation and 2D NMR spectroscopic analysis. Holzforschung 61:1–7.
Balakshin, M., Capanema, E., Gracz, H., Chang, H.-M., Jameel, H. (2011) Quantification of lignin-carbohydrate linkages with high-resolution NMR spectroscopy. Planta 233:1097–1110.
Barnes, R.J., Dhanoa, M.S., Lister, S.J. (1989) Standard normal variate transformation and de-trending of near-infrared diffuse reflectance spectra. Appl. Spectrosc. 43:772–777.
Björdal, C.G., Nilsson, T., Daniel, G. (1999) Microbial decay of waterlogged archaeological wood found in Sweden applica-ble to archaeology and conservation. Int. Biodeter. Biodegr. 43:63–73.
Björdal, C.G., Daniel, G., Nilsson, T. (2000) Depth of burial, an important factor in controlling bacterial decay of waterlogged archaeological poles. Int. Biodeter. Biodegr. 45:15–26. Blanchette, R.A., Nilsson, T., Daniel, G. Abad, A. (1990) Biological
degradation of wood. In: Archaeological Wood. Properties, Chemistry, and Preservation. Eds. Rowell, R.M., Barbour, R.J. American Chemical Society, Washington, DC. pp. 141–174. Borgin, K., Parameswaran, N., Liese, W. (1975) The effect of aging on
the ultrastructure of wood. Wood Sci. Technol. 9:87–98. Brunow, G., Lundquist, K. (2010) Functional groups and bonding
patterns in lignin (including the lignin-carbohydrate com-plexes). In: Lignin and Lignans. Advances in Chemistry. Eds. Heitner, C., Dimmel, D.R., Schmidt, J.A. CRC Press, Boca Raton, FL. pp. 267–299.
Cufar, K., Gricar, J., Zupancic, M., Koch, G., Schmitt, U. (2008) Anatomy, cell wall structure and topochemistry of waterlogged archaeologi-cal wood aged 5,200 and 4,500 years. IAWA J. 29:55–68. Fackler, K., Thygesen, L.G. (2013) Microspectroscopy as applied
to the study of wood molecular structure. Wood Sci. Technol. 47:203–222.
Fackler, K., Stevanic, J.S., Ters, T., Hinterstoisser, B., Schwan-ninger, M., Salmen, L. (2010) Localisation and characterisation of incipient brown-rot decay within spruce wood cell walls using FT-IR imaging microscopy. Enzyme Microb. Technol. 47:257–267.
Faix, O. (1991) Classification of lignins from different botanical origins by FT-IR spectroscopy. Holzforschung 45:21–27. Fengel, D. (1969) Ultrastructure of cellulose from wood. 1. Wood as
basic material for isolation of cellulose. Wood Sci. Technol. 3:203–217.
Fergus, B.J., Procter, A.R., Scott, J.A.N., Goring, D.A.I. (1969) The dis-tribution of lignin in sprucewood as determined by ultraviolet microscopy. Wood Sci. Technol. 3:117–138.
Gelbrich, J., Mai, C., Militz, H. (2008) Chemical changes in wood degraded by bacteria. Int. Biodeter. Biodegr. 61:24–32. Giachi, G., Pizzo, B. (2009) A chemical characterisation of the decay
of waterlogged archaeological wood. In: Proceedings of the 10th ICOM Group on Wet Organic Archaeological Materials Conference, Amsterdam 2007. Eds. Strætkvern, K., Huisman, D.J. Rijksdienst voor Archaeologie, Cultuurlandschap en Monu-menten, Amersfoort. pp. 21–33.
Gierlinger, N., Schwanninger, M. (2007) The potential of Raman microscopy and Raman imaging in plant research. Spectros-copy 21:69–89.
Gierlinger, N., Luss, S., König, C., Konnerth, J., Eder, M., Fratzl, P. (2010) Cellulose microfibril orientation of Picea abies and its variability at the micron-level determined by Raman imaging. J. Exp. Bot. 61:587–595.
Gierlinger, N., Keplinger, T., Harrington, M. (2012) Imaging of plant cell walls by confocal Raman microscopy. Nat. Prot. 7: 1694–1708.
Hänninen, T., Kontturi, E., Vuorinen, T. (2011) Distribution of lignin and its coniferyl alcohol and coniferyl aldehyde groups in Picea abies and Pinus sylvestris as observed by Raman imaging. Phytochemistry 72:1889–1895.
Harris, P.J., Stone, B.A. (2008) Chemistry and molecular organiza-tion of plant cell walls. In: Biomass Recalcitrance. Decon-structing the Plant Cell Wall for Bioenergy. Ed. Himmel, M.E. Blackwell Publishing, Oxford. pp. 61–93.
Holt, D.M., Jones, E.B. (1983) Bacterial degradation of lignified wood cell walls in anaerobic aquatic habitats. Appl. Environ. Microbiol. 46:722–727.
Kim, Y.S. (1990) Chemical characteristics of waterlogged archaeo-logical wood. Holzforschung 44:169–172.
Kim, Y.S., Singh, A.P. (2000) Micromorphological characteristics of wood biodegradation in wet environments: a review. IAWA J. 21:135–155.
Kim, Y.S., Singh, A.P., Nilsson, T. (1996) Bacteria as important degraders in waterlogged archaeological woods. Holz-forschung 50:389–392.
Klaassen, R.K.W.M. (2008) Bacterial decay in wooden foundation piles – patterns and causes: a study of historical pile founda-tions in the Netherlands. Int. Biodeter. Biodegr. 61:45–60. Koch, G., Kleist, G. (2001) Application of scanning UV
microspectro-photometry to localise lignins and phenolic extractives in plant cell walls. Holzforschung 55:563–567.
MacLeod, I.D., Richards, V.L. (1997) Wood degradation on historic shipwreck sites: the use of FT-IR spectroscopy to study the loss of hemicellulose. In: Proceedings of the 6th ICOM Group on Wet Organic Archaeological Materials Conference, York 1996. Eds. Hoffmann, P., Grant, T., Spriggs, J.A., Daley, T. The International Council of Museums (ICOM), Bremerhaven. pp. 203–225.
Marchessault, R.H. (1962) Application of infra-red spectroscopy to cellulose and wood polysaccharides. In: Pure and Applied
Chemistry. Wood Chemistry Symposium, Montreal, Canada, 9–11 August 1961, pp. 107–129.
Nilsson, T., Klaassen, R.K.W.M. (2008) Abiotic or bacterial degrada-tion? IAWA J. 29:336–338.
Nuopponen, M., Vuorinen, T., Jamsa, S., Viitaniemi, P. (2004) Thermal modifications in softwood studied by FT-IR and UV resonance Raman spectroscopies. J. Wood Chem. Technol. 24:13–26.
Pan, D.R., Tai, D.S., Chen, C.L., Robert, D. (1990) Comparative-stud-ies on chemical-composition of wood components in recent and ancient woods of Bischofia-polycarpa. Holzforschung 44:7–16.
Pandey, K.K., Vuorinen, T. (2008) Comparative study of photodegra-dation of wood by a UV laser and a xenon light source. Polym. Degrad. Stabil. 93:2138–2146.
Pavia, D.L., Lampman, G.M., Kriz, G.S., Vyvyan, J.R. Introduction to Spectroscopy. Brooks/Cole, Belmont, CA, USA, 2009. Pavlikova, H., Sykorova, I., Cerny, J., Sebestova, E., Machovic, V.
(1993) Spectroscopic study of degraded woods from the Elbe river valley. Energy Fuels 7:351–356.
Pedersen, N.B., Björdal, C.G., Jensen, P., Felby, C. (2013) Bacte-rial degradation of archaeological wood in anoxic water-logged environments. In: Stability of Complex Carbohydrate Structures. Biofuel, Foods, Vaccines and Shipwrecks. Ed. Harding, S.E. The Royal Society of Chemistry, Cambridge. pp. 160–187.
Pedersen, N.B., Schmitt, U., Koch, G., Felby, C., Thygensen, L.G. (2014) Lignin distribution in waterlogged archaeological Picea abies (L.) Karst degraded by erosion bacteria. Holzforschung 68:791–798 .
Petrou, M., Edwards, H.G.M., Janaway, R.C., Thompson, G.B., Wilson, A.S. (2009) Degradation of Neolithic waterlogged pine and oak timbers from northern Greece. In: Proceedings of the 10th ICOM Group on Wet Organic Archaeological Materials Conference, Amsterdam 2007. Eds. Strætkvern, K., Huisman, D.J. Rijksdienst voor Archaeologie, Cultuurlandschap en Monu-menten, Amersfoort. pp. 57–67.
Rehbein, M., Koch, G., Schmitt, U., Huckfeldt, T. (2013) Topochemi-cal and transmission electron microscopic studies of bacterial decay in pine (Pinus sylvestris L.) harbour foundation piles. Micron 44:150–158.
Richter, S., Müssig, J., Gierlinger, N. (2011) Functional plant cell wall design revealed by the Raman imaging approach. Planta 233:763–772.
Saariaho, A.M., Argyropoulos, D.S., Jaaskelainen, A.S., Vuorinen, T. (2005) Development of the partial least squares models for the interpretation of the UV resonance Raman spectra of lignin model compounds. Vibrat. Spectrosc. 37:111–121.
Sandak, A., Sandak, J., Zborowska, M., Pradzynski, W. (2010) Near infrared spectroscopy as a tool for archaeological wood characterization. J. Archaeol. Sci. 37:2093–2101.
Schwanninger, M., Rodrigues, J.C., Pereira, H., Hinterstoisser, B. (2004) Effects of short-time vibratory ball milling on the shape of FT-IR spectra of wood and cellulose. Vibrat. Spectrosc. 36:23–40. Singh, A.P., Butcher, A.J. (1991) Bacterial degradation of wood cell
walls: a review of degradation patterns. J. Inst. Wood Sci. 12:143–157.
Singh, A.P., Nilsson, T., Daniel, G.F. (1990) Bacterial attack of Pinus sylvestris wood under near anaerobic conditions. J. Inst. Wood Sci. 11:237–249.
Singh, A., Daniel, G., Nilsson, T. (2002) Ultrastructure of the S-2 layer in relation to lignin distribution in Pinus radiata trac-heids. J. Wood Sci. 48:95–98.
Thygesen, L.G., Gierlinger, N. (2013) The molecular structure within dislocations in Cannabis sativa fibres studied by polarised Raman microspectroscopy. J. Struct. Biol. 182:219–225. Tirumalai, V.C., Agarwal, U.P., Obst, J.R. (1996) Heterogeneity of
lignin concentration in cell corner middle lamella of white birch and black spruce. Wood Sci. Technol. 30:99–104.
van der Lelie, D., Taghavi, S., McCorkle, S.M., Li, L.L., Malfatti, S.A., Monteleone, D., Donohoe, B.S., Ding, S.Y., Adney, W.S., Him-mel, M.E., Tringe, S.G. (2012) The metagenome of an anaerobic microbial community decomposing poplar wood chips. PLoS One 7:1–16.
Vester, J., Felby, C., Nielsen, O.F., Barsberg, S. (2004) Fourier trans-form Raman difference spectroscopy for detection of lignin oxidation products in thermomechanical pulp. Appl. Spectrosc. 58:404–409.
Wiley, J.H., Atalla, R.H. (1987) Band assignments in the Raman spec-tra of celluloses. Carbohydr. Res. 160:113–129.
Wilson, M.A., Godfrey, I.M., Hanna, J.V., Quezada, R.A., Finnie, K.S. (1993) The degradation of wood in old Indian Ocean ship-wrecks. Org. Geochem. 20:599–610.