HAL Id: hal-00688512
https://hal.archives-ouvertes.fr/hal-00688512
Submitted on 17 Apr 2012HAL is a multi-disciplinary open access archive for the deposit and dissemination of sci-entific research documents, whether they are pub-lished or not. The documents may come from teaching and research institutions in France or abroad, or from public or private research centers.
L’archive ouverte pluridisciplinaire HAL, est destinée au dépôt et à la diffusion de documents scientifiques de niveau recherche, publiés ou non, émanant des établissements d’enseignement et de recherche français ou étrangers, des laboratoires publics ou privés.
ventilated dwelling
Séverine Kirchner, Anne-Marie Laurent, Bernard Collignan, Yvon Le Moullec,
Olivier Ramalho, Jean Georges Villenave, Jean-Paul Flori
To cite this version:
Séverine Kirchner, Anne-Marie Laurent, Bernard Collignan, Yvon Le Moullec, Olivier Ramalho, et al.. Impact of the urban pollution on the indoor environment - Experimental study on a mechanical ventilated dwelling. 9th International Conference on Indoor Air Quality and Climate Indoor Air’2002, Jun 2002, Monterey, United States. pp.164-169. �hal-00688512�
IMPACT OF THE URBAN POLLUTION ON THE INDOOR
ENVIRONMENT - EXPERIMENTAL STUDY ON A MECHANICAL
VENTILATED DWELLING
S Kirchner1*, AM Laurent2, B Collignan1, Y Le Moullec2, O Ramalho1, JG Villenave1 and
JP Flori3
1Centre Scientifique et Technique du Bâtiment (CSTB), Marne-la-Vallée, France 2 Laboratoire d'Hygiène de la Ville de Paris (LHVP), Paris, France
3Centre Scientifique et Technique du Bâtiment (CSTB), Nantes, France
ABSTRACT
This study aims to assess the transfer of outdoor air pollution into an unoccupied dwelling in Paris area with heavy traffic during winter and summer periods. CO, SO2, NO, NO2, O3,
BTEX, PM 2.5, black smoke index were monitored simultaneously indoors and outdoors. The
indoor/outdoor relationships have been studied regarding ventilation strategies and indoor surface impact. Results show that a reduction of the average daily concentrations of NO (7-30%), SO2 (33-41%), O3 (80%), PM 2.5 (20%) and black smoke (20%) is observed indoors in
reference to outdoors. The inert gas CO is integrally transferred. NO2 shows no apparent
difference between outdoor and indoor daily concentrations but the I/O ratio can be
significantly above one in summer (high reactivity between NO and O3). In the presence of
sorbing material, indoor concentrations of SO2, O3 and NO2 show a reduction of 75%, 90 %
and 30% (in winter only for NO2) compared to outdoors. INDEX TERMS
Pollution transfer, Outdoor pollution, Chemical reactivity, Ventilation, Experimental survey. INTRODUCTION
In Paris like in other cities, people spend most of their time indoors and the relationships between outdoor and indoor urban air pollutant concentrations are more and more a subject of concern. Indeed outdoor air is essential to ventilate buildings but the parameters, which determine this transfer of outdoor pollutants into the building, are rarely well known. An experimental study has been conducted into an unoccupied dwelling in order to analyze the impact of ventilation strategies, seasons, effect of adsorptive surfaces and chemical reactions, on the indoor concentration of pollutants related to outdoor pollution.
METHODS
The dwelling chosen for the experimentation is located in a Paris area influenced by heavy traffic (close to a busy street and the ring road), providing significant levels of pollutants. Situated at the third floor of a 10-storied building built in 1955, the dwelling surface is about 55 square meters. During experiments, it was unoccupied and empty of furniture in order to minimize indoor pollutant sources.
At the initial state, the dwelling was naturally ventilated. Air renewal of the dwelling was thus controlled: the dwelling has been made airtight and the residual air leakage has been
characterized using blower door and tracer gas technique. A mechanical ventilation system has been installed to allow two different controlled extract flows. During the summer experiments, measurements have also been carried out with opened windows. Detailed information on ventilation aspects of the study has been published elsewhere (Collignan et al, 2001).
Preliminary measurements were performed to verify the absence of significant horizontal and vertical gradients for gaseous pollutants (NO, NO2, BTEX) and fine particles (PM2.5).
Two measurement campaigns were conducted, one in winter (January to March 2000), and one in summer (June to August 2000). The target pollutants have been chosen to be
representative of the mobile and fixed sources and of atmospheric photochemistry. The parameters of concern were carbon monoxide (CO), nitrogen monoxide (NO), nitrogen dioxide (NO2), ozone (O3 – only in summer), sulfur dioxide (SO2 - only in winter), PM2.5
particles, black smoke index (BS), temperature, humidity, wind velocity and direction. Some external and internal measurements of BTEX (benzene, toluene, ethylbenzene, xylenes) and TVOC (total volatile organic compounds) have also been realized on few days periods. The measurements were done continuously in the dwelling (living room and bedroom) and in the closely outdoor environment (balcony) (see picture of the dwelling in Figure 1). A
meteorological station has also been installed on the roof of the 10-storied building, in order to measure wind speed and direction, external and internal temperature and humidity. The sampling time steps were comprised between two minutes and one hour depending on pollutant.
For each campaign, different scenarii were tested including (1) ventilation rate at about 0.9 vol/h (2) ventilation rate at about 0.6 vol/h (3) introduction of sorbing material (acoustic tiles) in the bedroom and in the living room at two different loading rates. During the summer campaign, measurements were also conducted with two scenarii of opened windows: two slightly opened windows and one largely opened window.
Chambre Séjour Cuisine Entrée SdB WC Balcon Balcon Placards
Baie vitrée 1 Baie vitrée 2
B a ie v itr é e 3 B a ie v itr é e 4 Fe n ê tr e S d B 340 31 5 66 0 330 36 10 8 465 16 5 85 78 12 3 34 26 23 3 315 24 0 15 8 47 125 100 30 158 285 Sampling N °1 1.65m Sampling N °2 Inlet Sampling N °3 balcon Bedroom Living room Kitchen Bathroom Entrance Sampling N°4 1.65m
Figure 1: Dwelling description and sampling strategy RESULTS
Preliminary indoor measurements show that there are no significant differences of pollutant concentrations according to the sampling location inside the dwelling. Moreover, the
permeability level obtained once the dwelling has been made airtight (Q = 4.3∆P0.79 m3/h, Q:
buildings. The extraction mechanical ventilation has then been assessed using SF6 tracer gas technique. The controlled air exchange rates used for the experimental survey were 0.6 and 0.9 vol/h.
The range of the 24 hour mean values observed outdoors were:
During the summer campaign
CO: 0.2 – 0.8 mg.m3 NO: 2 – 42 µg.m3 NO
2: 24 – 86 µg.m3
O3: 1 – 53 µg.m3 PM2.5: 7 – 28 µg.m3 BS: <10 – 52 µg.m3
Benzene: 3 - 7µg.m3 Toluene: 16 – 44 µg.m3 TVOC: 114 – 300 µg.m3
During the winter campaign
CO: 0.5 – 1.8 mg.m3 NO: 6 - 180 µg.m3 NO2: 36 - 123 µg.m3
SO2 : 2 - 41 µg.m3 PM2.5 : 8 - 40 µg.m3 BS : <10 – 90 µg.m3
Benzene: 3 - 17µg.m3 Toluene: 11 – 70 µg.m3 TVOC: 60 – 249 µg.m3
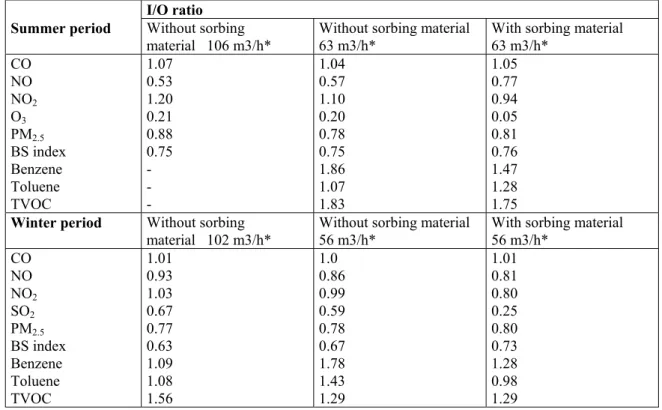
Table 1 gathers the values of the ratio Cind/Coutd (I/O) for the major pollutants according to the
controlled air exchange rate and the presence or not of the tested sorbing material. Table 1 : I/O ratio values in presence or absence of sorbing material
I/O ratio Summer period Without sorbing
material 106 m3/h*
Without sorbing material 63 m3/h*
With sorbing material 63 m3/h* CO NO NO2 O3 PM2.5 BS index Benzene Toluene TVOC 1.07 0.53 1.20 0.21 0.88 0.75 - - - 1.04 0.57 1.10 0.20 0.78 0.75 1.86 1.07 1.83 1.05 0.77 0.94 0.05 0.81 0.76 1.47 1.28 1.75
Winter period Without sorbing
material 102 m3/h* Without sorbing material 56 m3/h* With sorbing material 56 m3/h* CO NO NO2 SO2 PM2.5 BS index Benzene Toluene TVOC 1.01 0.93 1.03 0.67 0.77 0.63 1.09 1.08 1.56 1.0 0.86 0.99 0.59 0.78 0.67 1.78 1.43 1.29 1.01 0.81 0.80 0.25 0.80 0.73 1.28 0.98 1.29
* Measured air exchange rate; 56-63 m3/h: ~ 0.6 vol/h ; 102-106 m3/h : ~ 0.9 vol/h
Different behaviors have been observed between the target pollutants and the conditions tested.
Without introduction of sorbing material
♦
♦ CO is integrally transferred indoors regardless of seasons and ventilation rates. NO conc. are more reduced in summer than in winter. Indoor concentrations represent about 55% of the outdoor levels in summer while a loss of 7-14% is observed in winter.
♦ ♦
♦
♦ ♦
NO2 generally shows no apparent difference between outdoor and indoor daily
concentrations but the ratio Cind/Cout (I/O) can be significantly above one in summer
time.
For BTEX and TVOC, the I/O values are lightly higher indoors than outdoors likely due to the presence of sources inside the dwelling.
For SO2, measured only in winter, I/O values are lower than 1 for all tested conditions.
The I/O ratio is 0.7 for a 0.9 vol/h air exchange rate and 0.6 for 0.6 vol/h showing the impact of ventilation conditions on the transfer of SO2.
O3, measured only in summer, shows the highest change. So, a loss of about 80% of
the average daily concentration is observed indoors whatever the ventilation rate was. Particulate matters and BS index show an average daily indoor concentration reduction equal to 20-25% in reference to outdoor ones. Those results are not dependent on the season tested.
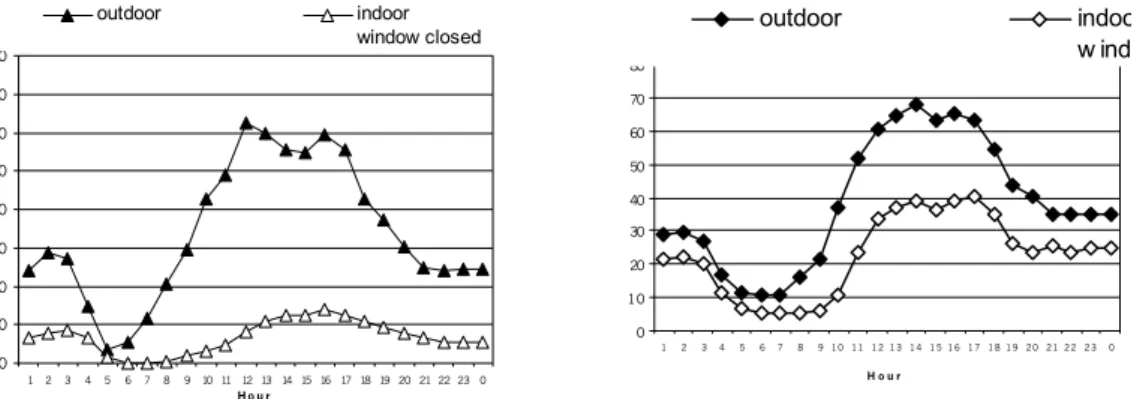
Simulation of human habits in summer related to the opening of windows has no incidence on the behavior of CO and NO2. On the contrary, the I/O ratio is increased for NO and O3.
Figure 2 illustrates evolution of mean hourly indoor concentrations in summertime referring to outdoors ones when the window is closed or opened.
0 10 20 30 40 50 60 70 80 1 2 3 4 5 6 7 8 9 10 11 12 13 14 15 16 17 18 19 20 21 22 23 0 H o u r outdoor indoor window closed 0 10 20 30 40 50 60 70 80 1 2 3 4 5 6 7 8 9 10 11 12 13 14 15 16 17 18 19 20 21 22 23 0 H o u r outdoor indoo w ind
Figure 2: Impact of opening the window on the indoor ozone concentrations (µg.m-3)
With introduction of sorbing material
♦ ♦ ♦
In this case, CO, NO and particles levels are not affected whatever the season and the air exchange rate were.
The behavior of NO2 is more particular. A decrease of the levels, about 30%, was only
noticed in winter.
For SO2 and O3, an average depletion of 75% and 90% respectively is observed when
the sorbing acoustic tiles are introduced in the room. The SO2 I/O values are shown in
Figure 3. 0,0 0,2 0,4 0,6 0,8 1,0 10/02/00 12/02/00 14/02/00 16/02/00 18/02/00 20/02/00 22/02/00 24/02/00 25/02/00 27/02/00 29/02/00 02/03/00 04/03/00 06/03/00 08/03/00 10/03/00 11/03/00 13/03/00 15/03/00 17/03/00 19/03/00
Whitout sorbing material
With sorbing material 60 tiles 30 tiles
DISCUSSION
For a non-reactive gas such as CO, the more the air renewal, the less the smooth and the delay between the outdoor and indoor pollution peak is observed. For the slightly opened windows case, the delay is less than half an hour and for the largely opened window case, outdoor and indoor concentrations are quite similar. For reactive gas as SO2 and O3, the more is the air
renewal, the less is the residence time of air from the outside. So, pollutant has less time to react indoors and the ratio I/O is higher.
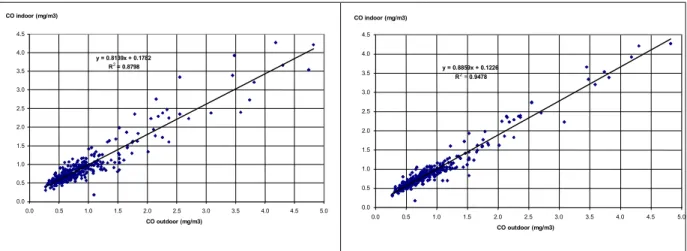
The results show a good correlation between hourly outdoor and indoor concentrations for all pollutants whatever the tested situation (different ventilation conditions or addition of sorbing material). The correlation coefficients are much higher for non-reactive pollutants such as CO (0.97 compared to 0.94) and PM2.5 (0.95 compared to 0.89) when a time difference is applied
between outdoor and indoor concentrations (Figure3).
y = 0.8139x + 0.1782 R2 = 0.8798 0.0 0.5 1.0 1.5 2.0 2.5 3.0 3.5 4.0 4.5 0.0 0.5 1.0 1.5 2.0 2.5 3.0 3.5 4.0 4.5 5.0 CO outdoor (mg/m3) CO indoor (mg/m3) y = 0.8859x + 0.1226 R2 = 0.9478 0.0 0.5 1.0 1.5 2.0 2.5 3.0 3.5 4.0 4.5 0.0 0.5 1.0 1.5 2.0 2.5 3.0 3.5 4.0 4.5 5.0 CO outdoor (mg/m3) CO indoor (mg/m3)
Figure 3 : Correlation between hourly CO indoor and outdoor concentration with (left side) and without (right side) time lag (February 25th– March 10th ; air exchange rate 0.64 vol/h)
The sorbing material introduced in the rooms was aimed to artificially increase the surface of the dwelling as regard its volume and to observe the impact of high specific surface material in the pollutants transfer. The tested sorbing material (acoustic tiles) has no effect on CO, NO, PM2.5 and black smokes index. On the contrary I/O ratios are significantly lower for SO2, O3
and to a lesser extend for NO2. Deposition velocities have been calculated for these pollutants
with or without sorbing materials respectively (0.9/0.2 m.h-1 for SO
2; 5/1.3 m.h-1 for O3; 0.1/0
m.h-1 for NO
2). The results are in agreement with published data except for NOx. For O3, a
recent paper (Weschler, 2000) shows that the half time of ozone indoors is determined primarily by surface removal and air exchange. In our study, with a surface-to-volume ratio equal to 2.0, the surface removal rate varies from 2.5 to 3.5 h-1 range in agreement with many other studies (Weschler, 1994, Lee 1999).
In our study, indoor NO2 levels are often higher than outdoors in both seasons. Reaction
between NO and O3 producing NO2 in excess can explain these high values and was observed
in other studies (Weschler, 1994; Drakou, 1998). Winter results concerning NO2 are more
surprising because O3 levels are generally low and the dwelling is located close to high traffic
roads. Generally, studies conducted with integrated passive samplers, which are not based on the same analytical principle, show lower ratio I/O (Levy, 1998) and further research is thus needed to explain this phenomena.
A mass balance model (Shair and Heitner, 1974) without chemical module, taking into account indoor sources, outdoor concentration, air exchange rate, ratio surface/volume of the room and deposition/sorption speed has been used and results have been compared to field’s measurements. Good agreement was found between the model and CO, SO2 and particles
measurements. O3, NO and NO2 shows discrepancies which confirm the chemical reactions
already discussed and the need to use models that accounts for gas-phase reactive chemistry (Nazaroff, 1986; Drakou 2000).
CONCLUSION
This experimental study is an original one in France. This work was conducted in an unoccupied and empty dwelling (in order to minimize indoor pollutant emissions) under controlled ventilation conditions. In addition, the measurements were performed during two seasons, summer and winter. Numerous urban pollutants were considered, most of them measured by mean of continuous monitoring. So, it was possible to calculate the mean daily ratios and to estimate the impact of peaks of pollution on the indoor air quality. The results are in good agreement with studies using similar measurement methods. Particularly, the results show that NO, NO2 and O3 interact also indoors. For these pollutants, chemical
reactivity has thus to be taken into account in indoor concentration predicting models. It is important to notice that the type of indoor surfaces has a great influence on the ratio I/O for O3 and SO2 and in a less extent for NO2. For non-reactive pollutants such as CO and BTEX,
the air exchange rate affects both the time difference between indoors and outdoors maximum concentrations and the indoor maximum values.
ACKNOWLEDGEMENTS
This work has been supported by CSTB, Association Claude Bernard and the French Agence de l’Environnement et de la Maîtrise de l’Energie (ADEME) through 98.04.051 grant. REFERENCES
Collignan B, Flori JP, Kirchner S et al. 2001. Experimental study on the impact of ventilation parameters on pollutants transfer from outdoor air into a dwelling. Proceedings of 22nd AIVC Conference, pp 42.1-42.10.Bath, UK.
Drakou G, Zerefos C, Ziomas I et al. 1998. Measurements and numeral simulations of indoor O3 and NOx in two different cases. Atmos. Environ. Vol.32, pp595-610.
Drakou G, Zerefos C and Ziomas I. 2000. A sensitivity study of parameters in the Nazaroff-Cass IAQ model with respect to indoor concentrations of O3, NO, NO2. Environ. Technol.
Vol.22, pp 483-503.
Lee K, Vallarino J, Dumyahn T et al. 1999. Ozone decay rates in residences. J. Air Waste Manag. Assoc. Vol. 49, pp 1238-1244.
Levy JI et al. 1998. Impact of residential nitrogen dioxide exposure on personal exposure: an international study. J Air & Waste Manage Assoc. Vol. 48, pp 553- 560.
Nazaroff WW and Cass GR. 1986. Mathematical modeling of chemically reactive pollutants in indoor air. Environ. Sci. Technol. Vol. 20 ; 9, pp 924-934.
Shair FH and Heitner KL. 1974. Theoretical model for relating indoor pollutant concentrations to those outside, Environ. Sci. Technol. Vol. 8, pp 444-451.
Weschler CJ, Shields HC and Naik DV. 1994. Indoor chemistry involving O3, NO and NO2 as
evidence by 14 months of measurements at a site in southern California. Environ. Sci. Technol. Vol. 28, pp 2120-2132.
Weschler CJ. 2000. Ozone in indoor environments: concentration and chemistry. Indoor Air. Vol. 10, pp 269 -288.