S-1
Supporting Information
Phase Transformation of Superparamagnetic Iron Oxide
Nanoparticles via Thermal Annealing: Implications for
Hyperthermia Applications
Federica Crippa,
1Laura Rodriguez-Lorenzo,
1,2Xiao Hua,
1Bart Goris,
3Sara Bals,
3José S.
Garitaonandia,
4Sandor Balog,
1David Burnand,
1,5Ann M. Hirt,
6Laetitia Haeni,
1Marco
Lattuada,
5Barbara Rothen-Rutishauser
1and Alke Petri-Fink
*1,5.
1
Adolphe Merkle Institute, University of Fribourg, Fribourg, Switzerland
2
Water4Environment Unit, International Iberian Nanotechnology Laboratory, Braga, Portugal
3Electron Microscopy for Materials Research, University of Antwerp, Antwerp, Belgium
4Zientzia eta Teknologia Fakultatea. Euskal Herriko Unibertsitatea, Bilbao, Spain
5
Chemistry Department, University of Fribourg, Fribourg, Switzerland
6Institute for Geophysics, ETH Zurich, Zurich, Switzerland.
S-2
Nanoparticles characterization
TEM micrographs of oleic acid coated SPIONs
Figure S1 TEM micrographs of 10-OA (1) and 20-OA (2) and their respective size distributions (3). Size distribution has been estimated via particle analysis software and interpolated with the Gaussian distribution (number of particles measured > 1200). Scale bar: 100 nm.
DLS. ζ-potential and XRD
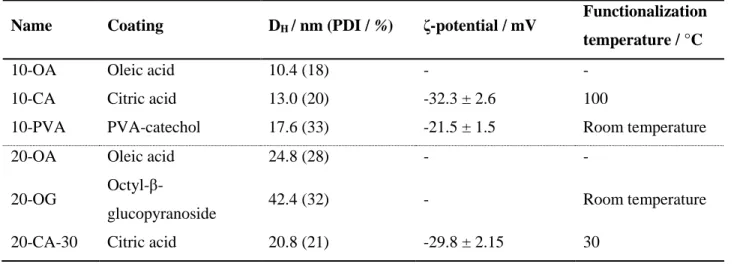
Table S.1 Summary of the synthesized and functionalized particles’ parameters.
Name Coating DH / nm (PDI / %) ζ-potential / mV
Functionalization temperature / °C
10-OA Oleic acid 10.4 (18) - -
10-CA Citric acid 13.0 (20) -32.3 ± 2.6 100
10-PVA PVA-catechol 17.6 (33) -21.5 ± 1.5 Room temperature
20-OA Oleic acid 24.8 (28) - -
20-OG
Octyl-β-glucopyranoside 42.4 (32) - Room temperature
S-3 The success of PVAcatechol functionalization on 10CA and 20CA particles is verified with DLS and ζ -potential analysis. In both cases the hydrodynamic diameter is found to be larger upon functionalization and the increase the ζ-potential is associated with the presence of the polymeric shell on the SPIONs surface.
Table S.2 Summary of estimated crystalline sizes obtained from XRD by Scherrer formula
The nanoparticle sizes were evaluated using the peak widths of the XRD reflections via Scherrer formula. Since the here presented SPIONs are highly monodisperse (< 10% size difference), the particle size estimated by TEM and average crystalline size estimated by XRD should be comparable.[1] This observation
applies for 10 nm particles. However, for 20 nm particles, the crystalline sizes are consistently smaller than the sizes obtained via TEM were obtained. This discrepancy suggests the presence of strain in the crystalline structure which contributes to the XRD peak broadening, particularly in the 20 nm particles dominated by Fe3O4. This leads to a general underestimation of the nanoparticle size if the strain contribution is neglected
using Scherrer formula.
20-CA-50 Citric acid 21.6 (26) -46.4 ± 1.6 50
20-CA-70 Citric acid 20.4 (22) -23.9 ± 1.0 70
20-CA Citric acid 23.2 (18) -40.9 ± 1.4 100
20-PVA PVA-catechol 28.8 (21) -19.1 ± 1.5 Room temperature
Name D_FeO/ nm D_Fe3O4/ nm D_FeO/Fe3O4 / nm
10-OA / 7.2 7.2 10-CA / 6.9 6.9 10-PVA / 7.2 7.2 20-OA 10.8 4.1 14.9 20-OG 10.6 3.1 13.7 20-CA-30 10.3 4.4 14.7 20-CA-50 10.1 5.0 15.1 20-CA-70 8.4 7.5 15.9 20-CA / 13.5 13.5 20-PVA / 12.6 12.6
S-4
Mössbauer spectroscopy
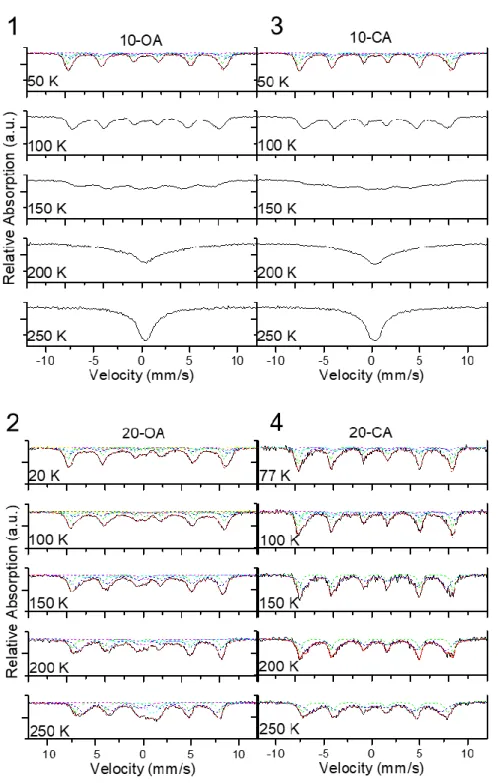
Figure S2 57Fe-Mössbauer spectra of the SPIONs samples coated with oleic acid (OA) and citric acid (CA)
at different temperatures. For a better comparison all the spectra were normalized to present the same area. Experimental Mössbauer spectra (black solid line) of: (1) 10-OA at 55 K, (3)10-CA at 55 K and (4) 20-CA at 77 K and 100 K decomposed into four sextets for the magnetite by the fit (red dashed line; see text for
S-5 the details). The green dashed lines denotes the sextet corresponding to the group of Fe A site ions (8xFe+3),
while the blue (8xFe+3), cyan (5xFe+2) and magenta (3xFe+2) dashed lines indicate the three sextets
representing the three groups of Fe B site ions identified in Ref. [2]; and (4) 20-CA at 150, 200, 250 K decomposed into two sextets describing the Fe3+ A sites (green dashed line) and the Fe2+/3+ B sites (blue
dashed line) of the magnetite. In the case of experimental Mössbauer spectra (black solid line) of (3) 20-OA indicate that the samples are composed of different magnetic phases (see details in the text). The experimental Mössbauer spectra of 20-OA at 150, 200 and 250 K were fitted properly with four components, i.e. two sextets describing the Fe3+ A sites (green dashed line) and the Fe2+/3+ B sites (blue dashed line) of
the magnetite and two doublets describing the contribution of the Fe+2 (cyan dashed line) and Fe+3 (magenta
dashed line) of the wüstite phase. At 100 K and 20 K, the experimental spectra fitted better with six components, i.e. one sextet describing the group of Fe A site ions ( green dashed line, 8xFe+3) and three
sextes describing the tree groups of Fe B sites ions (blue (8xFe+3), cyan (5xFe+2) and magenta (3xFe+2)
dashed lines) of the magnetite and two doublets describing the contribution of the Fe+2 (yellow dashed line)
and Fe+3 (dark yellow dashed line) of the wüstite phase Redistribution of the line intensities on 20nm
SPIONs undergo a Verwey transition by 100 K. 20-OA sample shows two phases clearly: one was identified as magnetite and the other phase with a Curie temperature of 200-210 K as wüstite. At 100, the percentage of this phase, estimated using the spectrum at 250 K, was ca. 20 % of Fe total, which is in reasonable agreement with the obtained via XRD.
Mössbauer analysis
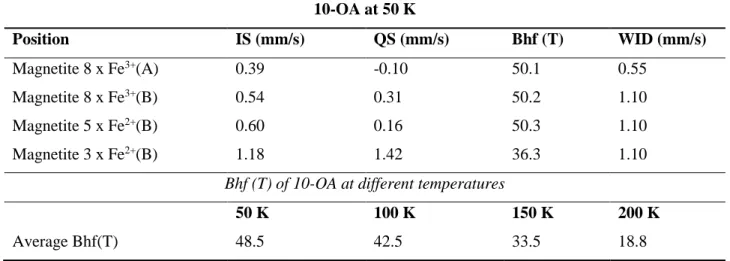
Table S.3 Hyperfine parameter for 10-OA obtained following the model developed by Reznicek et al.[2]
10-OA at 50 K Position IS (mm/s) QS (mm/s) Bhf (T) WID (mm/s) Magnetite 8 x Fe3+(A) 0.39 -0.10 50.1 0.55 Magnetite 8 x Fe3+(B) 0.54 0.31 50.2 1.10 Magnetite 5 x Fe2+(B) 0.60 0.16 50.3 1.10 Magnetite 3 x Fe2+(B) 1.18 1.42 36.3 1.10
Bhf (T) of 10-OA at different temperatures
50 K 100 K 150 K 200 K
S-6 Table S.4 Hyperfine parameter for 20-OA obtained following the model developed by Reznicek et al.[2]
20-OA at 20 K
Position IS (mm/s) QS (mm/s) Bhf (T) WID (mm/s) %Fe
Magnetite 8 x Fe3+(A) 0.40 -0.18 50.6 0.55 27.9 Magnetite 8 x Fe3+(B) 0.47 0.34 50.8 1.10 27.9 Magnetite 5 x Fe2+(B) 0.82 -0.36 51.1 1.10 17.5 Magnetite 3 x Fe2+(B) 1.80 0.93 38.3 1.10 10.5 Wüstite (1) 0.76 -0.42 42.7 1.49 13.9 Wüstite (2) 0.02 0.6 0.47 2.3 20-OA at 100 K
Position IS (mm/s) QS (mm/s) Bhf (T) WID (mm/s) %Fe
Magnetite 8 x Fe3+(A) 0.47 -0.13 50.0 0.59 27.2 Magnetite 8 x Fe3+(B) 0.51 0.46 49.2 1.18 27.2 Magnetite 5 x Fe2+(B) 0.65 -0.61 48.3 1.18 17.0 Magnetite 3 x Fe2+(B) 1.79 0.80 36.3 1.18 10.2 Wüstite (1) 0.32 -0.54 42.1 1.47 14.4 Wüstite (2) 0.15 0.4 0.52 3.9 20-OA at 150 K
Position IS (mm/s) QS (mm/s) Bhf (T) WID (mm/s) %Fe
Magnetite 1 x Fe3+(A) 0.43 0.01 49.5 0.60 26.7
Magnetite 2 x Fe2+Fe3+(B) 0.63 -0.14 47.1 1.10 53.4
Wüstite (1) 0.17 -0.23 38.3 1.42 14.6
Wüstite (2) 0.10 0.60 0.65 5.3
20-OA at 200 K
Position IS (mm/s) QS (mm/s) Bhf (T) WID (mm/s) %Fe
Magnetite 1 x Fe3+(A) 0.43 0.02 48.5 0.60 26.5
Magnetite 2 x Fe2+Fe3+(B) 0.66 -0.02 45.4 1.05 53.0
Wüstite (1) 0.96 -0.17 21.4 1.05 13.9
Wüstite (2) 0.15 0.59 0.70 6.6
20-OA at 250 K
Position IS (mm/s) QS (mm/s) Bhf (T) WID (mm/s) %Fe
Magnetite 1 x Fe3+(A) 0.49 0.00 46.6 0.60 27.1
S-7 Table S.5 Hyperfine parameter for 10-CA at 50 K obtained following the model developed by Reznicek et al.[2]
Table S.6 Hyperfine parameter for 20-CA obtained following the model developed by Reznicek et al.[2]
Wüstite (1) 1.01 0.60 0.70 12.0
Wüstite (2) 0.05 0.59 0.70 6.7
Bhf (T) of 20-OA at different temperatures
20 K 100 K 150 K 200 K 250 K Average Bhf(T) 47.2 45.0 44.0 39.9 35.8 10-CA at 50 K Position IS (mm/s) QS (mm/s) Bhf (T) WID (mm/s) Magnetite 8 x Fe3+(A) 0.35 -0.17 49.0 0.50 Magnetite 8 x Fe3+(B) 0.53 0.24 49.2 1.00 Magnetite 5 x Fe2+(B) 0.54 0.32 48.9 1.10 Magnetite 3 x Fe2+(B) 1.24 1.10 35.2 1.10
Bhf (T) of 10-CA at different temperatures
50 K 100 K 150 K 200 K
Average Bhf(T) 47.3 40.7 30.0 14.5
20-CA at 77 K
Position IS (mm/s) QS (mm/s) Bhf (T) WID (mm/s) %Fe
Magnetite 8 x Fe3+(A) 0.36 -0.04 49.7 0.46 33.33
Magnetite 8 x Fe3+(B) 0.59 0.40 48.5 0.92 33.33
Magnetite 5 x Fe2+(B) 0.40 -0.72 47.1 0.92 20.83
Magnetite 3 x Fe2+(B) 1.31 1.18 38.1 0.92 12.5
20-CA at 100 K
Position IS (mm/s) QS (mm/s) Bhf (T) WID (mm/s) %Fe
Magnetite 8 x Fe3+(A) 0.27 -0.04 49.9 0.46 33.33
Magnetite 8 x Fe3+(B) 0.58 0.42 48.5 0.92 33.33
Magnetite 5 x Fe2+(B) 0.27 -0.36 46.4 0.92 20.83
Magnetite 3 x Fe2+(B) 1.61 1.20 35.4 0.92 12.5
S-8 10-OA and 10-CA SPIONs: At 50 K, the Mössbauer spectrum of 10-OA presents a magnetic profile expected from a sample with different non-equivalent magnetic Fe sites, i.e. a sum of different sextets with different intensities. This magnetic sextet contributions become wider with increasing temperature, until collapsing to one contribution at temperatures above 150 K. 10-OA is in a superparamagnetic regime at this blocking temperature (TB= 150K). To confirm that the phase is magnetite, the fitting assignments proposed
by the model described by Reznicek et al.[2] based on density functional theory calculations were applied .
The model reduces the spectrum four sextets with related occupations and line broadenings among them. The fitting and the hyperfine parameters obtained after the refinement are consistent with a magnetite phase and in agreement with those reported previously.[2]
20-OA SPIONs: Its Mössbauer spectra at lowest temperatures show a magnetic background, which cannot be resolved even at temperatures as low as 20 K. This indicates that the samples are composed of different magnetic phases. At 200 K, a slight change in the spectral profile (an apparent broadening of the sextets) is observed. The spectrum at 250 K is paramagnetic and the spin relaxation by superparamagnetic effects is evident only at room temperature. The Mössbauer spectrum at 250 K was fitted properly with four components, i.e. two sextets and two doublets. Hyperfine parameters are compatible to the Fe3+ A sites and
the Fe2+/3+ B sites of the inverse spinel structure of the magnetite, respectively, above the Verwey transition
(TV).[3] In order to simplify the interpretation of the fitting results, a 1:2 theoretical population ratio was
fixed for these contributions. The two doublets display very different isomer shifts, which can be attributed to the contribution of the Fe2+ and Fe3+ of the wüstite phase to the spectrum.[4,5] At 200 K, close to T
N of the
wüstite, the Mössbauer spectrum can be fitted satisfactorily as one of the doublets is substituted by a very broad magnetic sextet with a hyperfine field of around 20 T. The marked magnetic behaviour of wüstite at this temperature could be interpreted as the consequence of the exchange coupling between magnetite and wüstite. At 100 K and at lower temperatures, the experimental spectra fitted better when the spectral
Position IS (mm/s) QS (mm/s) Bhf (T) WID (mm/s) %Fe
Magnetite 1 x Fe3+(A) 0.39 0.07 49.5 0.44 33.33
Magnetite 2 x Fe2+Fe3+(B) 0.40 -0.11 46.3 1.07 66.66
20-CA at 200 K
Position IS (mm/s) QS (mm/s) Bhf (T) WID (mm/s) %Fe
Magnetite 1 x Fe3+(A) 0.37 0.01 48.7 0.57 33.33
Magnetite 2 x Fe2+Fe3+(B) 0.49 -0.13 43.9 1.06 66.66
20-CA at 250 K
Position IS (mm/s) QS (mm/s) Bhf (T) WID (mm/s) %Fe
Magnetite 1 x Fe3+(A) 0.32 0.00 46.9 0.67 33.33
Magnetite 2 x Fe2+Fe3+(B) 0.40 -0.05 42.3 1.55 66.66
Bhf (T) of 20-CA at different temperatures
77 K 100 K 150 K 200 K 250 K
S-9 contribution of the magnetite was described by the four sets of sub-spectra proposed by the model described by Reznicek et al. below TN[2] as in the case of 10-OA and 10-CA plus to a broad magnetic sextet and
doublet. As the temperature decreased, the hyperfine magnetic field of the broad magnetic sextet describing the wüstite increased and the intensity of the remanent doublet decreased. This residual doublet could be due to the smallest superparamagnetic wüstite cores.
20-CA SPIONs: The evolution of the Mössbauer spectra does not show evidence of presence of any additional contribution but magnetite. The spectra obtained at temperatures below TV were satisfactorily
fitted following the four sextets model described by Reznicek et al. [2]. For spectra obtained at temperatures
above TV, two sextets describing the Fe3+ A sites and the Fe2+/3+ B sites of the magnetite were used. The
hyperfine parameters obtained after refinement are similar to those obtained for magnetite phase in the 20-OA SPIONs sample.
1
H NMR spectroscopy
Figure S3 1H NMR spectra of catechol-PVA-phthalimide 5 kDa (top, in blue) and of the phthalimide
S-10
TEM micrographs of functionalized SPIONs
Figure S4 TEM micrographs of 10 nm SPIONs coated with CA and PVA-catechol. Scale bar: 100 nm.
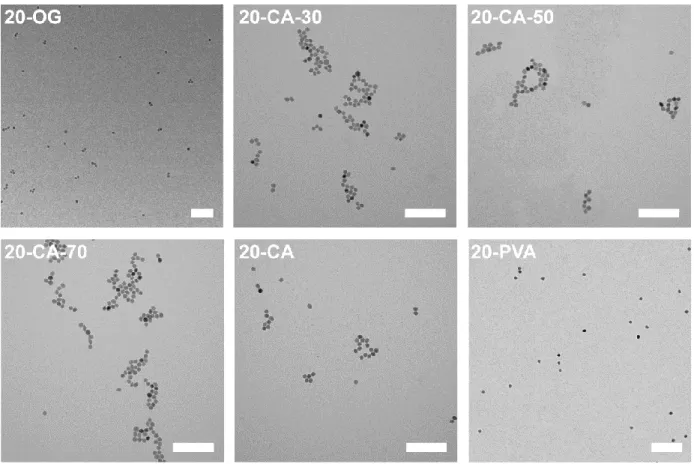
Figure S5 TEM micrographs of 20 nm SPIONs coated with OG, CA at different temperatures and PVA-catechol. Scale bar: 200 nm.
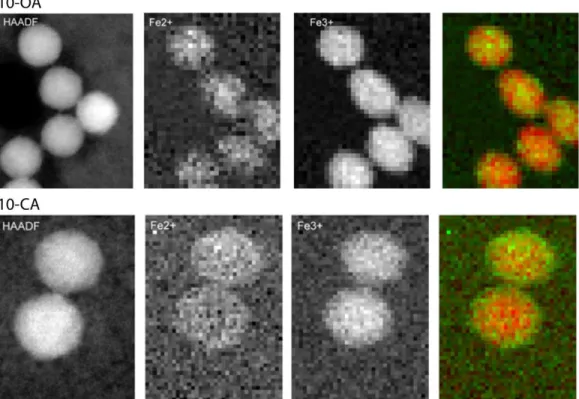
S-11 Figure S6 HAADF-STEM and EELS measurements of 10-OA and 10-CA samples indicating the presence of Fe2+ (green) and Fe3+ (red) in the entire nanoparticle.
XRD
Figure S7 XRD characterization of 20-OA SPIONs oxidized at 100°C without citric acid. The analysis revealed that the particles were fully oxidized to magnetite even in absence of citric acid.
S-12
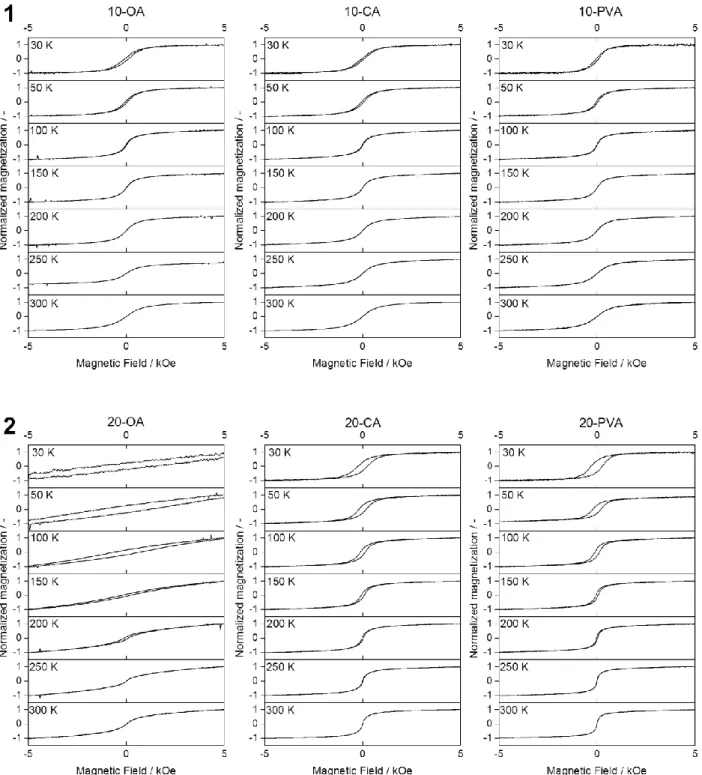
Magnetic hysteresis of SPIONs
Figure S8 Magnetic hysteresis curves of 10-OA, 10-CA, 10-PVA (1) and 20-OA, 20-CA and 20-PVA at different temperatures.
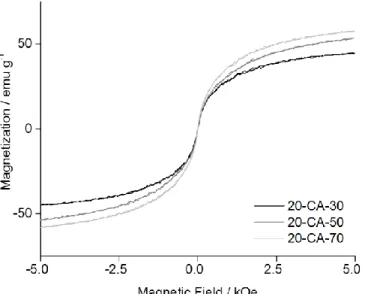
S-13 Figure S9 Magnetic hysteresis analysis at 300K on 20 nm SPIONs functionalized with citric acid at 30, 50 and 70°C.
DLS on SPIONs in complete cell culture media
Figure S10 The intensity-weighted hydrodynamic diameters of 20-CA and 20-PVA in complete DMEM media are recorded for 24 hours (5 measurements of 60 sec each every 60 mins). To calculate dimensions of nanoparticles the obtained correlation functions were analyzed with a customized script in Mathematica (Version 10.1, Wolfram Research Inc). The script was designed similarly to the method proposed by Mohr et al.[6] and allows the subtraction of the scattering originating from the medium itself. As shown in the
chart, 20-CA immediately aggregated showing large diameters and after 24 hours sediments partially (right, sedimentation can be seen at the bottom of the cuvette containing the 20-CA sample). On the contrary, the diameters of 20-PVA were stable during the entire measurement and did not sediment.
S-14
References
(1) H. Borchert, E. V. Shevchenko, A. Robert, I. Mekis, A. Kornowski, G. Grübel, H. Weller, Langmuir 2005, 21, 1931 – 1926
(2) R. Řezníček, V. Chlan, H. Štěpánková, P. Novák, J. Zukrowski, A. Kozłowski, Z. Kakol, Z. Tarnawski, J. M. Honig, Phys. Rev. B 2017, 96, DOI 10.1103/PhysRevB.96.195124.
(3) I. Dezsi, C. Fetzer, Á. Gombköto, I. Szucs, J. Gubicza, T. Ungár, J. Appl. Phys. 2008, 103, 104312. (4) M. Gheisari, M. Mozafari, M. Niyaifar, J. Amighian, R. Soleimani, J. Supercond. Nov. Magn. 2013, 26, 237–242.
(5) D. Dimitrov, K. Unruh, Phys. Rev. B 1999, 59, 499–504.
(6) K. Mohr, S.S. Müller, L.K. Müller, K. Rusitzka, S. Gietzen, H. Frey, M. Schmidt, Langmuir 2014, 30, 14954-14962.