Activation of proto-oncogenes by
disruption of chromosome neighborhoods
The MIT Faculty has made this article openly available.
Please share
how this access benefits you. Your story matters.
Citation
Hnisz, D. et al. “Activation of Proto-Oncogenes by Disruption of
Chromosome Neighborhoods.” Science 351.6280 (2016): 1454–1458.
As Published
http://dx.doi.org/10.1126/science.aad9024
Publisher
American Association for the Advancement of Science (AAAS)
Version
Author's final manuscript
Citable link
http://hdl.handle.net/1721.1/106605
Terms of Use
Article is made available in accordance with the publisher's
policy and may be subject to US copyright law. Please refer to the
publisher's site for terms of use.
Activation of proto-oncogenes by disruption of chromosome
neighborhoods
Denes Hnisz#1, Abraham S. Weintraub#1,2, Daniel S. Day1, Anne-Laure Valton3, Rasmus O. Bak4, Charles H. Li1,2, Johanna Goldmann1, Bryan R. Lajoie3, Zi Peng Fan1,5, Alla A.
Sigova1, Jessica Reddy1,2, Diego Borges-Rivera1,2, Tong Ihn Lee1, Rudolf Jaenisch1,2, Matthew H. Porteus4, Job Dekker3,6, and Richard A. Young1,2,*
1 Whitehead Institute for Biomedical Research, 9 Cambridge Center, Cambridge, MA 02142, USA 2 Department of Biology, Massachusetts Institute of Technology, Cambridge, MA, 02139, USA 3 Program in Systems Biology, Department of Biochemistry and Molecular Pharmacology,
University of Massachusetts Medical School, Worcester, MA 01605-0103, USA
4 Department of Pediatrics, Stanford University, Stanford, California, USA
5 Computational and Systems Biology Program, Massachusetts Institute of Technology,
Cambridge, MA, 02139, USA
6 Howard Hughes Medical Institute
# These authors contributed equally to this work.
Abstract
Oncogenes are activated through well-known chromosomal alterations, including gene fusion, translocation and focal amplification. Recent evidence that the control of key genes depends on chromosome structures called insulated neighborhoods led us to investigate whether proto-oncogenes occur within these structures and if oncogene activation can occur via disruption of insulated neighborhood boundaries in cancer cells. We mapped insulated neighborhoods in T-cell acute lymphoblastic leukemia (T-ALL), and found that tumor cell genomes contain recurrent microdeletions that eliminate the boundary sites of insulated neighborhoods containing prominent T-ALL proto-oncogenes. Perturbation of such boundaries in non-malignant cells was sufficient to activate proto-oncogenes. Mutations affecting chromosome neighborhood boundaries were found in many types of cancer. Thus, oncogene activation can occur via genetic alterations that disrupt insulated neighborhoods in malignant cells.
Graphical Abstract
One Sentence SummaryProto-oncogenes can be activated by genetic alterations that disrupt 3D chromosome structure.
HHS Public Access
Author manuscript
Science
. Author manuscript; available in PMC 2016 September 25. Published in final edited form as:Science. 2016 March 25; 351(6280): 1454–1458. doi:10.1126/science.aad9024.
A
uthor Man
uscr
ipt
A
uthor Man
uscr
ipt
A
uthor Man
uscr
ipt
A
uthor Man
uscr
ipt
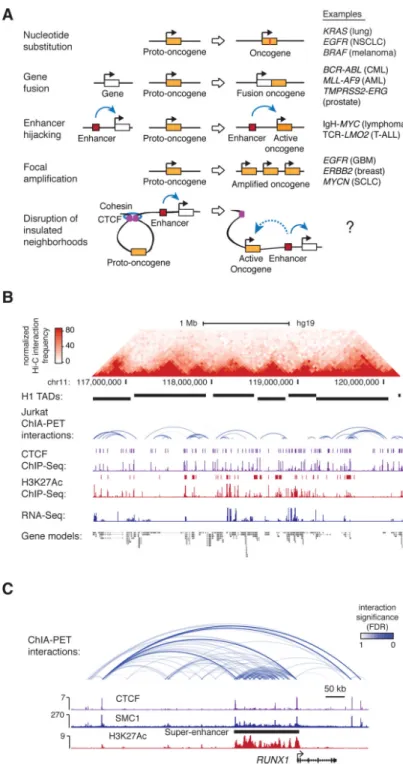
Tumor cell gene expression programs are typically driven by somatic mutations that alter the coding sequence or expression of proto-oncogenes (1) (Fig. 1A), and identifying such mutations in patient genomes is a major goal of cancer genomics (2, 3). Dysregulation of proto-oncogenes frequently involves mutations that bring transcriptional enhancers into proximity of these genes (4). Transcriptional enhancers normally interact with their target genes through the formation of DNA loops (5-7), which typically are constrained within larger CTCF-cohesin mediated loops called insulated neighborhoods (8-10), which in turn can form clusters that contribute to topologically associating domains (TADs) (11, 12) (Fig. S1A). This recent understanding of chromosome structure led us to hypothesize that silent proto-oncogenes located within insulated neighborhoods might be activated in cancer cells via loss of an insulated neighborhood boundary, with consequent aberrant activation by enhancers that are normally located outside the neighborhood (Fig. 1A, lowest panel). To test this hypothesis, we first mapped neighborhoods and other cis-regulatory interactions in a cancer cell genome using Chromatin Interaction Analysis by Paired-End Tag
Sequencing (ChIA-PET) (Fig. 1B, Table S1). A T-cell acute lymphoblastic leukemia (T-ALL) cell (Jurkat) was selected for these studies because key T-ALL oncogenes and genetic alterations are well-known (13, 14). The ChIA-PET technique generates a high-resolution (~5kb) chromatin interaction map of sites in the genome bound by a specific protein factor (8, 15, 16). Cohesin was selected as the target protein because it is involved in both CTCF-CTCF interactions and enhancer-promoter interactions (5-7), and has proven useful for identifying insulated neighborhoods (8, 10) (Fig S1A-B). The cohesin ChIA-PET data were processed using multiple analytical approaches (Fig. S1-4, Table S2) and identified 9,757 high-confidence interactions, including 9,038 CTCF-CTCF interactions and 379 enhancer-promoter interactions (Fig. S4C). The CTCF-CTCF loops had a median length of 270 kb, contained on average 2-3 genes and covered ~52% of the genome (Table S2). Such CTCF-CTCF loops have been called insulated neighborhoods because disruption of either CTCF-CTCF boundary causes dysregulation of local genes due to inappropriate enhancer-promoter interactions (8, 10). Consistent with this, the Jurkat chromosome structure data showed that the majority of cohesin-associated enhancer-promoter interactions had endpoints that occurred within the CTCF-CTCF loops (Fig. 1C, S2H). These results provide an initial map of the 3D regulatory landscape of a tumor cell genome.
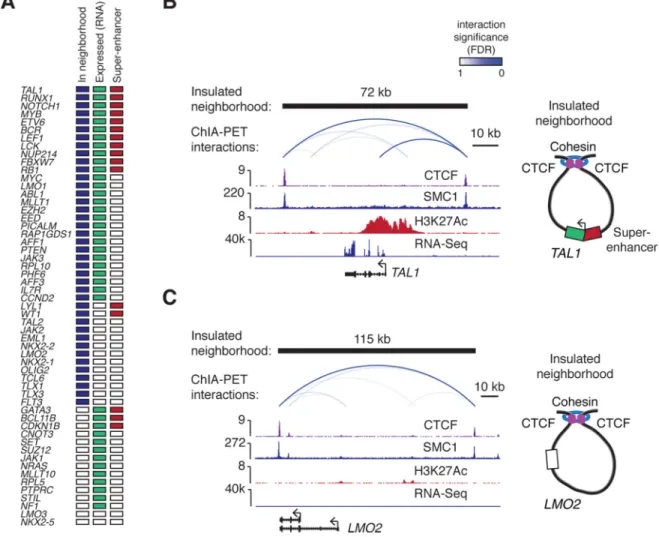
We next investigated the relationship between genes that have been implicated in T-ALL pathogenesis and the insulated neighborhoods. The majority of genes (40/55) implicated in TALL pathogenesis (curated from the Cancer Gene Census and individual studies)(Table S3) were located within the insulated neighborhoods identified in Jurkat cells (Fig. 2A, S5); 27 of these genes were transcriptionally active and 13 were silent based on RNA-Seq data (Fig. 2A, Table S4). Active oncogenes are often associated with super-enhancers (17, 18), and we found that 13 of the 27 active T-ALL Pathogenesis Genes associated with super-enhancers (Fig. 2A-B, S5A). Silent genes have also been shown to be protected by insulated
neighborhoods from active enhancers located outside the neighborhood, and we found multiple instances of silent proto-oncogenes located within CTCF-CTCF loop structures in the Jurkat genome (Fig. 2A, 2C, Fig. S5B). Thus, both active oncogenes and silent proto-oncogenes are located within insulated neighborhoods in these T-ALL cells.
A
uthor Man
uscr
ipt
A
uthor Man
uscr
ipt
A
uthor Man
uscr
ipt
A
uthor Man
uscr
ipt
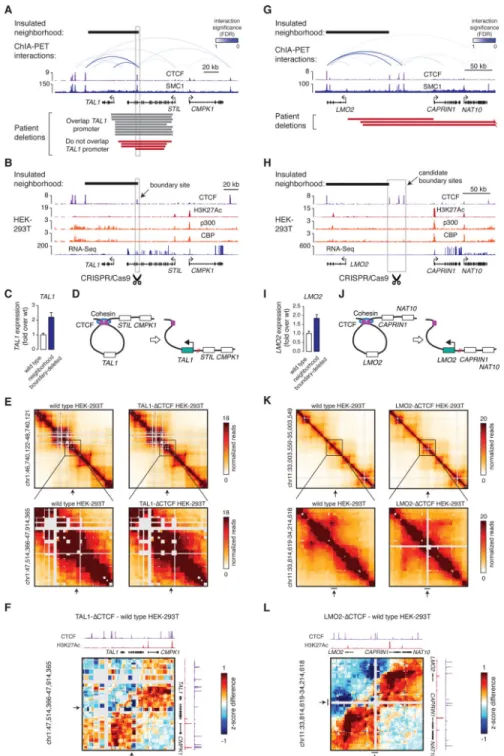
If some insulated neighborhoods function to prevent proto-oncogene activation, some T-ALL tumor cells may have genetic alterations that perturb the CTCF boundaries of neighborhoods containing T-ALL oncogenes. To investigate this possibility, we identified recurrent deletions in T-ALL genomes that span insulated neighborhood boundaries using data from multiple studies (Table S5A) and filtered for relatively short deletions (<500 kb) in order to minimize collection of deletions that affect multiple genes (Fig. S6A). Among the 438 recurrent deletions identified with this approach, 113 overlapped at least one boundary of insulated neighborhoods identified in T-ALL, and 6 of these affected neighborhoods containing T-ALL Pathogenesis Genes (Fig. S6B, Table S5B). Examples of two such genes, TAL1 and LMO2, are shown in Fig. 3A and Fig. 3G.
If deletions overlapping neighborhood boundaries can cause activation of proto-oncogenes within the loops, then site-specific deletion of a loop boundary CTCF site at the TAL1 locus should be sufficient to activate these proto-oncogenes in non-malignant cells. TAL1 encodes a transcription factor that is overexpressed in ~50% of T-ALL cases and is a key oncogenic driver of this cancer (19, 20). TAL1 can be activated by deletions that fuse a promoter-less TAL1 gene to the promoter of STIL (19) and this was observed in many patient deletions (Fig. 3A). Several patient deletions, however, retained the TAL1 promoter (endpoint >5kb from promoter) but overlapped the CTCF boundary site of the TAL1 neighborhood (Fig. 3A), and TAL1 was active in the samples harboring these deletions (Fig. S7A-B). This suggests disruption of the insulated neighborhood, allowing activation of TAL1 by regulatory elements outside of the loop. We tested this idea by CRISPR/Cas9 mediated deletion of the TAL1 neighborhood boundary in human embryonic kidney cells (HEK-293T) (Fig. 3B). In these cells, the TAL1 proto-oncogene is silent as evidenced by low H3K27Ac occupancy and RNA-Seq (Fig. 3B). However, at least one active regulatory element occurs ~60kb upstream of TAL1, adjacent to the CMPK1 promoter, as evidenced by high levels of H3K27Ac and p300/CBP (Fig. 3B) and enhancer reporter assays (Fig. S8A-B). Deletion of a ~400 bp segment encompassing the boundary CTCF site, which abolished CTCF binding (Fig. S8A), caused a 2.3-fold induction of the TAL1 transcript (Fig. 3C), suggesting that the integrity of the neighborhood contributes to the silent state of TAL1 (Fig. 3D). Supporting this model, contacts between DNA regions that are normally within and outside of the neighborhood were increased (Fig. 3E-F, S10). Furthermore, deletion of the CTCF site in primary human T-cells also caused a small but detectable activation of TAL1 (Fig. S8C-G). These results are consistent with the model that the silent state of the TAL1 proto-oncogene is dependent on the integrity of the insulated neighborhood (Fig. 3D).
We further tested the model that site-specific perturbation of a loop boundary is sufficient to activate a proto-oncogene at the LMO2 locus. The LMO2 gene encodes a transcription factor that is overexpressed and oncogenic in some forms of T-ALL (14, 20). The region upstream of the LMO2 promoter is recurrently deleted in T-ALL and these deletions are linked to LMO2 activation (Fig. 3G); a previous study proposed that deletion of cryptic repressors located in the deleted region enable activation of LMO2 (21). Analysis of a T-ALL patient cohort (22) revealed deletions that overlap the CTCF boundary site of the LMO2 neighborhood, and that patient cells harboring these deletions had generally high levels of LMO2 expression (Fig. S9A-B). CRISPR/Cas9-mediated deletion in HEK-293T cells of a ~25 kb segment encompassing the insulated neighborhood boundary CTCF site
A
uthor Man
uscr
ipt
A
uthor Man
uscr
ipt
A
uthor Man
uscr
ipt
A
uthor Man
uscr
ipt
and two additional CTCF sites that could act as boundary elements, caused a 2-fold increase in the LMO2 transcript (Fig. 3H-J), and a large-scale rearrangement of interactions around LMO2 as evidenced by 5C analysis (Fig. 3K-L, S10). These results indicate that the deleted CTCF sites contribute to the silent state of the LMO2 proto-oncogene (Fig. 3J).
The boundaries of chromosome neighborhoods may be disrupted in other cancers. A recent study noted that mutations in CTCF binding sites occur frequently in cancers (23), but it is unclear if mutations in boundaries are common as only a subset of CTCF sites form
insulated neighborhoods (8, 10, 24). CTCF-cohesin bound loops are largely preserved across cell types (8, 9, 24), and a set of ~10,000 constitutive CTCF-CTCF loops shared by
GM12878 lymphoblastoid, Jurkat cells and K562 CML cells (24) were identified for comparison (Fig. 4A, S11, Table S8). The boundaries of these neighborhoods were examined for somatic point mutations found in cancer genomes using the ICGC database containing data for ~50 cancer types, ~2300 WGS samples, and ~13 million unique somatic mutations (Table S9). We found a striking enrichment of mutations at the CTCF boundaries of constitutive neighborhoods (Fig. 4B, S12A, Table S10) compared to regions flanking the boundary CTCF sites (+/−1kb of the CTCF binding motif; P<10−4, permutation test (Fig. S12B), and in many instances these created a significant change in the consensus CTCF binding motif (Fig. S12C). Non-boundary CTCF sites did not show such enrichment (Fig. 4B, S12D, S14). The genomes of esophageal and liver carcinoma samples were particularly enriched for boundary CTCF site mutations (Fig. 4C-D, S12D-E, S13, Table S10), and there was no similar enrichment of mutations at the binding sites of other transcription factors (Fig. S15). In these cancers, a considerable fraction of the mutated neighborhood boundary CTCF sites were affected by multiple mutations (≥3 mutations per site) [280/1826 (15%) in esophageal carcinoma, and 54/1030 (5%) in liver carcinoma](Table S10), and recurrent mutations occurred more frequently in neighborhood boundary CTCF sites compared to non-boundary CTCF sites (Fig. S16A-C). The genes located within the most frequently mutated neighborhoods included known cellular proto-oncogenes annotated in the Cancer Gene Census and other genes that have not been associated with these cancers (Fig 4E-F, Table S11-S12). Two examples of proto-oncogene -containing neighborhoods where the activation of the gene located in the neighborhood has been observed in the respective cancer type are shown in Fig 4G-H. These results suggest that somatic mutations of insulated neighborhood boundaries occur in the genomes of many different cancers.
In summary, disruption of insulated neighborhood boundaries can cause oncogene activation in cancer cells. With maps of 3D chromosome structure such as those described here, cancer genome analysis can consider how recurrent perturbations of boundary elements may impact expression of genes with roles in tumor biology. Our understanding of 3D chromosome structure and its control is rapidly advancing and should be considered for potential diagnostic and therapeutic purposes. Because control of 3D chromosome structure involves binding of specific sites by CTCF and cohesin, which is affected by protein cofactors, DNA methylation and local RNA synthesis (25), future advances in our understanding of these regulatory processes may provide new approaches to therapeutics that impact aberrant chromosome structures.
A
uthor Man
uscr
ipt
A
uthor Man
uscr
ipt
A
uthor Man
uscr
ipt
A
uthor Man
uscr
ipt
Supplementary Material
Refer to Web version on PubMed Central for supplementary material.
Acknowledgments
Supported by NIH grants HG002668 (R.A.Y.), CA109901 (R.A.Y.), HG003143 (J.D.), NS088538 (R.J.), MH104610 (R.J.) and AI120766 (M.H.P.); an Erwin Schrödinger Fellowship (J3490) from the Austrian Science Fund (FWF)(D.H.), Ludwig Graduate Fellowship funds (A.S.W.), the Laurie Kraus Lacob Faculty Scholar Award in Pediatric Translational Research (M.H.P.), Hyundai Hope on Wheels (M.H.P.), an Individual Postdoctoral grant (DFF–1333-00106B)(R.O.B.) and a Sapere Aude Research Talent grant (DFF–1331-00735B)(R.O.B.) from the Danish Council for Independent Research, Medical Sciences. We thank Rebecca Fitzgerald, Sean Grimmond and the ICGC Genome Projects ESAD-UK and OV-AU for permission to use genome sequence data. Datasets generated in this study have been deposited in the Gene Expression Omnibus under the Accession number GSE68978. The Whitehead Institute filed a patent application based on this paper. R.A.Y. is a founder of Syros Pharmaceuticals and R.J. is a founder of Fate Therapeutics.
References and Notes
1. Vogelstein B, Kinzler KW. Cancer genes and the pathways they control. Nature medicine. Aug.2004 10:789.
2. Vogelstein B, et al. Cancer genome landscapes. Science. Mar 29.2013 339:1546. [PubMed: 23539594]
3. Garraway LA, Lander ES. Lessons from the cancer genome. Cell. Mar 28.2013 153:17. [PubMed: 23540688]
4. Croce CM. Oncogenes and cancer. The New England journal of medicine. Jan 31.2008 358:502. [PubMed: 18234754]
5. Kagey MH, et al. Mediator and cohesin connect gene expression and chromatin architecture. Nature. Sep 23.2010 467:430. [PubMed: 20720539]
6. Gibcus JH, Dekker J. The hierarchy of the 3D genome. Molecular cell. Mar 7.2013 49:773. [PubMed: 23473598]
7. Gorkin DU, Leung D, Ren B. The 3D genome in transcriptional regulation and pluripotency. Cell stem cell. Jun 5.2014 14:762. [PubMed: 24905166]
8. Dowen JM, et al. Control of cell identity genes occurs in insulated neighborhoods in Mammalian chromosomes. Cell. Oct 9.2014 159:374. [PubMed: 25303531]
9. Phillips-Cremins JE, et al. Architectural protein subclasses shape 3D organization of genomes during lineage commitment. Cell. Jun 6.2013 153:1281. [PubMed: 23706625]
10. Ji X, et al. 3D Chromosome Regulatory Landscape of Human Pluripotent Cells. Cell stem cell. Dec 10.2015
11. Dixon JR, et al. Topological domains in mammalian genomes identified by analysis of chromatin interactions. Nature. May 17.2012 485:376. [PubMed: 22495300]
12. Nora EP, et al. Spatial partitioning of the regulatory landscape of the X-inactivation centre. Nature. May 17.2012 485:381. [PubMed: 22495304]
13. Armstrong SA, Look AT. Molecular genetics of acute lymphoblastic leukemia. Journal of clinical oncology : official journal of the American Society of Clinical Oncology. Sep 10.2005 23:6306. [PubMed: 16155013]
14. Van Vlierberghe P, Ferrando A. The molecular basis of T cell acute lymphoblastic leukemia. The Journal of clinical investigation. Oct.2012 122:3398. [PubMed: 23023710]
15. Fullwood MJ, et al. An oestrogen-receptor-alpha-bound human chromatin interactome. Nature. Nov 5.2009 462:58. [PubMed: 19890323]
16. Tang Z, et al. CTCF-Mediated Human 3D Genome Architecture Reveals Chromatin Topology for Transcription. Cell. Dec 17.2015 163:1611. [PubMed: 26686651]
17. Hnisz D, et al. Super-enhancers in the control of cell identity and disease. Cell. Nov 7.2013 155:934. [PubMed: 24119843]
A
uthor Man
uscr
ipt
A
uthor Man
uscr
ipt
A
uthor Man
uscr
ipt
A
uthor Man
uscr
ipt
18. Loven J, et al. Selective inhibition of tumor oncogenes by disruption of super-enhancers. Cell. Apr 11.2013 153:320. [PubMed: 23582323]
19. Brown L, et al. Site-specific recombination of the tal-1 gene is a common occurrence in human T cell leukemia. The EMBO journal. Oct.1990 9:3343. [PubMed: 2209547]
20. O'Neil J, Look AT. Mechanisms of transcription factor deregulation in lymphoid cell transformation. Oncogene. Oct 15.2007 26:6838. [PubMed: 17934490]
21. Van Vlierberghe P, et al. The cryptic chromosomal deletion del(11)(p12p13) as a new activation mechanism of LMO2 in pediatric T-cell acute lymphoblastic leukemia. Blood. Nov 15.2006 108:3520. [PubMed: 16873670]
22. Zhang J, et al. The genetic basis of early T-cell precursor acute lymphoblastic leukaemia. Nature. Jan 12.2012 481:157. [PubMed: 22237106]
23. Katainen R, et al. CTCF/cohesin-binding sites are frequently mutated in cancer. Nature genetics. Jul.2015 47:818. [PubMed: 26053496]
24. Heidari N, et al. Genome-wide map of regulatory interactions in the human genome. Genome research. Dec.2014 24:1905. [PubMed: 25228660]
25. Ong CT, Corces VG. CTCF: an architectural protein bridging genome topology and function. Nature reviews. Genetics. Apr.2014 15:234.
26. Mullighan CG, et al. Genome-wide analysis of genetic alterations in acute lymphoblastic leukaemia. Nature. Apr 12.2007 446:758. [PubMed: 17344859]
A
uthor Man
uscr
ipt
A
uthor Man
uscr
ipt
A
uthor Man
uscr
ipt
A
uthor Man
uscr
ipt
Fig. 1. 3D regulatory landscape of the T-ALL genome
(A) Mechanisms activating proto-oncogenes.
(B) Hi-C interaction map and TADs defined in hESC (H1), and cohesin ChIA-PET interactions (intensity of blue arc represents interaction significance), CTCF and H3K27Ac ChIP-Seq profiles and peaks, and RNA-Seq in Jurkat cells at the CD3D locus. ChIP-Seq peaks are denoted as bars above ChIP-Seq profiles.
(C) ChIA-PET interactions at the RUNX1 locus displayed above the ChIP-Seq profiles of CTCF, cohesin (SMC1) and H3K27Ac.
A
uthor Man
uscr
ipt
A
uthor Man
uscr
ipt
A
uthor Man
uscr
ipt
A
uthor Man
uscr
ipt
Fig. 2. Active oncogenes and silent proto-oncogenes occur in insulated neighborhoods
(A) T-ALL Pathogenesis Genes. Colored boxes indicate whether a gene is located within a neighborhood, expressed and associated with a super-enhancer.
(B) Insulated neighborhood at the active TAL1 locus. The cohesin ChIA-PET interactions are displayed above the ChIP-Seq profiles of CTCF, cohesin (SMC1) H3K27Ac, and RNA-Seq track. A model of the insulated neighborhood is shown on the right.
(C) Insulated neighborhood at the silent LMO2 locus.
A
uthor Man
uscr
ipt
A
uthor Man
uscr
ipt
A
uthor Man
uscr
ipt
A
uthor Man
uscr
ipt
Fig. 3. Disruption of insulated neighborhood boundaries is linked to proto-oncogene activation
(A) Cohesin ChIA-PET interactions, CTCF and cohesin (SMC1) binding profiles at the TAL1 locus in Jurkat cells. Patient deletions described in (22) are shown as bars below the gene models. The deletion on the bottom indicates the minimally deleted region identified in (26).
(B) ChIP-Seq profiles of CTCF, H3K27Ac, p300 and CBP, and RNA-Seq at the TAL1 locus in HEK-293T cells. The region deleted using a CRISPR/Cas9-based approach is highlighted in a grey box.
A
uthor Man
uscr
ipt
A
uthor Man
uscr
ipt
A
uthor Man
uscr
ipt
A
uthor Man
uscr
ipt
(C) qRT-PCR analysis of TAL1 expression in wild type HEK-293T cells (wt), and in cells where the neighborhood boundary highlighted on (B) was deleted.
(D) Model of the neighborhood and perturbation at the TAL1 locus.
(E) 5C contact matrices in wild type HEK-293T cells and TAL1 neighborhood boundary – deleted cells. The position of the region removed in the mutant cells is highlighted with an arrow.
(F) Distance adjusted z-score difference (5C) maps at the TAL1 locus (ΔCTCF - wild type HEK-293T). Note the increase in the 5C signal adjacent to the deleted region. CTCF and H3K27Ac binding profiles in wt cells are displayed for orientation.
(G) Cohesin ChIA-PET interactions, CTCF and cohesin (SMC1) binding profiles at the LMO2 locus. Patient deletions described in (22) are shown as bars below the gene models. (H) ChIP-Seq binding profile of CTCF and H3K27Ac, p300 and CBP, and RNA-Seq at the LMO2 locus in HEK-293T cells. The region deleted by a CRISPR/Cas9-based approach is highlighted in a grey box.
(I) qRT-PCR analysis of LMO2 expression in wild type HEK-293T cells (wt), and in cells where the neighborhood boundary highlighted on (H) was deleted.
(J) Model of the neighborhood and perturbation at the LMO2 locus
(K) 5C contact matrices in wild type HEK-293T cells and LMO2 neighborhood boundary – deleted cells. The position of the region removed in the mutant cells is highlighted with an arrow.
(L) Distance adjusted z-score difference (5C) maps at the LMO2 locus (ΔCTCF - wild type HEK-293T). Note the increase in the 5C signal adjacent to the deleted region. CTCF and H3K27Ac binding profiles in wt cells are displayed for orientation.
On (C) and (I) data from n=3 independent biological replicates are displayed as mean + SD; P<0.01 between wt and boundary-deleted cells (two-tailed t-test).
A
uthor Man
uscr
ipt
A
uthor Man
uscr
ipt
A
uthor Man
uscr
ipt
A
uthor Man
uscr
ipt
Fig. 4. Somatic mutations of neighborhood boundaries occur in many cancers
(A) “Constitutive neighborhood” at the NOTCH1 locus. CTCF ChIP-Seq and cohesin ChIA-PET interactions in Jurkat (T-ALL), GM12878 (lymphoblastoid) and K562 (CML) cells are displayed.
(B) Frequency of somatic mutations in the ICGC database at CTCF sites that form
constitutive neighborhood boundaries (left), and CTCF sites that do not form neighborhood boundaries (right).
A
uthor Man
uscr
ipt
A
uthor Man
uscr
ipt
A
uthor Man
uscr
ipt
A
uthor Man
uscr
ipt
(C-D) Somatic mutations in (C) esophageal adenocarcinoma (ESAD-UK) and (D) hepatocellular carcinoma (LIRI-JP) at constitutive neighborhood boundary CTCF sites. (E-F) Genes in constitutive neighborhoods whose boundary is recurrently mutated in (E) esophageal adenocarcinoma and in (F) hepatocellular carcinoma. The bars depict the number of mutations in the neighborhood boundary site. Proto-oncogenes annotated in the Cancer Gene Census are highlighted in red.
(G-H) Mutations in the boundary sites of the neighborhood containing (G) the LMO1 proto-oncogene in esophageal adenocarcinoma, and (H) the FGFR1 proto-proto-oncogene in
hepatocellular carcinoma.
The enrichment of mutations at the constitutive neighborhood boundary sites (+/−5bp of the motif) displayed on (B-D) compared to regions flanking the binding sites has a P-value <10−4 (permutation test).

![[DOC] Cours ASP.NET Pas à Pas | Télécharger PDF](data:image/gif;base64,R0lGODlhAQABAIAAAP///wAAACH5BAEAAAAALAAAAAABAAEAAAICRAEAOw==)