HAL Id: hal-00327923
https://hal.archives-ouvertes.fr/hal-00327923
Submitted on 24 Nov 2004HAL is a multi-disciplinary open access
archive for the deposit and dissemination of sci-entific research documents, whether they are pub-lished or not. The documents may come from teaching and research institutions in France or abroad, or from public or private research centers.
L’archive ouverte pluridisciplinaire HAL, est destinée au dépôt et à la diffusion de documents scientifiques de niveau recherche, publiés ou non, émanant des établissements d’enseignement et de recherche français ou étrangers, des laboratoires publics ou privés.
Balloon-borne Limb profiling of UV/vis skylight
radiances, O3, NO2 and BrO: technical set-up and
validation of the method
F. Weidner, H. Bösch, H. Bovensmann, J. P. Burrows, A. Butz, C.
Camy-Peyret, M. Dorf, K. Gerilowski, W. Gurlit, U. Platt, et al.
To cite this version:
F. Weidner, H. Bösch, H. Bovensmann, J. P. Burrows, A. Butz, et al.. Balloon-borne Limb profiling of UV/vis skylight radiances, O3, NO2 and BrO: technical set-up and validation of the method. Atmospheric Chemistry and Physics Discussions, European Geosciences Union, 2004, 4 (6), pp.7631-7665. �hal-00327923�
ACPD
4, 7631–7665, 2004 Stratospheric Limb measurements F. Weidner et al. Title Page Abstract Introduction Conclusions References Tables Figures J I J I Back CloseFull Screen / Esc
Print Version
Interactive Discussion
EGU
Atmos. Chem. Phys. Discuss., 4, 7631–7665, 2004 www.atmos-chem-phys.org/acpd/4/7631/
SRef-ID: 1680-7375/acpd/2004-4-7631 European Geosciences Union
Atmospheric Chemistry and Physics Discussions
Balloon-borne Limb profiling of UV/vis
skylight radiances, O
3
, NO
2
and BrO:
technical set-up and validation of the
method
F. Weidner1, H. B ¨osch1, *, H. Bovensmann3, J. P. Burrows3, A. Butz1, C. Camy-Peyret2, M. Dorf1, K. Gerilowski3, W. Gurlit3, U. Platt1, C. von Friedeburg1, T. Wagner1, and K. Pfeilsticker1
1
Institut f ¨ur Umweltphysik, University of Heidelberg, Heidelberg, Germany
2
Laboratoire de Physique Mol ´eculaire et Applications (LPMA), Universit ´e Pierre et Marie Curie, Paris, France
3
Institut f ¨ur Umweltphysik und Fernerkundung, University of Bremen, Bremen, Germany
*
now at: Jet Propulsion Laboratory (JPL), Pasadena, USA
Received: 9 August 2004 – Accepted: 28 October 2004 – Published: 24 November 2004 Correspondence to: K. Pfeilsticker ([email protected])
ACPD
4, 7631–7665, 2004 Stratospheric Limb measurements F. Weidner et al. Title Page Abstract Introduction Conclusions References Tables Figures J I J I Back CloseFull Screen / Esc
Print Version
Interactive Discussion
EGU
Abstract
A novel light-weight, elevation scanning and absolutely calibrated UV/vis spectrome-ter and its application to balloon-borne Limb radiance and trace gas measurements is described. Its performance and the novel method of balloon-borne UV/vis Limb trace gas measurements has been tested against simultaneous observations of the 5
same atmospheric parameters available from either (a) in-situ instrumentation (cf., by an electrochemical cell (ECC) ozone sonde also deployed aboard the gondola) or (b) trace gas profiles from inferred UV/vis/near IR solar occultation measurements per-formed on the same payload. The novel technique is also cross validated with radiative transfer modelling. Reasonable agreement is found (a) between measured and simu-10
lated Limb radiances and (b) inferred Limb O3, NO2and BrO and otherwise measured profiles when properly accounting for all relevant atmospheric parameters (temperature T, pressure P, aerosol extinction, and major absorbers).
1. Introduction
In the past two decades remote sensing of the atmosphere by optical methods has 15
evolved into a powerful tool for meteorological, atmospheric photochemistry and cli-mate studies. Most recently, space-borne UV/vis Limb observations of the sky-light have also become available, cf. through the SOLSE/LORE, Odin/OSIRIS, En-visat/SCIAMACHY, METOP-IASI, . . . instruments (e.g., Kerr et al., 1977; McElroy et al., 1988; Burrows et al., 1995; McPeters, et al., 2000; Von Savigny et al., 2003; Sioris 20
et al., 2003).
The SCIAMACHY (SCanning Imaging Absorption spectroMeter for Atmospheric CHartographY) on the ESA-Envisat satellite offers unprecedented possibilities for at-mospheric remote sensing by monitoring a larger number of atat-mospheric trace con-stituents by spectrally resolved UV/vis/near IR Limb observations. SCIAMACHY is a 25
ACPD
4, 7631–7665, 2004 Stratospheric Limb measurements F. Weidner et al. Title Page Abstract Introduction Conclusions References Tables Figures J I J I Back CloseFull Screen / Esc
Print Version
Interactive Discussion
EGU
satellite, which was launched into a sun synchronous low orbit on 28 February 2002 (Bovensmann et al., 1999). SCIAMACHY simultaneously measures the scattered or reflected atmospheric skylight in a variety of viewing directions and the extraterrestrial irradiance in the wavelength range from 220 nm to 2380 nm, at moderate spectral res-olution (e.g., Rozanov et al., 2001; Eichmann et al., 2003; Kaiser and Burrows, 2003; 5
Von Savigny et al., 2004a, b).
The UV/vis Limb measurements of SCIAMACHY, however, involve a number of novel methods and techniques which require careful validation and verification through col-located ground-based, aircraft, and balloon-borne measurements. Among them, the modelling and the verification of the atmospheric radiative transfer (RT) – including 10
the investigation of its sensitivities to a larger number of atmospheric parameters (cf., the temperature, pressure ozone and aerosol profile, . . .) – is most challenging for the interpretation of UV/vis Limb measurements (e.g., McElroy, 1988).
Following the pioneering studies of Kerr et al. (1977) and McElroy (1988), we report here on one of the most stringent tests ever to validate the individual steps (spectral re-15
trieval, RT modelling and profile inversion) – and thus of the whole method – involved in the UV/vis Limb technique. For the present study we have chosen a twofold approach. (1) The validation is performed by deploying a novel balloon-borne, and absolutely calibrated UV/vis scanning Limb spectrometer (called mini-DOAS) on a couple of stratospheric balloon flights on the azimuth controlled LPMA/DOAS payload (Labora-20
toire de Physique Mol ´eculaire et Applications and Differential Optical Absorption Spec-troscopy). These measurements allow us (a) to absolutely monitor UV/vis skylight radiances as a function of height, viewing geometry and solar zenith angle (SZA) and (b) by applying the Differential Optical Absorption Spectroscopy (DOAS, Platt, 1994; Platt and Stutz, 2004) technique to infer vertical profiles for a number of UV/vis absorb-25
ing atmospheric trace gases (O3, NO2, O4, H2O, BrO, and possibly in future of OClO, IO, OIO, . . .).
(2) Further, the measured mini-DOAS Limb radiances are inter-compared to simu-lations of a novel Monte-Carlo (MC) radiative transfer model, the latter being used in
ACPD
4, 7631–7665, 2004 Stratospheric Limb measurements F. Weidner et al. Title Page Abstract Introduction Conclusions References Tables Figures J I J I Back CloseFull Screen / Esc
Print Version
Interactive Discussion
EGU
future studies for forward modelling of the SCIAMACHY Limb observations. Secondly, the inferred trace gas profiles from the mini-DOAS instruments are validated against simultaneous profile measurements of the same atmospheric constituents measured by well established in-situ (e.g., ozone by an electrochemical cell) or optical remote sensing techniques (cf., solar occultation) performed on the LPMA/DOAS payload. For 5
details of the latter measurements see e.g., Camy-Peyret et al., 1993; Payan et al., 1998; Ferlemann et al., 2000; Harder et al., 1998, 2000; B ¨osch et al., 2003, and the companying paper of Gurlit et al., 2004).
The present study is organized as follows: In Sect. 2, the novel instrument and the radiative model used to interpret the measurement are briefly described. In Sect. 3, the 10
instrument performance and its absolute calibration is described. In the Sects. 4 and 5, selected atmospheric observations of the mini-DOAS instrument are described and discussed with respect to the measurements of the other instruments also deployed aboard the LPMA/DOAS payload. Section 6 concludes the study with the lessons learned for future investigations.
15
2. Methods
2.1. Technical set-up of the mini-DOAS instrument
The novel mini-DOAS spectrometer has been designed for low weight (<4 kg) and low power consumption (7.5 W), with a particular emphasis being put on a stable imaging and a reasonably large signal to noise ratio. While the former characteristic offers the 20
chance for versatile applications (cf., a stand-alone operation for time resolved mea-surements of important stratospheric radicals, trace gas meamea-surements and radiative transfer studies in the cloudy troposphere), the latter feature is found to be necessary for the detection of O3, NO2 and in particular of the weakly absorbing gases (OClO, BrO, OIO, IO, . . .), based on the experience with our larger precursor balloon spec-25
ACPD
4, 7631–7665, 2004 Stratospheric Limb measurements F. Weidner et al. Title Page Abstract Introduction Conclusions References Tables Figures J I J I Back CloseFull Screen / Esc
Print Version
Interactive Discussion
EGU
The mini-DOAS instrument consists of 5 major parts: (a) 2 light intake telescopes for simultaneous Nadir and scanning Limb observations (the latter being mounted on an automated elevation scanner), (b) glass fibre bundles which conduct the sky light from the telescopes into the spectrometers, (c) two commercial Ocean Optics USB-2000 spectrometers (d) which are mounted into an evacuated and thermo-stated housing, 5
and finally (e) a single board computer for data handling and storage.
(a) The Nadir and Limb telescopes each consist of a spherical quartz lense (12.7 mm diameter, 30 mm focal length) which focuses the incoming scattered skylight onto the round or the rectangular entrance of the glass fiber bundles. During the balloon flight, the Nadir telescope is mounted at the bottom of the outer frame of the LPMA/DOAS 10
payload structure, which provides an unobscured view into Nadir direction. The Limb telescope is mounted on an elevation angle scanner (built by Hofmann Meßtechnik, Rauenberg, Germany) which supports Limb observations in a range of+10◦ to −20◦ elevation angle, with step sizes as small as 0.04◦. During the balloon flight, the scanner is mounted on the right hand side (i.e., in a+90◦ azimuth angle relative to the Sun’s 15
azimuth direction) of the azimuth controlled LPMA/DOAS gondola.
(b) Each glass fibre bundle consists of 10 individual quartz glass fibers each (diam-eter 100 µm, length 2 m, numerical aperture= 0.22). Glass fibre bundles are used, since they not only allow for a more flexible arrangement of the instrument, but are also known for largely reducing the polarization sensitivity of grating spectrometers (Stutz 20
and Platt, 1996, 1997). In fact, laboratory measurements show that by using glass fibre bundles the polarization sensitivity of an Ocean Optics USB 2000 spectrometer is small (≤1%). For the Nadir observations, the individual glass fibres are arranged in round geometry at the light intake, a mounting which together with the telescope sup-ports a round field of view (FOV) of 0.6◦. For the Limb observations the glass fibres are 25
arranged in a ‘rectangular geometry’ light intake set-up i.e., the individual glass fibre entrances are linearly aligned. This arrangement supports a FOV of 0.19◦ in the verti-cal and 1.34◦in the horizontal direction. Likewise, the glass fibres are linearly aligned at both exits, and the outgoing light is skimmed by a 50 µm wide and 1000 µm high
ACPD
4, 7631–7665, 2004 Stratospheric Limb measurements F. Weidner et al. Title Page Abstract Introduction Conclusions References Tables Figures J I J I Back CloseFull Screen / Esc
Print Version
Interactive Discussion
EGU
spectrometer entrance slit.
(c) The heart of the mini-DOAS balloon instrument consists of two commercial Ocean Optics USB 2000 spectrometers for simultaneous Nadir and Limb observa-tions. The USB 2000 is a miniature grating spectrometer working in cross Czerny-Turner geometry. Its advantage is the small size (86×63×30 mm3), the low weight 5
(270 g) and the high photon detection sensitivity owing to an integrated linear CCD ar-ray detector (Sony ILX511). The light enters the spectrometer through an entrance slit (50 µm×1000 µm) from which it is focussed by a collimator mirror onto a holographic grating with 1800 grooves/mm. A second mirror focusses the light onto the linear CCD array with 2048 pixels (each pixel is 14 µm wide and 200 µm high). Attached onto the 10
CCD array detector is a cylinder lense which focuses the 1000 µm high entrance slit onto the 200 µm high detector. Also attached to the CCD array detector is the pream-plifier and a control logic unit which handles the pre-amplification of the signals, A/D conversion to 12 bit data and communication.
The spectrometers cover a spectral range of 327–527 nm at a full width at half maxi-15
mum resolution (FWHM) of 0.8–1.0 nm, or 8 to 10 detector pixel/FWHM depending on the wavelength. Based on previous experience, this wavelength coverage and resolu-tion should allow for the detecresolu-tion of the atmospheric trace gases O3, NO2, O4, H2O, BrO, and OClO (and potentially IO, OIO, CH2O).
(d) Both spectrometers are kept in a sealed and evacuated container, which itself is 20
immersed in a water-ice reservoir (∼2 l). This ensures a stable spectrometer and CCD array temperature of 0◦C during an entire balloon flight.
(e) Data handling and storage is maintained by a single board PC (type National Geode 200 MHz) which is equipped with a flash memory device. The allocated data are transferred from the spectrometers to the PC via a USB data transfer connection. 25
It supports a data transmission rate fast enough to record a single spectrum every 25 ms. Possible integration times per spectrum as provided by the manufacturer of the spectrometers are in the range of 3–65 535 ms. The PC can alternatively be oper-ated under Windows or the Linux operational systems with our lab-owned DOASIS or
ACPD
4, 7631–7665, 2004 Stratospheric Limb measurements F. Weidner et al. Title Page Abstract Introduction Conclusions References Tables Figures J I J I Back CloseFull Screen / Esc
Print Version
Interactive Discussion
EGU
XDOAS softwares packages, respectively. Both software tools support the automatic adjustment of the integration time, recording and storage of the measured spectra and the control of the Limb scanning stepper motor.
The total size of the instrument is 260×260×310 mm3 (w/o fibers), its weight is ∼4.8 kg plus 2 kg of water and ice, and its power consumption is ∼7.5 W.
5
2.2. Radiative Transfer Modelling
A Monte Carlo (MC) Radiative Transfer model (called ‘Tracy’) has been developed by our group (Von Friedeburg, 2003). It allows the forward simulation of the mini-DOAS and Envisat/SCIAMACHY Limb observations. In particular, it can simulate the mea-sured Limb radiances and slant column densities (SCD) of the trace gases under con-10
sideration, including sensitivity tests for varying atmospheric parameters such as T, P, the ozone and aerosol profiles.
‘Tracy’ solves the radiative transfer equation by backward Monte Carlo simulations in a full spherical, 3-dimensional and refractive atmosphere, based upon existing ray tracing routines. It does not, however, consider the polarization of the scattered sky-15
light, which was found necessary in a recent theoretical study on scattered light ozone measurement (Hasekamp et al., 2002). Further, it supports an arbitrary spatial dis-cretisation, a tool which permits to account for spatially strong varying aerosol and trace gas concentrations, and it takes into account multiple scattering with arbitrary scattering phase functions.
20
For the RT simulations, ‘Tracy’ uses atmospheric temperature and pressure profiles and if available profiles of the atmospheric aerosol and cloud cover and ozone profiles (H ¨onninger et al., 2004). For the present simulations, the stratospheric aerosol data version 2.00 of the SAGE III instrument is used (Thomason and Taha, 2003), and Mie scattering due to tropospheric clouds is not considered further. In the current 25
version, ‘Tracy’ runs with either the ‘Kurucz’ (Kurucz et al., 1994) or the SOLSPEC solar spectrum (Thuillier et al., 1997, 1998a, b).
ACPD
4, 7631–7665, 2004 Stratospheric Limb measurements F. Weidner et al. Title Page Abstract Introduction Conclusions References Tables Figures J I J I Back CloseFull Screen / Esc
Print Version
Interactive Discussion
EGU
densities (SCD) of the trace gases of interest which the actual measurements can be compared with, and so called box air mass factors (BoxAMFs). The latter are en-hancement factors with respect to a vertical line of sight for the relative contribution of individual atmospheric layers on slant paths to the measured total absorption. Profile inversion from simulated or measured SCDs are performed by the optimal estimate a 5
posteriori solution technique described in Rodgers (2000), also used for the inversion of solar occultation measurements performed by the other optical spectrometers (DOAS and LPMA) deployed on the gondola. The combined approach of forward modelling of the atmospheric RT, and ‘conventional’ profile inversion of simulated or measured SCDs is chosen since it offers the chance to cross validate each step of the novel 10
developed ‘quasi’ in-situ Limb technique. Sensitivity tests and validation can thus be undertaken on the simulated and measured Limb radiance level, simulated or mea-sured SCDs of the gases of interest, or by inter-comparison of inferred and otherwise measured profiles cf., obtained from the more traditional solar occultation technique. At the same time, the approach allows us to validate various radiative transfer codes 15
used in upcoming studies addressing SCIAMACHY Limb observations.
3. Instrument performance and calibration
Instrument performance: The optical performance of the mini-DOAS instrument is tested in a set of laboratory measurements using alternatively Penray Hg, Kr or HgCd emission lamps or white lamp sources (PTFE integrating sphere BN-102-3 manufac-20
tured by Gigahertz or briefly Ulbricht sphere). For the temperature stabilized (to 0◦C) in-strument, the following relevant noise contributions (1σ rms) are found for single scans: (a) an electron shot noise level of 15 binary units (BU) corresponding to a 1-σ noise of 0.474% for a 80% saturation level of the CCD array with a well-depth of 62 500 electrons and an electron to binary unit conversion factor of 15 e−/BU.
25
(b) an electronic noise of 67.4 electrons or 4.4 BU causing a noise of 0.135% at 1-σ. (c) the dark current of the SONY ILX511 shows a large pixel to pixel variation
ACPD
4, 7631–7665, 2004 Stratospheric Limb measurements F. Weidner et al. Title Page Abstract Introduction Conclusions References Tables Figures J I J I Back CloseFull Screen / Esc
Print Version
Interactive Discussion
EGU
e.g., next to pixels with very small dark current there are pixels for which the cur-rent is 270 electron/s corresponding to 18 BU/s. The average dark curcur-rent, however, is 16.6 electrons/s only, corresponding to 1.09 BU/s, and the dark current noise is mea-sured to 4.08 electrons/s, much smaller than the other noise contribution.
Since the noise contributions (a to c) suggest that the most significant noise sources 5
are the photoelectron and offset noise, and both should be inversely proportional to the square root of the number of scans (N). The total noise is measured as a function of N (Fig. 1). For this purpose the total noise and its scaling with the number of scans is measured using scattered skylight and a small Ulbricht sphere. The latter is equipped with an up-to-date stabilized, quartz tungsten halogen (QTH) lamp. Test measure-10
ments alternatively using the lamp or skylight show that the 1-σ noise for single scans is 0.647% and 0.90% for the lamp and the skylight spectra, respectively. For a medium large number of scans, the instrument, in fact, operates at the physical limits given by the photo-electron noise. For an actual balloon flight, typically 100–1000 spectra (cor-responding to 10–100 s integration time) are co-added for the sake of height resolution. 15
This results for field conditions in a total 1-σ noise of 6·10−4 for 100 (as indicated by the arrow in Fig. 1), and 2.5·10−4for 1000 co-added spectra, respectively (as indicated by the arrow in Fig. 1).
Absolute calibration: The radiometric calibration of both spectrometers is performed in two steps: In a first step, a small, but not absolutely calibrated, Ulbricht sphere is 20
absolutely cross calibrated against an absolute radiance standard using the Limb spec-trometer as transfer device. In a second step, this now absolutely calibrated integrating sphere is used for radiometric calibration of each of the spectrometers, shortly before the actual balloon flight is conducted.
For absolute radiance calibration, a NIST (National Institute of Standards and Tech-25
nology) calibrated FEL 1000 W irradiance QTH standard (serial number F-455 from OSRAM Sylvania; Walker et al., 1987) in combination with a calibrated space grade Spectralon diffuser plate manufactured by Labsphere is employed. The same setup is used for absolute radiometric calibration of SCIAMACHY during the SCIAMACHY
cal-ACPD
4, 7631–7665, 2004 Stratospheric Limb measurements F. Weidner et al. Title Page Abstract Introduction Conclusions References Tables Figures J I J I Back CloseFull Screen / Esc
Print Version
Interactive Discussion
EGU
ibration campaign in 1998 (Dobber, 1999). The bi-directional reflectance distribution function (BRDF) of the diffuser plate is calibrated in 0–23◦geometry by TNO/TPD. For more details see TNO/TPD report of calibration (van Leeuwen, 2003). NIST provides the calibration at a distance of 50 cm. The wavelength dependent radiometric irra-diance accuracy of the NIST-FEL lamp ranges between 0.91%–1.09%, and the long 5
term reproducibility is 0.87%–0.96% in the 350–654.6 nm wavelength range (for more details see the NIST report of calibration (844/25 70 96-96-1, 1997). For the radi-ance transfer measurements, the NIST-FEL lamp and the Spectralon diffuser plate are positioned into the optical axis given by the light intake of the Limb transfer spectrom-eter as recommended by Dobber (1999). The field of view of the spectromspectrom-eter light 10
intake telescope is small and completely located inside the characterized lamp irradi-ance plane on the Spectralon diffuser plate. After the measurement is taken, a not yet absolutely calibrated integrating sphere (type BN-102-3) is cross calibrated with the calibrated transfer spectrometer. The uncertainty of the radiance of the NIST-FEL lamp and Spectralon setup in the 300–700 nm region is 2–3% as indicated by test measure-15
ments performed during the SCIAMACHY calibration campaign (Gerilowski, 2004). For the somewhat less ideal conditions in the field, the estimated accuracy of the absolute radiometric calibration for both spectrometers is assessed to 35% at 380 nm, 10% at 440 nm and 4% at 510 nm, including all known sources of uncertainties and errors. The reproducibility of the integrating sphere measurements is better than 1%, respectively. 20
Further, the absolute calibration is checked by comparing the measured radiance at two wavelengths (360 nm vs. 490 nm), for a condition for which the radiative transfer is simple. For example, for the Limb observations (90◦ azimuth angle, +0.5◦ eleva-tion angle, SZA=88.54◦ at 30 km) during the Kiruna 23 March 2003 flight, by far most photons (≥98%) are single Rayleigh scattered. Therefore, by knowing the relative 25
solar irradiance F(360 nm)/F(490 nm)=0.588 (e.g. Gurlit et al., 2004) for the two wave-lengths and the relative probability for Rayleigh scattering (490 nm)/(360 nm)4=3.432, the radiance ratio I(360 nm)/I(490 nm)=2.018 can be calculated. In fact, the model ‘Tracy’ calculates a ratio of I(360 nm)/I(490 nm)=2.06, and our observation yields
ACPD
4, 7631–7665, 2004 Stratospheric Limb measurements F. Weidner et al. Title Page Abstract Introduction Conclusions References Tables Figures J I J I Back CloseFull Screen / Esc
Print Version
Interactive Discussion
EGU
I(360 nm)/I(490 nm)∼2.0.
4. Observations and flights
For the actual balloon flights (see Table 1) the instrument is mounted on the azimuth controlled LPMA/DOAS payload. One of the telescopes is directed into the Nadir, whereas the other telescope is mounted into the Limb scanner, which points perpendic-5
ular to the Sun’s azimuth direction (when the gondola is perfectly azimuth controlled). To date 5 mini-DOAS flights have been performed; and overall the instrument per-formed well during all of them. Since the instrument and method are novel and need some testing, the instrument has been constantly refined by cf., by operating a Limb scanner from the second flight on, by subsequently improving the instrument’s hous-10
ing and cooling and its software, and finally by adding a vacuum sealed housing sur-rounding the spectrometers. Therefore, the Limb and Nadir spectra are not directly comparable from one balloon flight to another. Nevertheless, the functionality, and the feasibility of the method, as well as its potential for novel atmospheric observations are well demonstrated by the results discussed in the following section.
15
5. Results and discussion
In the following, we provide some sample results obtained from the data collected during 2 of the 5 balloon flights:
(a) In a first exercise, the measured absolute skylight radiances (azimuth angle 90◦, fixed elevation of +0.5◦) are compared with MC modelled skylight radiances for two 20
wavelengths (λ=360 nm and λ=490 nm) for the balloon ascent and the balloon float al-titude (30.3–32.2 km) Limb scanning observations at Kiruna on 23 March 2003 (Figs. 2 and 3). For the RT modelling the actual measured atmospheric parameters (profiles of T and p, and of ozone) are used, and the ground albedo is set to 0.6 (which ac-counts for the still existing snow cover over Northern Scandinavia by late March 2003). 25
ACPD
4, 7631–7665, 2004 Stratospheric Limb measurements F. Weidner et al. Title Page Abstract Introduction Conclusions References Tables Figures J I J I Back CloseFull Screen / Esc
Print Version
Interactive Discussion
EGU
No further assumptions are made for the tropospheric aerosols and cloud scattering and absorption, mainly because they are not known for the actual sounding and are known to be quite variable. Figure 2 demonstrates that with the given assumptions the measured stratospheric Limb radiances at 360 nm and 490 nm are reasonably re-produced well by the RT model (within the given error bars). At λ=360 nm, however, 5
the measured Limb radiances are exceedingly larger than the simulation below 17 km, most likely due to the Mie scattering of very small aerosols (r<0.01 µm) not captured in the SAGE-III measurements and not accounted for in the RT simulations even though claimed to be a real feature (Hirsekorn, 2003). Also not unexpected, in the tropopause region the measured Limb radiances are much more variable at 490 nm than at 360 nm. 10
This effect is due to the predominance of Mie scattering by aerosols and clouds over Rayleigh scattering for the skylight radiances in the visible (at 490 nm) compared to UV light (at 360 nm).
Figure 3 shows the measured and modelled Limb radiance λ=490 nm for the Limb scanning observations at balloon float altitude (30.3–32.2 km). Overall, a good agree-15
ment in the measured and modelled skylight radiance is found for Limb scanning runs (number 2 to 5 when counting from left to right), and only for the 1st run (around SZA=89◦) the disagreement is larger at lower altitudes than expected. We believe that the gap around SZA=90◦is due to the notorious difficulties of RT models to deal numer-ically correct with 1/cos(SZA)-issues in this regime. Test runs using a better numerical 20
representation are under way. Moreover, sensitivity tests showed that increasing the ground or tropospheric albedo can partly (but not totally) close the gap between lower measured than modelled radiance received from the lowermost stratosphere.
(b) After gaining some confidence in the RT modelling and the involved numerical inversion techniques (for the latter see e.g., Rodgers, 2000; Ferlemann et al., 1998, 25
2000), we further evaluate the measured spectra during balloon ascent and at balloon float to obtain profile information of some relevant atmospheric absorbers in the UV/vis wavelength range i.e., of O3, NO2, O4, BrO, and H2O, and, in future studies of OClO.
ACPD
4, 7631–7665, 2004 Stratospheric Limb measurements F. Weidner et al. Title Page Abstract Introduction Conclusions References Tables Figures J I J I Back CloseFull Screen / Esc
Print Version
Interactive Discussion
EGU
the Differential Optical Absorption Spectrometry (DOAS) technique is applied to the measured spectra (Platt, 1994; Platt and Stutz, 2004). For the spectral retrieval, the WinDOAS programme is used (M. Van Roozendael and C. Fayt, private communica-tion). In the spectral retrieval of the different gases, the following wavelength inter-vals with following reference spectra are considered: 490–520 nm for O3 and H2O; 5
400–450 nm for NO2 465–490 nm for O4, and 347–358 nm for BrO, NO2, O4 and O3. For trace gas reference absorption spectra, the following spectra are used: ozone from Burrows et al. (1999) (at T=203 K and 223 K) and alternatively from Voigt et al. (2001) (T=203 K); NO2 (T=217 K) from Harder et al. (1997) (T=217 K and 230 K); O4(at room temperature) from Hermans et al. (personal communication, 2002; for de-10
tails see also: http://www.oma.be/BIRA-IASB/Scientific/Topics/Lower/LaboBase/acvd/
O4Info.html); for BrO (T=223 K) from Wahner et al. (1988) shifted by +0.25 nm to match the wavelength calibration of the BrO reference from the IUP-Bremen (see
http://www.iup.physik.uni-bremen.de/gruppen/molspec/bro2 page.html); and water va-por (T=230 K, p=400 hPa) from Rothman et al. (2003). All high resolution cross sec-15
tions are convolved with the actual instrumental slit function, determined from recorded line spectra of Hg and Kr. A spectrum correcting for the Ring effect is also included in the fitting routine (Grainger and Ring, 1962). For the Fraunhofer reference spectrum, a Limb measurement from balloon float altitude is used, for which the residual trace gas absorptions are expected to be minimal. For example, for the flight from Kiruna 20
on 23 March 2003, the Fraunhofer reference is recorded at an altitude of 29 746 km, SZA=88.5◦, elevation angle+0.5◦ and azimuth angle 90◦ to the sun. Figures 4 and 5 show the spectral retrievals for the inferred differential slant column densities of ozone measured at 31 620 km for SZA=89.9◦, and elevation angle −5.5◦, and of NO2 mea-sured at 30 940 km for SZA=89.4◦, and −3.5◦ elevation angle, respectively. Figure 6 25
shows the inferred BrO absorption for an observation at 26 439 km altitude (−1.5◦ el-evation angle, 90◦ azimuth angle and SZA=82.9◦) for the Kiruna flight on 24 March 2004. The trace gas amounts in the Fraunhofer references are determined by a DOAS fit of the measured spectra to the Kurucz (Kurucz et al., 1984) spectrum convolved to
ACPD
4, 7631–7665, 2004 Stratospheric Limb measurements F. Weidner et al. Title Page Abstract Introduction Conclusions References Tables Figures J I J I Back CloseFull Screen / Esc
Print Version
Interactive Discussion
EGU
the instrument’s resolution.
In a first exercise, we tested the O3profile retrieval from the mini-DOAS observations for a fixed Limb viewing geometry (at an azimuth angle of 90◦and an elevation angle of 0.5◦) performed during the balloon ascent of the Kiruna 23 March 2003 flight. Note that the balloon flight is undertaken around the vortex edge, implying large horizontal 5
gradients in the trace gas concentrations.
In a first step, the slant column densities of ozone (O3-SCD) are inferred from the measured spectra, and compared with the same parameter simulated by Tracy RT calculations using as input either the O3 profile simultaneously measured aboard by an electrochemical cell (ECC), or by a stand-alone ECC O3 sonde, launched ∼3 h 10
after the LPMA/DOAS gondola. Figure 7 reveals that the measured and simulated O3-SCDs compare reasonably well, however only for the simulations using the ozone profile measured by the ECC-sonde aboard (the full line in Fig. 7). Conversely taking the O3 profile in the simulation from the measured stand-alone launched ECC sonde launched ∼3 h after the LPMA/DOAS payload, larger O3 concentrations are obtained 15
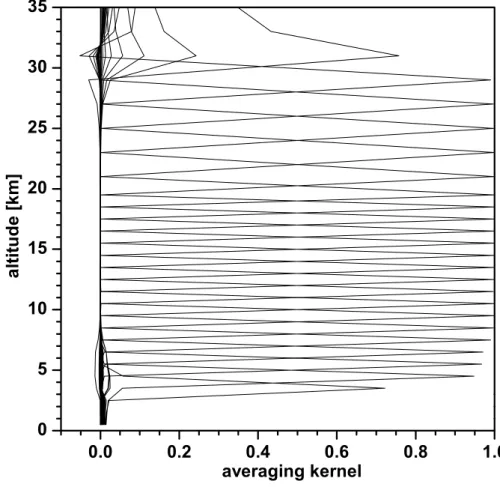
in the 12–21 km height range with a corresponding overestimation in the simulated O3-SCDs (dotted curve in Fig. 7). This comparison clearly demonstrates the quality of the Limb O3measurements and its sensitivity towards the shape and O3concentration of the profile. This large sensitivity for upper tropospheric and lower stratospheric trace gas detection is also indicated by the averaging kernels which attain a value close to 20
unity within the 4.5 km to 29 km height range (on a 1 km altitude grid below 20 km and 2 km above 20 km (see Fig. 8).
In a second step, the measured O3-SCDs are mathematically inverted into O3profile, using RT simulated air mass factors for each observation, and the inversion routines 25
described in Sect. 2.2 (Fig. 9). Overall, the good agreement found between the inferred Limb ozone profile and the simultaneously measured O3profiles either from the aboard ECC sonde or inferred from the direct Sun DOAS observations indicates the feasibility of the balloon-borne Limb method.
ACPD
4, 7631–7665, 2004 Stratospheric Limb measurements F. Weidner et al. Title Page Abstract Introduction Conclusions References Tables Figures J I J I Back CloseFull Screen / Esc
Print Version
Interactive Discussion
EGU
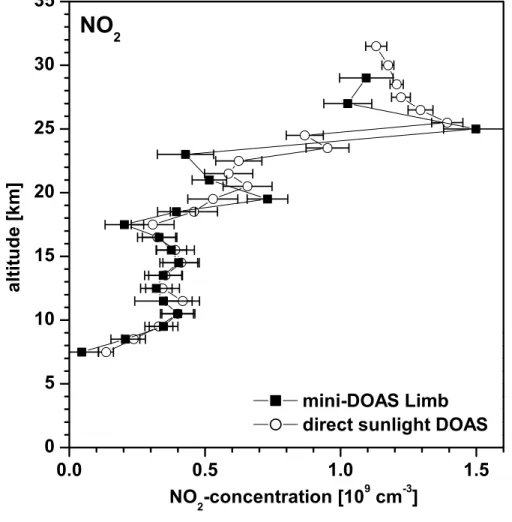
In a second exercise, we inferred from the measured NO2-SCDs, a NO2 profile for the balloon ascent on 23 March 2003 (Fig. 10). As before the comparison of the NO2 profiles inferred either from the Limb or direct Sun observations is excellent. As before, this finding again demonstrates the equally large sensitivity of the balloon-borne ascent Limb measurement compared to the solar occultation techniques. It is a result of the 5
trade of the larger sensitivity for the solar occultation vs Limb scanning spectroscopy due to the larger amount of analyzed photons, and the smaller averaging kernels (or air mass factors) for the former vs the latter measurements.
In a third exercise, we inferred from the measured Limb spectra the BrO profile for the balloon ascent on 24 March 2004 (Fig. 11). As for the NO2 comparison, the Limb 10
measured BrO excellently compares with the BrO measured with the solar occultation instrument, thus providing compelling confidence in both methods.
Finally in a fourth exercise, we inter compare measured and simulated O3Limb pro-filing for the Kiruna 23 March 2003 balloon float (30.3–32.2 km) observations (Fig. 12). As before, the measured and simulated O3-SCDs compare well, in particular for tan-15
gent heights above the ozone maximum concentration (>25 km). For lower altitudes, simulated O3-SCD are larger than those measured, a finding for which the reason is not totally clear. Noteworthy is however, that the simulated O3-SCDs are less sensi-tive to RT errors than the simulated Limb radiances. Therefore the small error found in the simulated radiance (Fig. 3) can hardly provide an explanation for the discrep-20
ancies. Moreover, the RT simulations show that most photons (∼95%) contributing to the measured spectrum are single scattered into the instrument’s field of view. In con-sequence, for a given ozone profile, a larger simulated than measured Limb O3-SCD could mean a longer simulated than real viewing distance (or a better visibility) over which the Limb radiance received by the instrument is integrated. Conversely, if the 25
RT model simulations fit well with the actual atmospheric RT, smaller measured than simulated O3-SCDs would imply smaller ozone concentrations than assumed in the simulation (here as before, the aboard measured ECC-sonde ozone profile is taken). In fact, there is a good reason to assume that the latter explanation is more likely than
ACPD
4, 7631–7665, 2004 Stratospheric Limb measurements F. Weidner et al. Title Page Abstract Introduction Conclusions References Tables Figures J I J I Back CloseFull Screen / Esc
Print Version
Interactive Discussion
EGU
the former since the measurement is performed at the vortex edge. Therefore the low-in-ozone polar vortex air masses are coming more and more into the instrument’s field of view as the gondola followed (in clockwise direction) the increasing solar azimuth angle with progressing balloon flight duration.
6. Conclusions
5
We describe first measurements of a novel UV/vis spectrometer and its application to balloon-borne Limb radiance and trace gas measurements. The study discusses the instrument’s performance in a series of balloon flights, and the novel method of balloon-borne UV/vis Limb trace gas measurements is tested against simultaneous observations of the same atmospheric parameters and RT model results.
10
Overall a reasonably good agreement is found in inter-comparisons of simulated and measured Limb radiance performed in fixed observing geometry during balloon ascent, and in Limb scanning geometry at balloon float altitude during sunset. Due to potential problems arising from the Earth sphericity and atmospheric refraction, the latter pro-vides a stringent test for forward RT modelling. Further, accurate and cross validated 15
RT modelling and measurements, however, permit to calculate more reliably photoly-sis frequencies of UV/vis absorbing atmospheric trace gases, known to be particularly difficult to be calculated at large solar zenith angles (e.g., B¨osch et al., 2001; Uhl and Reddmann, 2004). The inter-comparison demonstrates that the UV/vis optical prop-erties of the stratosphere for volcanically quiescent and polar stratospheric cloud free 20
periods are reasonably well understood.
The novel quasi ‘in-situ’ Limb technique is also cross validated by simultaneous mea-surements of the same atmospheric trace gases (here O3, NO2, BrO) and, overall, a good agreement is found. It is shown that the UV/vis Limb measurements are particu-larly sensitive in the upper troposphere/lowermost stratosphere (UT/LS) for moderately 25
large SZA during balloon ascent. In the future, this particularly large sensitivity may allow more accurate studies on the UT/LS NO2or halogen oxide photochemistry than
ACPD
4, 7631–7665, 2004 Stratospheric Limb measurements F. Weidner et al. Title Page Abstract Introduction Conclusions References Tables Figures J I J I Back CloseFull Screen / Esc
Print Version
Interactive Discussion
EGU
presently available from remote sensing instrumentation. Moreover, scanning UV/Vis Limb profiling may provide a rather powerful tool to investigate the time dependent photochemistry of stratospheric radicals, for example of the ClO+BrO ozone loss cy-cle by simultaneous observations of the OClO and BrO profiles in the wintertime polar stratosphere (WMO, 2002).
5
Finally, our study demonstrates the overall feasibility of the various methods (spectral retrieval, forward RT modelling, profile inversion, . . .) in the emerging technique of satellite-borne remote sensing of atmospheric constituents by spectroscopic UV/vis Limb observations (e.g., Burrows et al., 1995; McPeters, et al., 2000; Von Savigny et al., 2003; Sioris et al., 2003).
10
Acknowledgements. Support of the project by BMBF through grants 50FE0017 and 50FE0019. We are grateful to the support given by the team of CNES in particular ‘l’equipe nacelles point ´ees’ and the balloon launching team from Aire-sur-l’Adour/France for the assistance given to perform successfully the balloon flights. We thank in particular C. Randall (University of Col-orado, Boulder, USA) for providing the SAGE III aerosol data. Thanks to M. Long for English 15
proof-reading the manuscript.
References
B ¨osch, H., Camy-Peyret, C., Chipperfield, M., Fitzenberger, R., Harder, H., Schiller, C., Schnei-der, M., Trautmann, T., and Pfeilsticker, K.: Inter comparison of measured and modeled stratospheric UV/vis actinic fluxes at large solar zenith angles, Geophys. Res. Lett., 28, 20
1179–1182, 2001.
B ¨osch, H., Camy-Peyret, C., Chipperfield, M. P., Fitzenberger, R., Harder, H., Platt, U., and Pfeilsticker, K.: Upper limits of stratospheric IO and OIO inferred from center-to-limb-darkening-corrected balloon-borne solar occultation visible spectra: Implications for total gaseous iodine and stratospheric ozone, J. Geophys. Res., 108, D15, 4455, 25
doi:10.1029/2002JD003078, 2003.
Bovensmann, H., Burrows, J. P., Buchwitz, M., Frerick, J., No ¨oel, S., Rozanov, V. V., Chance, K. V., and Goede, A. H. P.: SCIAMACHY: Mission Objectives and Measurement Modes, J. Atmos. Sci., 56, 127–150, 1999.
ACPD
4, 7631–7665, 2004 Stratospheric Limb measurements F. Weidner et al. Title Page Abstract Introduction Conclusions References Tables Figures J I J I Back CloseFull Screen / Esc
Print Version
Interactive Discussion
EGU
Burkholder, J. B. and Talukdar, R. K.: Temperature dependence of the ozone absorption cross section over the wavelength range 410 to 760 nm, Geophys. Res. Lett., 21, 581–584, 1994. Burrows, J. P., H ¨olzle, E., Goede, A. P. H., Visser, H., and Fricke, W.: SCIAMACHY – Scanning
Imaging Absorption Spectrometer for Atmospheric Chartography, Acta Astronautica, 35, 7, 445, 1995.
5
Burrows, J. P., Richter, A., Dehn, A., Deters, B., Himmelmann, S., Voigt, S., and Orphal, J.: Atmospheric remote-sensing reference data from GOME – 2. Temperature-dependent ab-sorption cross sections of O3 in the 231–794 nm range, J. Q. S. R. T., 61, 4, 509–517, 1999.
Camy-Peyret, C., Flaud, J. M., Perrin, A., Rinsland, C. P., Goldman, A., and Murcray, F.: Strato-10
spheric N2O5, CH4and N2O profiles from IR solar occultation spectra, J. Atmos. Chem., 16, 31–40, 1993.
Dobber, M.: Absolute radiometric calibration of the SCIAMACHY PFM, TNSCIA1000TP/190, issue 1, Feb. 15, 1999.
Eichmann, K.-U., Kaiser, J. W., von Savigny, C., Rozanov, A., Rozanov, V., Bovensmann, H., 15
K ¨onig, M., and Burrows, J. P.: SCIAMACHY limb measurements in the UV/vis spectral re-gion: first results, Adv. Space Res., 34, 775–779, 2003.
Ferlemann, F., Camy-Peyret, C., Fitzenberger, R., Harder, H., Hawat, T., Osterkamp, H., Perner, D., Platt, U., Schneider, M., Vradelis, P., and Pfeilsticker, K.: Stratospheric BrO Profiles Measured at Different Latitudes and Seasons: Instrument Description, Spectral and Profile 20
Retrieval, Geophys. Res. Lett., 25, 3847–3850, 1998.
Ferlemann, F., Bauer, N., Fitzenberger, R., Harder, H., Osterkamp, H., Perner, D., Platt, U., Schneider, M., Vradelis, P., and Pfeilsticker, K.: A new DOAS-instrument for stratospheric balloon-borne trace gas studies, J. Appl. Opt., 39, 2377–2386, 2000.
Gerilowski, K.: Estimation of the Absolute Value of the ESM Diffuser BRDF from NASA 25
Sphere Measurements from Optec-5, IFE-SCIA-KG-20040128 ESM BRDF Correction, draft 1.3, May 15, 2004.
Gil, M., Puentedura, O., Yela, M., and Cuevas, E.: Behaviour of NO2 and O3 columns during the eclipse of 26 February 1998, as measured by visible spectroscopy, J. Geophys. Res., 105, 3583–3593, 2000.
30
Grainger, J. F. and Ring, J.: Anomalous Fraunhofer line profiles, Nature, 193, 762, 1962. Gurlit, W., B ¨osch, H., Butz, A., Burrows, J., Camy-Peyret, C., Dorf, M., Gerilowksi, K.,
spec-ACPD
4, 7631–7665, 2004 Stratospheric Limb measurements F. Weidner et al. Title Page Abstract Introduction Conclusions References Tables Figures J I J I Back CloseFull Screen / Esc
Print Version
Interactive Discussion
EGU
tral ranges: Inter-comparison with ground-based and satellite-borne measurements, Atmos. Chem. Phys. Discuss., accepted, 2004.
Harder, J. W., Brault, J. W., Johnston, P., and Mount, G. H.: Temperature dependent NO2cross sections at high spectral resolution, J. Geophys. Res., 102, 3861–3879, 1997.
Harder, H., Camy-Peyret, C., Ferlemann, F., Fitzenberger, R., Hawat, T., Osterkamp, H., Perner, 5
D., Platt, U., Schneider, M., Vradelis, P., and Pfeilsticker, K.: Stratospheric BrO Profiles Measured at Different Latitudes and Seasons: Atmospheric Observations, Geophys. Res. Lett., 25, 3843–3846, 1998.
Harder, H., B ¨osch, H., Camy-Peyret, C., Chipperfield, M., Fitzenberger, R., Payan, S., Perner, D., Platt, U., Sinnhuber, B., and Pfeilsticker, K.: Comparison of measured and modeled 10
stratospheric BrO: Implications for the total amount of stratospheric bromine, Geophys. Res. Lett., 27, 3695–3698, 2000.
Hasekamp, O. P., Landgraf, J., and van Oss, R.: The need of polarization modeling for ozone profile retrieval from backscattered sunlight, J. Geophys. Res., 107, 4692, doi:10.1029/2002JD002387, 2002.
15
Hirsekorn, M.: Measurements of Stratospheric Aerosol Extinction Coefficients by Balloon-borne DOAS Observations, Diploma thesis, University of Heidelberg, Heidelberg, Germany, 2003. H ¨onninger, G., von Friedeburg, C., and Platt, U.: Multi Axis Differential Optical Absorption
Sepctroscopy (MAX-DOAS), Atmos. Chem. Phys., 4, 231–254, 2004,
SRef-ID: 1680-7324/acp/2004-4-231. 20
Kaiser, J. W. and Burrows, J. P.: Fast weighting functions for retrievals from Limb scattering measurements, J. Q. S. R. T., 77, 273–283, 2003.
Kerr, J. B., Evans, W. F. J., and McConnell, J. C.: The effect of NO2 changes at twilight on
tangent ray NO2measurements, Geophys. Res. Lett., 4, 577–579, 1977.
Kurucz, R. L., Furenhild, I., Brault, J., and Testermann, L.: Solar Flux Atlas From 296 to 25
1300 nm, National Solar Observatory Atlas, No. 1, June 1984.
McElroy, C. T.: Stratospheric nitrogen dioxide concentrations as determined from limb bright-ness measurements made on June 17th, 1983, J. Geophys. Res., 93, 7075–7083, 1988. McPeters, R. D, Janz, S. J., Hilsenrath, E., Brown, T. L., Flittner, D. E., and Heath, D. F.: The
retrieval of O3 profiles from Limb scatter measurements: Results from the Shuttle Ozone 30
Limb Sounding Experiment, Geophys. Res. Lett., 27, 2597–2600, 2000.
Payan, S., Camy-Peyret, C., Lef `evre, F., Jeseck, P., Hawat, T., and Durry, G.: First direct simultaneous HCl and ClONO2 profile measurements in the Arctic vortex, Geophys. Res.
ACPD
4, 7631–7665, 2004 Stratospheric Limb measurements F. Weidner et al. Title Page Abstract Introduction Conclusions References Tables Figures J I J I Back CloseFull Screen / Esc
Print Version
Interactive Discussion
EGU
Lett., 25, 2663–2666, 1998.
Platt, U.: Differential Optical Absorption Spectroscopy (DOAS), Air Monit. by Spectr. Tech-niques, edited by: Sigrist, M. W., Chemical Analysis Series, 127, 27–84, John Wiley & Sons, Inc., 1994.
Platt, U. and Stutz, J.: Differential Optical Absorption Spectroscopy (DOAS), Principle and 5
Applications, Springer Verlag Heidelberg, ISBN 3-340-21193-4, 2004.
Rodgers, C. D.: Inverse Methods For Atmospheric Sounding, World Scientific, Singapore, New Jersey, London, Hongkong, 2000.
Rothman, L. S., Barbe, A., Benner, D. C., Brown, L. R., Camy-Peyret, C., Carleer, M. R., Chance, K., Clerbaux, C., Dana, V., Devi, V. M., Fayt, A., Flaud, J.-M., Gamache, R. R., 10
Goldman, A., Jacquemart, D., Jucks, K. W., Lafferty, W. J., Mandin, J.-Y., Massie, S. T., Nemtchinov, V., Newnham, D. A., Perrin, A., Rinsland, C. P., Schroeder, J., Smith, K. M., Smith, M. A. H., Tang, K., Toth, R. A., Vander Auwera, J., Varanasi, P., and Yoshino, K.: The HITRAN molecular spectroscopic database: edition of 2000 including updates through 2001, J. Q. S. R. T., 82, 1–4, 2003.
15
Rozanov, A., Rozanov, V., and Burrows, J. P.: A numerical radiative transfer model for a spher-ical planetary atmosphere: Combined differential-integral approach involving the Picard iter-ative approximation, J. Q. S. R. T., 69, 513–534, 2001.
Sioris, C. E., Haley, C. S., McLinden, C. A., von Savigny, C., McDade, I. C., McConnell, J. C., Evans, W. F. J., Lloyd, N. D., Llewellyn, E. J., Chance, K. V., Kurosu, T. P., Murtagh, 20
D., Frisk, U., Pfeilsticker, K., B ¨osch, H., Weidner, F., Strong, K., Stegman, J., and M ´egie, G.: Stratospheric profiles of nitrogen dioxide observed by OSIRIS on the Odin satellite, J. Geophys. Res., 108, 4215, doi:10.1029/2002JD002672, 2003.
Stutz, J. and Platt, U.: Numerical analysis and estimation of the statistical error of differential optical absorption spectroscopy measurements with least-square methods, Appl. Opt., 35, 25
30, 6041–6053, 1996.
Stutz, J. and Platt, U.: Improving long-path differential optical absorption spectroscopy (DOAS) with a quartz-fiber mode-mixer, Appl. Opt., 36, (6), 1105–1115, 1997.
Thomason, L. W. and Taha, G.: SAGE III aerosol extinction measurements: Initial Results, Geophys. Res. Lett., 30, (12), 1631, doi:10.1029/2003GL017317, 2003.
30
Thuillier, G., Hers ´e, M., Simon, P. C., Labs, D., Mandel, H., and Gillotay, D.: Observation of the UV solar irradiance between 200 and 350 nm during the ATLAS-1 mission by the SOLSPEC spectrometer, Sol. Phys., 171, 283–302, 1997.
ACPD
4, 7631–7665, 2004 Stratospheric Limb measurements F. Weidner et al. Title Page Abstract Introduction Conclusions References Tables Figures J I J I Back CloseFull Screen / Esc
Print Version
Interactive Discussion
EGU
Thuillier, G., Hers ´e, M., Simon, P. C., Labs, D., Mandel, H., Gillotay, D., and Foujols, T.: The visible solar spectral irradiance from 350 to 850 nm as measured by the SOLSPEC spec-trometer during the ATLAS-1 mission, Sol. Phys., 177, 41–61, 1998a.
Thuillier, G., Hers ´e, M., Simon, P. C., Labs, D., Mandel, H., and Gillotay, D.: Solar radiometry and solar spectral irradiance: Observation of the solar spectral irradiance from 200 nm to 5
870 nm during the ATLAS 1 and ATLAS 2 missions by the SOLSPEC spectrometer, Metrolo-gia, 35, 689–697, 1998b.
Uhl, R. and Reddmann, T.: Divergence of sun-rays by atmospheric refraction at large solar zenith angles, Atmos. Chem. Phys., 4, 1399–1405, 2004,
SRef-ID: 1680-7324/acp/2004-4-1399. 10
Van Leeuwen, S.: Spectralon Diffuser BRDF Measurement, ESA Technical Note, TPD-PhE-TN-009, issue 1, Sept. 3, 2003, and Absolute Radiometric Calibration of the SCIA-MACHY PFM, TNSCIA1000TP/190, issue 1, Feb. 15, 1999.
Von Friedeburg, C.: Derivation of Trace Gas Information combining Differential Optical Absorp-tion Spectroscopy with Radiative Transfer Modelling, PhD Thesis, IUP Heidelberg, Heidel-15
berg 2003.
Von Savigny, C., Rozanov, A., Bovensmann, H., Eichmann, K.-U., Kaiser, J. W., No ¨el, S., Rozanov, V. V., Sinnhuber, B.-M., Weber, M., and Burrows, J. P.: Stratospheric Ozone Pro-files retrieved from Limb Scattered Sunlight Radiance Spectra Measured by the OSIRIS In-strument on the Odin Satellite, Geophys. Res. Lett., 30, doi:10.1029/2002GL016401, 2003. 20
Von Savigny, C., Rozanov, A., Bovensmann, H., Eichmann, K.-U., Kaiser, J. W., No ¨el, S., Rozanov, V. V., Sinnhuber, B.-M., Weber, M., and Burrows, J. P.: The Ozone hole break-up in September 2002 as seen by SCIAMACHY on Envisat, J. Atmos. Sci., in press, 2004a. Von Savigny, C., Kokhanovsky, A., Bovensmann, H., Eichmann, K.-U., Kaiser, J., No ¨el, S.,
Rozanov, A. V., Skupin, J., and Burrows, J. P.: NLC Detection and Particle Size Determina-25
tion: First Results from SCIAMACHY on Envisat, Adv. Space Res., in press, 2004b.
Voigt, S., Orphal, J., Bogumil, K., and Burrows, J. P.: The Temperature dependence (203– 293 K) of the absorption cross sections of O3in the 230–850 nm region measured by Fourier-transform spectroscopy, J. Photochem. Photobiol. A, 143, 1–9, 2001.
Wahner, A., Ravishankara, A. R., Sander, S. P., and Friedl, R. R.: Absorption cross section of 30
BrO between 312 and 385 nm at 298 and 223 K, Chem. Phys. Lett., 152, 507–512, 1988. Walker, K. D., Saunders, R. D., Jackson, J. K., and Mc Sparron, D. A.: Spectral Irradiance
ACPD
4, 7631–7665, 2004 Stratospheric Limb measurements F. Weidner et al. Title Page Abstract Introduction Conclusions References Tables Figures J I J I Back CloseFull Screen / Esc
Print Version
Interactive Discussion
EGU
World Meteorological Organization (WMO): Scientific Assessment of ozone depletion 2002: WMO Global Ozone Research and Monitoring Project, No. 47, chap. 7, Geneva, Switzerland, 2002.
ACPD
4, 7631–7665, 2004 Stratospheric Limb measurements F. Weidner et al. Title Page Abstract Introduction Conclusions References Tables Figures J I J I Back CloseFull Screen / Esc
Print Version
Interactive Discussion
EGU
Table 1. Compendium of balloon-borne mini-DOAS measurements and Envisat/SCIAMACHY
overpasses
Date Location Geophys. Cond. Instrument Observation Mode Closest Match Orbit#
Time (UT) SZA range Time (UT) (i)
18/19 Aug. 2002 Kiruna high lat. sum. LPMA/ Nadir 2429: 9:17, 9:19
15:15–2:38 67.9◦N, 21.1◦E 69.75–94.4◦ mini-DOAS fixed Limb 2438: 9:48, 9:51 94.6–88.1◦
4 March 2003 Kiruna high lat. spring LPMA/DOAS Nadir 5272: 9:26, 9:28
12:55–15:25 67.9◦N, 21.1◦E 77.6–88.8◦ mini-DOAS fixed Limb 5273: 11:04, 11:05, 11:07
23 March 2003 Kiruna high lat. spring LPMA/DOAS Nadir 5545: 11:07, 11:10
14:47–17:35 67.9◦N, 21.1◦E 78.9–94.7◦ mini-DOAS fixed Limb during ascent 5558: 9:01 scanning Limb at float
9 Oct. 2003 Aire-sur-l’Adour mid-lat fall LPMA/DOAS Nadir 8407: 11:30
15:39–17:09 43.7◦N, 0.25◦W 66–88◦ mini-DOAS fixed Limb 8421: 9:17
24 March 2004 Kiruna high lat. spring LPMA/DOAS fixed Limb during ascent 10798 13:55–17:35 67.9◦N, 21.1◦E 72–98◦ mini-DOAS scanning Limb at float 10:35 (i) for the closest match orbits (Dorf et al., in preparation, 20041)
1
Dorf, M., Bovensmann, H., Burrows, J. P., Butz, A., B ¨osch, H., Camy-Peyret, C., Chip-perfield, M., Grunow, K., Goutail, F., Hendrick, F., Hrechanyy, S., Naujokat, B., Pommereau, J.-P., Van Roozendael, M., Rozanov, A., Sioris, C., Stroh, F., Weidner, F., and Pfeilsticker, K.: Balloon-borne stratospheric BrO measurements: Intercomparison with ENVISAT/SCIAMACHY BrO limb profiles, Atmos. Chem. Phys. Discuss., in preparation, 2004.
ACPD
4, 7631–7665, 2004 Stratospheric Limb measurements F. Weidner et al. Title Page Abstract Introduction Conclusions References Tables Figures J I J I Back CloseFull Screen / Esc
Print Version
Interactive Discussion
EGU
Fig. 1. Root mean square (1-σ) and peak to peak-to-peak residual structure (5-σ) as a function
of co-added spectra N at 80% illumination level of the CCD array detector for white light of an Ulbricht sphere and skylight. The error indicates the (1-σ) noise actually achieved during the balloon flights.
ACPD
4, 7631–7665, 2004 Stratospheric Limb measurements F. Weidner et al. Title Page Abstract Introduction Conclusions References Tables Figures J I J I Back CloseFull Screen / Esc
Print Version
Interactive Discussion
EGU
Fig. 2. Comparison of measured and simulated Limb radiance at 360 nm (open squares and
dashed line) and 490 nm (filled squares and full line, respectively) for an azimuth angle of 90◦ and an elevation angle of+0.5◦during balloon ascent over Kiruna on 23 March 2003.
ACPD
4, 7631–7665, 2004 Stratospheric Limb measurements F. Weidner et al. Title Page Abstract Introduction Conclusions References Tables Figures J I J I Back CloseFull Screen / Esc
Print Version
Interactive Discussion
EGU
Fig. 3. Comparison of measured (filled squares) and forward modelled (open squares) Limb
radiances at 490 nm for the Kiruna 23 March 2003, balloon flight at balloon float altitude (30.3– 32.2 km). The figure shows 5 Limb profiling scans consisting of up to 13 individual observations each. The height labels denote the tangent heights of the observation.
ACPD
4, 7631–7665, 2004 Stratospheric Limb measurements F. Weidner et al. Title Page Abstract Introduction Conclusions References Tables Figures J I J I Back CloseFull Screen / Esc
Print Version
Interactive Discussion
EGU
Fig. 4. Sample DOAS
eval-uation of ozone in the wave-length interval 490–520 nm for a Limb observation at float alti-tude in Limb scanning mode (at 31 620 km altitude, an elevation angle of −5.5◦, azimuth angle of 90◦, and SZA=89.9◦) for the Kiruna flight on 23 March 2003. Shown is the retrieved slant column amount of O3, NO2, Ring (thick lines) and the latter plus the residual structure (thin lines). The upper two traces show the measured (thick line) and the Fraunhofer (thin line) spectra, the latter is recorded at an altitude of 29 746 km, an ele-vation angle of 0.5◦, an azimuth angle of 90◦, and SZA=88.5◦.
ACPD
4, 7631–7665, 2004 Stratospheric Limb measurements F. Weidner et al. Title Page Abstract Introduction Conclusions References Tables Figures J I J I Back CloseFull Screen / Esc
Print Version
Interactive Discussion
EGU
Fig. 5. same as Fig. 4 but for the NO2 evaluation in the 400–450 nm wavelength interval
and a Limb observation (at 30 940 km altitude, −3.5◦ elevation angle, 90◦ azimuth angle and SZA=89.4◦) for the Kiruna flight on 23 March 2003.
ACPD
4, 7631–7665, 2004 Stratospheric Limb measurements F. Weidner et al. Title Page Abstract Introduction Conclusions References Tables Figures J I J I Back CloseFull Screen / Esc
Print Version
Interactive Discussion
EGU
Fig. 6. same as Fig. 4 but for the BrO evaluation in the 347–358 nm wavelength interval
and a Limb observation (at 26 439 km altitude, −1.5◦ elevation angle, 90◦ azimuth angle and SZA=82.9◦) for the Kiruna flight on 24 March 2004.
ACPD
4, 7631–7665, 2004 Stratospheric Limb measurements F. Weidner et al. Title Page Abstract Introduction Conclusions References Tables Figures J I J I Back CloseFull Screen / Esc
Print Version
Interactive Discussion
EGU
Fig. 7. Comparison of Limb (90◦ azimuth angle and 0.5◦ elevation angle) measured (filled
squares)and forward modelled O3-SCDs using the ozone measurements from two ECC-sondes deployed on the same gondola (full line), and flown stand-alone ∼3 h after the LPMA/DOAS launch (dotted line) for the Kiruna 23 March 2003 flight.
ACPD
4, 7631–7665, 2004 Stratospheric Limb measurements F. Weidner et al. Title Page Abstract Introduction Conclusions References Tables Figures J I J I Back CloseFull Screen / Esc
Print Version
Interactive Discussion
EGU
ACPD
4, 7631–7665, 2004 Stratospheric Limb measurements F. Weidner et al. Title Page Abstract Introduction Conclusions References Tables Figures J I J I Back CloseFull Screen / Esc
Print Version
Interactive Discussion
EGU
Fig. 9. Comparison of inferred O3 profiles from (a) Limb observations (filled squares) at an
azimuth angle of 90◦and elevation angle of 0.5◦, (b) the direct sunlight DOAS measurements (open circles), and two ECC ozone sondes (c) one deployed on the same gondola (full line) and (d) from the stand-alone launched ECC-sonde for the Kiruna, 23 March 2003 flight.
ACPD
4, 7631–7665, 2004 Stratospheric Limb measurements F. Weidner et al. Title Page Abstract Introduction Conclusions References Tables Figures J I J I Back CloseFull Screen / Esc
Print Version
Interactive Discussion
EGU
Fig. 10. Comparison of inferred NO2 profiles from (a) Limb observations (filled squares)
for an azimuth angle of 90◦ and elevation angle of 0.5◦, and (b) from direct sunlight DOAS measurements (open circles) during balloon ascent at Kiruna on 23 March 2003.
ACPD
4, 7631–7665, 2004 Stratospheric Limb measurements F. Weidner et al. Title Page Abstract Introduction Conclusions References Tables Figures J I J I Back CloseFull Screen / Esc
Print Version
Interactive Discussion
EGU
Fig. 11. Comparison of inferred BrO profiles from (a) Limb observations (filled squares)
for an azimuth angle of 90◦ and elevation angle of −1.5◦, and (b) from direct sunlight DOAS measurements (open circles) during balloon ascent at Kiruna on 24 March 2004.
ACPD
4, 7631–7665, 2004 Stratospheric Limb measurements F. Weidner et al. Title Page Abstract Introduction Conclusions References Tables Figures J I J I Back CloseFull Screen / Esc
Print Version
Interactive Discussion
EGU
Fig. 12. Comparison of measured (filled squares) and forward modelled (open squares) Limb
absorption of ozone for the Kiruna flight on 23 March 2003. The height labels denote the tangent heights of the observation.