aViola Günther and Daniel Mueller contributed equally to this work.
*Corresponding author: Dr. Lanja Saleh, Institute of Clinical
Chemistry, University Hospital of Zurich, Raemistr. 100, 8091 Zurich, Switzerland, Phone: +41 44 255 22 93, Fax: +41 44 255 45 90, E-mail: [email protected]
Viola Günther, Daniel Mueller and Arnold von Eckardstein: Institute
of Clinical Chemistry, University Hospital of Zurich, Switzerland
Viola Günther
a, Daniel Mueller
a, Arnold von Eckardstein and Lanja Saleh*
Head to head evaluation of the analytical
performance of two commercial methotrexate
immunoassays and comparison with liquid
chromatography-mass spectrometry and the
former fluorescence polarization immunoassay
DOI 10.1515/cclm-2015-0578Received June 19, 2015; accepted August 26, 2015; previously published online October 10, 2015
Abstract
Background: Monitoring of plasma drug levels is manda-tory in patients receiving high-dose methotrexate. This study evaluated the analytical performance of the novel Architect and the established ARK™ methotrexate
immu-noassay (running on the Roche Cobas© c502 analyzer) in
comparison with liquid chromatography-mass spectrom-etry (LC-MS) and the TDx/TDxFLx Methotrexate II assay. Methods: Imprecision and linearity were verified for the Architect and ARK assay according to CLSI EP15-A3 and EP6-A guidelines, respectively. The reported limit of quantitation (0.04 μmol/L) was tested for both assays according to the CLSI EP17-A2 guideline. Correlation and agreement between the different assays were evaluated using residual plasma samples (n = 153).
Results: Total imprecision was < 6.3% and < 9.5% for the Architect and ARK assay, respectively. The claimed linear-ity and limit of quantitation were confirmed for the Archi-tect assay. For the ARK assay, imprecision at the limit of quantitation was < 18% with a positive bias resulting in a high total error up to 58%, and hence the linearity could not be confirmed. Both assays showed strong correla-tions with the TDX assay and LC-MS but a positive bias of 12.2% and 20.5% in comparison to LC-MS for the Architect and ARK assay, respectively. For the ARK assay this bias increased dramatically for samples with concentrations towards the limit of quantitation.
Conclusions: The Architect assay is suitable for moni-toring plasma methotrexate, but the ARK assay showed unsatisfactory performance in the analysis of low concen-trated samples. Unlike the TDX assay, both assays require manual dilution of samples at higher concentrations, which delays sample processing in clinical routine. Keywords: high dose methotrexate; liquid chromatogra-phy mass spectrometry; immunoassay; method valida-tion; therapeutic drug monitoring.
Introduction
Methotrexate (MTX) is a folate antagonist used at high dosage (HDMTX) in the treatment of a variety of malignant diseases, including leukemia, lymphoma and osteosar-coma. However, HDMTX is nephrotoxic due to precipita-tion of the drug in the kidney. This adverse effect can be counteracted by hydration and urine alkalization. In the
HDMTX regimen, a lethal dose of MTX ( ≥ 500 mg/m2) is
administered by infusion over 4–36 h, and MTX toxicity is reduced by “rescue” with reduced folates (leucovorin or folinic acid) 24–36 h after the start of treatment.
Therapeutic drug monitoring (TDM) is used to guide timing, dosage and continuation of leucovorin rescue to prevent excessive toxicity during HDMTX treatment: if plasma MTX concentrations exceed 5–10 μmol/L at 24 h, 0.9–1 μmol/L at 48 h or 0.1 μmol/L at 72 h, leucovorin dosing and intravenous hydration must be increased to prevent severe toxicity [1, 2]. If MTX clearance is severely compromized and plasma MTX levels grossly exceed these limits, administration of glucarpidase (carboxypeptidase
G2, Voraxaze®), which cleaves MTX to the inactive
metab-olite 2,4-diamino-N-methylpteroic acid (DAMPA), can rapidly lower circulating MTX levels.
Current methods for the measurement of MTX include enzymatic and immunological assays as well as
chromatographic techniques [3]. However, the partially active metabolite 7-hydroxymethotrexate (7-OHMTX) or DAMPA can strongly interfere with immunoassays [4, 5], and the high cross-reactivity with DAMPA limits the use of immunoassays to monitor glucarpidase rescue. In our lab-oratory, MTX has been measured by means of the Abbott TDx/TDxFLx methotrexate II assay for more than 20 years, but in 2014 this assay was replaced by the manufacturer with a chemiluminescence microparticle immunoassay (CMIA) running on Abbott Architect immunoassay plat-forms. The aim of this study was to evaluate the analyti-cal performance of both the novel Architect methotrexate assay and the established ARK™ methotrexate assay
running on the Roche Cobas® c502 analyzer, which is
distributed as a Roche partner channel reagent since 2014, in comparison with the former TDX assay and a liquid chromatography-mass spectrometry (LC-MS) method.
Materials and methods
LC-MS analysisMTX and the internal standard methotrexate-d3 were purchased from Cerilliant (Round Rock, TX, USA) and 7-OHMTX from TRC (ON, USA). Ammonium acetate was purchased from Scharlau (Taegerig, Switzerland), formic acid and acetone from Merck ( Darmstadt, Germany), methanol and 2-propanol from Honeywell Seelze (Seelze, Germany) and acetonitrile from Romil (Cambridge, UK). All solvents and reagents were of high performance liquid chromatography (HPLC) grade.
Standard samples, prepared by adding specified amounts of MTX (0.01, 0.06, 0.22, 1.10, 2.20, 5.51, 11.01 μmol/L) and 7-OHMTX (0.01, 0.05, 0.21, 1.06, 2.13, 5.32 and 10.64 μmol/L) to drug-free con-trol plasma, were used to establish the calibration curve. Four spiked plasma samples with known concentrations of MTX and 7-OHMTX and four diluted patient samples were used as quality control sam-ples. Samples were prepared by adding 30 μL methanol containing 10.9 μmol/L internal standard to 200 μL of patient sample, standard or control sample, vortexing and centrifugation at 16,100 g for 10 min at 4 °C. The supernatant was transferred into autosampler vials, which were stored in the cooled sample stack at 10 °C until analysis. Ten micro liter of each sample were injected into the system: blank samples were included after samples with high MTX concentrations.
The HPLC system consisted of a Transcend TLX-1 HTLC online extraction system with two Accela 600 pumps, an HTC PAL autosampler and a valve interface module with built-in switching valves, all controlled by Aria (version 1.6.2) software (all from Thermo Fisher Scientific, MA, USA). A Cyclone column (50 × 0.5 mm, 50 μm particle size) was used for turbulent flow chromatography online extraction, and analytical separation was achieved on an Uptisphere C18 column (125 × 2.1 mm, 5 μm particle size). Chromatography was performed at room temperature (approx. 24 °C), and the LC flow was diverted into waste between 0 and 4 min and 7 and 10 min, using a divert valve. The LC method is summarized in Supplementary Table 1.
Mass spectrometric analysis was performed on a Q Exactive hybrid instrument controlled by Tune (version 2.2 SP1) and XCali-bur (version 2.2 SP 1.48) software (all from Thermo Fisher Scientific, MA, USA). As the ionization interface, heated electro spray ioniza-tion (HESI) was used with the following parameters: sheath gas 70 arbitrary units (AU), auxiliary gas 20 AU, sweep gas 5 AU and spray voltage 5 kV. The capillary and heater temperatures were maintained at 270 °C and 320 °C, respectively. Detection was done in the positive full-scan mode with a resolution of 70,000 full width at half maxi-mum (calculated for m/z 200). For quantification, extracted ion chro-matograms with a window of 10 ppm of the singly charged pseudo molecular ions [M+H]+ were used. The following calculated exact masses were used: m/z 455.17859 for MTX, m/z 471.17351 for 7-OHMTX and m/z 458.19742 for the internal standard MTX-d3.
To validate the performance of the LC-MS method, quality con-trol samples and diluted patient samples were analyzed six times on the same day to calculate within-day inaccuracy and imprecision and on six different days to calculate between-day inaccuracy and imprecision. To estimate the limit of quantitation, the imprecision at the lowest standard (0.01 μmol/L), which is ten times lower than the concentration at which leucovorin treatment should be stopped, was determined (10 measurements on 3 days).
Matrix effects were evaluated using the post-column infusion method, as described by Bonfiglio et al. [6]. A solution containing MTX, 7-OHMTX and MTX-d3, at concentrations of 0.96, 0.92 and 1.42 μmol/L, respectively, was infused into the column effluent at a flow rate of 10 μL/min. Concurrently, eight samples, including hemo-lytic, icteric and lipemic samples, were prepared as described above, but without internal standard in the precipitation solution, and the resulting chromatograms were examined for regions showing ion suppression or enhancement.
Samples (four quality control samples and 2 patient samples) were left at room temperature for 2 days (exposed to or protected from light) to evaluate sample stability. The stability of samples after preparation was tested by re-injecting previously prepared controls and patient samples that were stored in the cooled autosampler stack at 10 °C for 2 days. Additionally, freshly prepared quality control samples and three fresh patient samples were subjected to three freeze/thaw cycles.
Immunoassays
Methotrexate concentrations were determined by a fluorescence polarization immunoassay (TDx/TDxFLx Methotrexate II, Abbott Laboratories), chemiluminescence microparticle immunoassay (Architect Methotrexate, Abbott Laboratories) and a homogeneous enzymatic immunoassay (ARK™ methotrexate assay, ARK Diagnos-tics) on Cobas® c502 (Roche Diagnostics). Performance characteristics of these assays, as reported in the package inserts, are summarized in Table 1. Processing and storage of reagents, calibrators and control materials, operation of the instruments and all measurements were performed according to the manufacturers’ instructions. During the evaluation, reagents, calibrators and control materials from single production batches were used.
Samples were equilibrated to 18–25 °C and mixed gently prior to measurement. The performance of each instrument was assessed by running quality control samples before patient samples in each assay run. Samples exceeding the standard range were diluted according to the manufacturers’ protocols: for the Architect assay, the extended
range control samples provided by the manufacturer were processed in parallel to ensure the accuracy of sample dilution.
Sample sources and handling
Residual heparin plasma samples (n = 153) were collected follow-ing routine measurement with the TDX assay and stored at –20 °C. Samples with extensive hemolysis, lipemia or bilirubinemia were excluded from the analysis. All samples were thawed, aliquoted and stored at –20 °C until analysis with each of the four assay systems. Repeated measurements of MTX levels with the TDX assay showed that MTX concentrations were stable over 12 months when stored at –20 °C, with two freeze-thaw cycles (data not shown). The reuse of remnant samples was approved by the local Zürich Cantonal Ethical Committee.
Imprecision and accuracy
Assay imprecision was determined according to the Clinical and Lab-oratory Standards Institute (CLSI) EP15-A3 guideline [7]. Imprecision was assessed using three levels of the manufacturers’ control materi-als within the relevant calibration range and plasma samples diluted with blank plasma from a healthy subject to three concentrations ranging between 0.02 and 1 μmol/L. Measurements were performed over 5 days, with one run per day and five replicates per run. The Architect assay kit includes three high-level controls, which exceed the measurement range and require manual dilution. As manual dilution may introduce an additional source of error, which does not reflect the instrument performance, we did not include these controls in the assessment of precision. However, they were included when-ever dilution of patient samples was necessary (see above). Accuracy was determined from the reported concentrations of the quality con-trol samples and by comparison with LC-MS measurements.
Linearity
The reported linearity was verified according to the National Committee on Clinical Laboratory Standards (NCCLS) guideline EP6-A [8], using a dilution series of six concentrations within the calibration range of each immunoassay (Table 1). Dilutions were
prepared with two plasma pools spiked with low or high concentra-tions of MTX, and measurements were performed in duplicate within a single run. Polynomial regression analysis was performed for the first-, second- and third-order polynomials. Acceptance criteria were non-significance (p > 0.05) of the nonlinear coefficients or, if a statisti-cally significant non-linearity was detected, a deviation from linear-ity lower than the manufacturer’s claim for imprecision.
Limit of quantitation (LOQ)
The sensitivity claimed by the manufacturer was verified using four different spiked plasma samples at the reported LOQ (0.04 μmol/L). Each sample was measured in triplicate in three runs according to the CLSI EP17-A2 guideline [9], resulting in a total of 36 measure-ments at the claimed LOQ.
Method comparison
Residual heparinized plasma samples were analyzed with the TDX, Architect, ARK immunoassay and LC-MS, with one replicate each.
Statistical analyses
Agreement between methods was estimated using Passing Bablok regression analysis [10], Bland-Altman difference plots [11] and Pear-son’s correlation coefficient: samples below the LOQ of the immuno-assays were excluded from the statistical analyses. All calculations were determined using Analyse-it software (Analyse-it Software) on Microsoft Excel 14.0 (Microsoft).
Results
LC-MS method
The calibration curve was stable throughout the evaluation period and was linear over an MTX concentration range of Table 1: Assay specifications according to package inserts.
TDx/TDxFLx methotrexate II Architect methotrexate ARK™ MTX immunoassay
Method Fluorescence polarization
immunoassay (FPIA) Chemiluminescence microparticle immunoassay (CMIA) Homogeneous enzyme immunoassay Measuring range 0.02–1.0 μmol/L 0.04–1.5 μmol/L 0.04–1.2 μmol/L
LOQ Not specified 0.04 μmol/L 0.04 μmol/L
Assay duration Not measured 18 min 10 min
Cross reactivities
7-OHMTX 0% 0% None ( ≤ 0.07%)
DAMPA 26%/59%a 46%/83%b 64.3%/100%c
0.01–11.01 μmol/L. The coefficient of determination (R2), as
an indicator of the goodness of fit of the calibration curve, was consistently above 0.998. By contrast, the curve was quadratic for 7-OHMTX over a concentration range of 0.01– 10.64 μmol/L, with a coefficient of determination > 0.994. Bias and imprecision of the LC-MS method are summa-rized in Table 2. The imprecision and bias at the lowest calibrator (0.01 μmol/L) was 2.5% and –0.2%, respectively. Analysis of eight blank samples showed no relevant matrix effect. MTX concentrations in control and patient samples were stable for 48 h at room temperature irrespectively if protected from light or not (accuracy 99%–105%) and samples after preparation were stable for at least 48 h in
the cooled autosampler (accuracy 101%–105%). Accuracy after three freeze thaw cycles was between 97% and 101% for spiked control and patient samples.
Imprecision and accuracy
The within-run (repeatability), between-run and total (within-laboratory) imprecisions are summarized in Table 3. The Architect assay showed a total impreci-sion < 5.1% and < 6.3% for quality control materials and human plasma, respectively, consistent with the manu-facturer’s claimed value of < 7.5%. Total imprecision for
Table 2: Imprecision and inaccuracy of the LC-MS method.
Sample L1 L2 L3 L4 HP1 HP2 HP3 HP4 Target, μmol/L 0.04 0.44 4.41 8.81 – – – – Mean, μmol/L Within run (n = 6) 0.05 0.44 4.29 8.70 0.07 0.30 0.88 7.91 Between run (n = 6) 0.05 0.45 4.34 8.81 0.08 0.30 0.89 7.91 Bias, % Within run (n = 6) 4 –1 –3 –1 – – – – Between run (n = 6) 6 1 –2 0 – – – – Imprecision, % Within run (n = 6) 2.1 1.5 1.1 0.5 1.1 1.0 0.5 1.9 Between run (n = 6) 1.0 0.8 1.6 1.6 2.0 1.7 1.4 0.6
L1–L4, Quality control level 1–4; HP1–HP4, diluted patient plasma samples.
Table 3: Imprecision and inaccuracy verification of the Architect and ARK MTX assay.
Sample Low Med High HP1 HP2 HP3
Architect MTX
Mean concentration, μmol/L 0.08 0.46 1.00 0.08 0.32 0.89
Target concentration, μmol/L 0.07 0.45 1.00 0.08 0.30 0.89
Bias, % 14 3 0 12 8 0
Imprecision, %a
Within laboratory (total precision) 5.1 3.0 2.5 6.3 5.0 3.8
Repeatability (within run) 5.0 2.6 2.5 6.3 5.0 3.4
Between run 1.1 1.5 0.4 0.0 0.0 1.7
ARK MTX
Mean concentration, μmol/L 0.08 0.39 0.81 0.09 0.27 1.02
Target concentration, μmol/L 0.07 0.40 0.80 0.08 0.30 0.89
Bias, % 9 –3 1 20 –10 14
Imprecision, %a
Within laboratory (total precision) 9.5 2.1 5.0 6.0 2.3 6.5
Repeatability (within run) 7.4 2.1 3.0 5.9 2.3 6.0
Between run 5.9 0.0 4.1 1.2 0.0 2.7
Low, med, high: quality control material; HP1–HP3: diluted patient plasma samples (target value was determined by LC-MS). aImprecision claims of the manufacturers are for the Architect assay < 7.5% total CV (all concentrations) and for the ARK assay ≤ 10% total CV for samples > 0.1 μmol/L and a SD ≤ 0.01 for samples ≤ 0.1 μmol/L.
the ARK assay was < 9.5% for quality control materials and < 6.5% for human plasma, compared with a claimed value of < 10% (or a standard deviation of < 0.01 μmol/L for values < 1 μmol/L).
The accuracy of both the Abbott and the ARK assays was evaluated using quality control materials and human plasma samples at three concentrations each. Both assays showed higher bias at lower concentrations (Table 3). For the ARK assay, a positive drift of low control values was observed during the evaluation period, which necessi-tated frequent re-calibration of the assay every 3–5 days. By contrast, the Abbott assay showed a stable perfor-mance over 4.5 months study period.
Linearity
The Architect assay was shown to be linear over the given measurement range (0.04–1.5 μmol/L): none of the non-linear coefficients of the second and third order polyno-mials was significant (p > 0.05). The maximum difference was 3.4% between the linear and quadratic model and 6.1% between the linear and the third order polynomial model (Supplementary Figure 1A and B).
For the ARK assay, the third order polynomial fit was significantly better than the linear fit, with a maximum difference of 0.017 μmol/L (48.1%) at the lowest concen-tration (0.055 μmol/L) (Supplementary Figure 1C and D). This is higher than the manufacturer’s reported error of 0.01 μmol/L at concentrations < 0.1 μmol/L and is consist-ent with the high bias of samples at the reported LOQ of 0.04 μmol/L (see below).
Limit of quantitation
The LOQ of the Architect assay could be verified at the reported limit of 0.04 μmol/L using spiked plasma samples from four control donors (Table 4). All data were consist-ent with the manufacturer’s claimed total error of < 25%. For the ARK assay, total error at the LOQ is not stated in the package insert (the LOQ was defined as LOQ–2 SD > LOD). All four samples had an acceptable coefficient of variation, of < 18%, but a bias of up to 0.019 μmol/L was observed, resulting in a total error of up to 58% (Table 4).
Method comparison
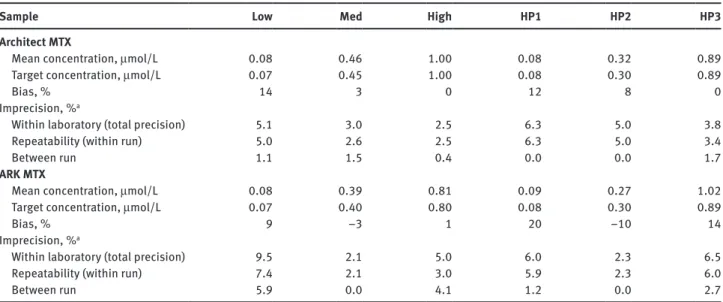
The comparison of MTX levels measured by the Architect assay, compared with those measured by the TDX assay
and the LC-MS method is shown in Figure 1. There were strong correlations between the Architect assay and the LC-MS and TDX assays, with a Pearson’s correlation coef-ficient of 0.999 for both comparisons (Figure 1A and E). If only samples within the measuring range of the Architect assay were analyzed, the Pearson’s correlation coefficient was 0.996 and 0.995 for the LC-MS and TDX assay, respec-tively (Figure 1B and F). Compared with the LC-MS method, the Architect assay showed a slight positive bias, with a slope of 1.08 [95% confidence interval (CI) 1.06–1.09] and an intercept of 0.02 (95% CI 0.01–0.02). The Bland-Altman plot revealed a positive bias of 12.2% at concentrations up to 500 μmol/L (Figure 1C) and 14.7% for concentrations below 1.5 μmol/L (Figure 1D). The Architect and the TDX assay showed a good agreement in the Passing-Bablok analysis (slope 1.00, 95% CI 0.98–1.03; intercept 0.00, 95% CI 0.00–0.01; Figure 1E) and in the Bland-Altman plot (mean difference 1.3%, Figure 1G).
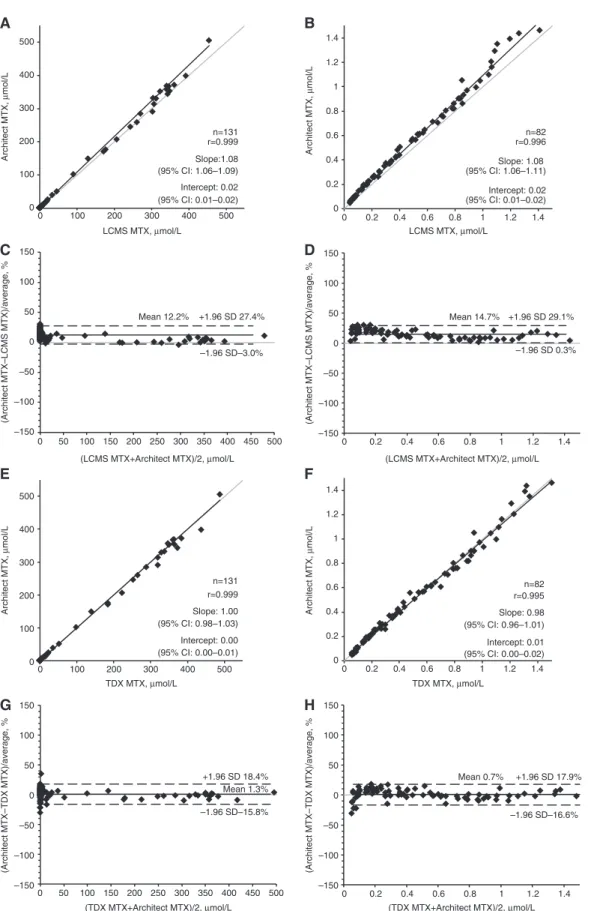
There was also a highly significant correlation between the ARK assay and LC-MS, with Pearson’s cor-relation coefficients of 0.999 overall (Figure 2A) and 0.990 for samples within the calibration range (Figure 2B). For all samples up to 500 μmol/L, the ARK assay showed good agreement with LC-MS in Passing-Bablok regres-sion analysis, with a slope of 1.00 (95% CI 0.97–1.02) and an intercept of 0.04 (95% CI 0.04–0.06). However, the Bland-Altman plot revealed a mean positive bias of 20.5%, which decreased to 8.6% and 1.1% when only samples above 0.2 μmol/L and 1.2 μmol/L, respectively, were compared (data not shown). For samples within the calibration range (up to 1.2 μmol/L), the mean posi-tive bias was 33.5%, and this figure increased for samples below 0.2 μmol/L (Figure 2D). Furthermore, compared with the previous TDX assay, there was a positive bias of 7.1% in the Bland-Altman analysis (Figure 2G), which was more pronounced for samples within the calibration range (Figure 2H). There was a highly significant corre-lation between the two methods (Pearson’s correcorre-lation coefficient 1.000, Figure 2E), but Passing-Bablok regres-sion analysis revealed a negative bias for samples with high MTX concentrations and a positive bias for samples within the calibration range (Figure 2E and F).
We also measured 7-OHMTX concentrations by LC-MS in 105 patient samples. For both assays we could not detect any strong correlation between the overestimation of MTX concentrations by the immunoassays and the 7-OHMTX concentration (data not shown). Significant cross-reactiv-ity to the MTX metabolite 7-OHMTX has been reported for an enzyme-multiplied immunoassay [4].
Discrepant results were obtained with the four methods for three samples, which were taken from the
–150 –100 –50 0 50 100 150 –150 –100 –50 0 50 100 150 –150 –100 –50 0 50 100 150 –150 –100 –50 0 50 100 150 0 50 100 150 200 250 300 350 400 450 500 0 50 100 150 200 250 300 350 400 450 500 (Architect MTX–LCMS MTX)/average, % (Architect MTX–LCMS MTX)/average, % (Architect MTX–TDX MTX)/average, % (Architect MTX–TDX MTX)/average, % (LCMS MTX+Architect MTX)/2, µmol/L
(TDX MTX+Architect MTX)/2, µmol/L (TDX MTX+Architect MTX)/2, µmol/L
(LCMS MTX+Architect MTX)/2, µmol/L 0 100 200 300 400 500 0 100 200 300 400 500 0 100 200 300 400 500 0 100 200 300 400 500 Architect MTX, µmol/L Architect MTX, µmol/L Architect MTX, µmol/L Architect MTX, µmol/L LCMS MTX, µmol/L TDX MTX, µmol/L TDX MTX, µmol/L LCMS MTX, µmol/L 0 0.2 0.4 0.6 0.8 1 1.2 1.4 0 0.2 0.4 0.6 0.8 1 1.2 1.4 0 0.2 0.4 0.6 0.8 1 1.2 1.4 0 0.2 0.4 0.6 0.8 1 1.2 1.4 0 0.2 0.4 0.6 0.8 1 1.2 1.4 0 0.2 0.4 0.6 0.8 1 1.2 1.4 n=131 r=0.999 Slope:1.08 (95% CI: 1.06–1.09) Intercept: 0.02 (95% CI: 0.01–0.02) n=82 r=0.996 Slope: 1.08 (95% CI: 1.06–1.11) Intercept: 0.02 (95% CI: 0.01–0.02) n=82 r=0.995 Slope: 0.98 (95% CI: 0.96–1.01) Intercept: 0.01 (95% CI: 0.00–0.02) n=131 r=0.999 Slope: 1.00 (95% CI: 0.98–1.03) Intercept: 0.00 (95% CI: 0.00–0.01) Mean 14.7% +1.96 SD 29.1% –1.96 SD 0.3% Mean 0.7% +1.96 SD 17.9% –1.96 SD–16.6% Mean 1.3% +1.96 SD 18.4% –1.96 SD–15.8% Mean 12.2% +1.96 SD 27.4% –1.96 SD–3.0% H E F C G B D A
Figure 1: Method comparison with Passing-Bablok regression and Bland-Altman analysis of the Architect MTX assay vs. LC-MS (A–D) and
the TDX MTX assay (E–H).
same patient on three consecutive days. On examining the clinical records, it was found that the patient had been treated with glucarpidase. The product of glucarpi-dase action, DAMPA, shows high cross-reactivity with all three immunoassays (Table 1) and measurement of such samples is not recommended by the manufacturers. Over-estimation of MTX concentration was highest for the ARK assay (up to 140-fold) and up to 80-fold for the Architect and TDX assay (data not shown). However, in the Archi-tect package insert it is noted, that 48 h after glucarpi-dase treatment patient samples can be measured with the assay, but we still found a 40-fold overestimation of MTX levels by the Architect assay in the 48 h sample.
Discussion
In this study we assessed the analytical performance of two immunological assays for the determination of MTX in human plasma samples and compared it with the former Abbott TDx/TDxFLx fluorescence polarization immunoas-say and the LC-MS method. Imprecision of the Architect and ARK immunoassay was determined with the respec-tive control materials and patient samples at three dilution levels. For both assays, imprecision was lower than the maximal values claimed in the package inserts: maximum imprecision for the lowest concentration sample was 6.3% for the Architect assay and 9.5% for the ARK assay.
We could confirm linearity up to 1.5 μmol/L and a LOQ of 0.04 μmol/L for the Architect assay. The ARK immunoassay was not linear over the specified calibra-tion range; deviacalibra-tions from linearity were acceptable for concentrations > 0.25 μmol/L, but the deviation was too high at lower concentrations. A bias could also be seen when we attempted to verify the LOQ: while imprecision
at the reported LOQ (0.04 μmol/L) was acceptable ( < 18%) we observed a high positive bias of approximately 25%, resulting in a mean total error of 43%.
Correlations between the assays were evaluated using remnant patient samples. While Pearson’s correlation coefficients were consistently high, we observed a posi-tive bias of the immunoassays, compared with the LC-MS method, as judged by Passing-Bablok regression and Bland-Altman plots. For the ARK assay, this bias was only evident at concentrations below 1.2 μmol/L (+33.5%), with a positive trend for samples close to the LOQ. The Archi-tect assay showed a mean positive bias of +12.2% across all measured concentrations. Because leucovorin treat-ment is usually stopped when MTX concentrations are between 0.05 and 0.2 μmol/L, overestimation of MTX con-centrations below 0.2 μmol/L, as seen by the ARK assay, may lead to unnecessary prolongation of leucovorin treatment in patients treated with HDMTX. Our data are in agreement with the results of Godefroid et al. [12], who also observed a high total error at low concentrations with
the ARK immunoassay running on Roche Cobas® c502, but
not on Architect ci8200. We do not know if similar prob-lems exist in other laboratories, or whether adjustments of the instrument or assay settings that are not currently offered by the manufacturers could eliminate this error.
Both the Architect and the ARK immunoassay require a three-step manual dilution of samples above the cali-bration range to cover the wide range of plasma MTX concentrations encountered during HDMTX therapy. The manual dilution protocol is time-consuming and therefore delays the processing of samples for which the reporting of results might be time-critical, and is also a possible source of error. A fully automated dilution, as used in the TDX assay, is desirable for future applications. At present, a decision has to be made whether to dilute all samples and accept the higher time and reagent costs, or to dilute Table 4: Verification of the LOQ of the Architect and ARK MTX assay.
Sample Architect MTX ARK MTX
S1 S2 S3 S4 S1 S2 S3 S4
Target value, μmol/L 0.041 0.039 0.039 0.042 0.041 0.039 0.039 0.042 Mean, μmol/L 0.043 0.042 0.040 0.043 0.059 0.044 0.049 0.048 SD, μmol/L 0.002 0.002 0.002 0.002 0.004 0.008 0.004 0.005 CV, % 4.5 4.9 5.0 4.8 6.7 18.0 8.5 10.3 Bias, μmol/L 0.003 0.003 0.001 0.001 0.019 0.005 0.010 0.006 Bias, % 7.0 7.1 3.7 2.8 46.8 13.7 24.5 15.4 Total error, % 14.4 15.2 11.9 10.8 57.9 43.3 38.5 32.3
Four different control plasma samples (S1–S4) were spiked with MTX to the reported LOQ (0.04 μmol/L). Nine aliquots of each sample were measured in triplicate on 3 days. The target value was determined by LC-MS. Total error was calculated as |bias|+1.65SD.
0 n=142 r=0.999 Slope: 1.00 (95% CI: 0.97–1.02) Intercept: 0.04 (95% CI: 0.04–0.06) n=89 r=0.990 Slope: 1.14 (95% CI: 1.10–1.19) Intercept: 0.03 (95% CI: 0.02–0.03) n=89 r=0.990 Slope: 1.04 (95% CI: 1.00–1.08) Intercept: 0.02 (95% CI: 0.01–0.03) n=142 r=1.000 Slope: 0.93 (95% CI: 0.91–0.97) Intercept: 0.03 (95% CI: 0.02–0.05) Mean 33.5% +1.96 SD 88.2% –1.96 SD–21.1% Mean 15.6% +1.96 SD 51.0% –1.96 SD–19.8% Mean 7.1% +1.96 SD 44.1% –1.96 SD–29.8% Mean 20.5% +1.96 SD 75.9% –1.96 SD–34.9% H E F C G B D A 0 50 100 150 200 250 300 350 400 450 500 0 50 100 150 200 250 300 350 400 450 500
(TDX MTX+ARK MTX)/2, µmol/L (TDX MTX+ARK MTX)/2, µmol/L
0 0.2 0.4 0.6 0.8 1 1.2 1.4 0 0.2 0.4 0.6 0.8 1 1.2 1.4 0 0.2 0.4 0.6 0.8 1 1.2 0 0.2 0.4 0.6 0.8 1 1.2 1.4 (LCMS MTX+ARK MTX)/2, µmol/L (LCMS MTX+ARK MTX)/2, µmol/L TDX MTX, µmol/L TDX MTX, µmol/L LCMS MTX, µmol/L LCMS MTX, µmol/L (ARK MTX–TDX MTX)/average, % –150 –100 –50 0 50 100 150 (ARK MTX–LCMS MTX)/average, % –150 –100 –50 0 50 100 150 (ARK MTX–TDX MTX)/average, % –150 –100 –50 0 50 100 150 100 200 300 400 500 0 100 200 300 400 500 ARK MTX, µ mol/ L ARK MTX, µmol/L ARK MTX, µmol/L ARK MTX, µ mol/ L (ARK MTX–LCMS MTX)/average, % –150 –100 –50 0 50 100 150 0 0.2 0.4 0.6 0.8 1 1.2 1.4 0 0.2 0.4 0.6 0.8 1 1.2 1.4 0 100 200 300 400 500 0 100 200 300 400 500
Figure 2: Method comparison with Passing-Bablok regression and Bland-Altman analysis of the ARK MTX assay vs. LC-MS (A–D) and the
TDX MTX assay (E–H).
only those samples that are above the calibration range (approx. 30% of all samples in our laboratory) and accept the resulting higher turnaround time.
Three samples showed significant differences in MTX levels between the three immunoassays and the LC-MS method. These samples originated from a patient who received glucarpidase treatment, resulting in the accumu-lation of high levels of the MTX metabolite DAMPA. LC-MS analyses revealed significantly lower MTX levels in these samples, compared with the immunoassays, which sug-gests that only a highly specific technique such as LC-MS is suitable for the measurement of MTX in patients treated with glucarpidase.
In conclusion, the Architect assay showed satisfactory performance, which fulfilled all manufacturer claims. The assay was found to be very stable, requiring only a single calibration during 4.5 months study period, and there-fore the assay performance is well suited for routine MTX measurement in clinical samples. By contrast, the ARK
immunoassay running on Roche Cobas® 502 showed an
inadequate performance in the measurement of low con-centrated samples, in addition to the high assay instabil-ity necessitating new calibrations every 3–5 days during the evaluation period. Considering the fact that a total of 15 reactions are needed for calibration and controls, this has a high impact on the costs of each reported result. For these reasons, we have adopted the Architect assay for the routine measurement of plasma MTX in our laboratory. Acknowledgments: We are grateful to Abbott Diagnostics and ARK Diagnostics for having provided their reagents for this study free of charge. We thank Anuschka Bec-cato, Eva Wick-Vokurka, Tanja Wiedemann and Thomas Schärer from Institute of clinical chemistry for their excel-lent technical assistance.
Author contributions: All the authors have accepted responsibility for the entire content of this submitted manuscript and approved submission.
Research funding: None declared.
Employment or leadership: None declared. Honorarium: None declared.
Competing interests: The funding organization(s) played no role in the study design; in the collection, analysis, and interpretation of data; in the writing of the report; or in the decision to submit the report for publication.
References
1. Stoller RG, Hande KR, Jacobs SA, Rosenberg SA, Chabner BA. Use of plasma pharmacokinetics to predict and prevent metho-trexate toxicity. N Engl J Med 1977;297:630–4.
2. Nirenberg A, Mosende C, Mehta BM, Gisolfi AL, Rosen G. High-dose methotrexate with citrovorum factor rescue: predic-tive value of serum methotrexate concentrations and correcpredic-tive measures to avert toxicity. Cancer Treat Rep 1977;61:779–83. 3. Lennard L. Therapeutic drug monitoring of antimetabolic
cyto-toxic drugs. Br J Clin Pharmacol 1999;47:131–43.
4. Fotoohi K, Skärby T, Söderhäll S, Peterson C, Albertioni F. Interfer-ence of 7-hydroxymethotrexate with the determination of metho-trexate in plasma samples from children with acute lymphoblastic leukemia employing routine clinical assays. J Chromatogr B Analyt Technol Biomed Life Sci 2005;817:139–44.
5. Albertioni F, Rask C, Eksborg S, Poulsen JH, Pettersson B, Beck O, et al. Evaluation of clinical assays for measuring high-dose methotrexate in plasma. Clin Chem 1996;42:39–44. 6. Bonfiglio R, King RC, Olah TV, Merkle K. The effects of sample
preparation methods on the variability of the electrospray ionization response for model drug compounds. Rapid Commun Mass Spectrom 1999;13:1175–85.
7. Clinical and Laboratory Standards Institute (CLSI). User verification of precision and estimation of bias; approved guideline-third edition. CLSI document EP15-A3. Wayne, PA: Clinical and Laboratory Standards Institute, 2014.
8. National Committee on Clinical Laboratory Standards (NCCLS). Evaluation of the linearity of quantitative measurement pro-cedures: a statistical approach; approved guideline. NCCLS document EP6-A, Wayne (PA): National Committee on Clinical Laboratory Standards, 2003.
9. Clinical and Laboratory Standards Institute (CLSI). Evaluation of detection capability for clinical laboratory measurement procedures; approved guideline-second edition. CLSI document EP17-A2. Wayne, PA: Clinical and Laboratory Standards Institute, 2012.
10. Passing H, Bablok W. A new biometrical procedure for testing the equality of measurements from two different analyti-cal methods. Application of linear regression procedures for method comparison studies in clinical chemistry, Part I. J Clin Chem Clin Biochem 1983;21:709–20.
11. Bland JM, Altman DG. Measuring agreement in method compari-son studies. Stat Methods Med Res 1999;8:135–60.
12. Godefroid MJ, von Meyer A, Parsch H, Streichert T, Verstraete AG, Stove V. Multicenter method evaluation of the ARK™ methotrexate immunoassay. Clin Chem Lab Med 2014;52:e13–6.
Supplemental Material: The online version of this article
(DOI: 10.1515/cclm-2015-0578) offers supplementary material, available to authorized users.