*Corresponding author: Arnold von Eckardstein, Institute for Clinical Chemistry, University Hospital Zurich, Raemistrasse 100, 8091 Zurich, Switzerland, Phone: +41 44 2552260,
Fax: +41 44 2554590, E-mail: [email protected] Raffaele Curcio, Lanja Saleh and Katharina Spanaus: Institute for Clinical Chemistry, University Hospital Zurich, Zurich, Switzerland Helen Stettler and Paolo M. Suter: Clinic and Polyclinic of Internal Medicine, University Hospital Zurich, Zurich, Switzerland Jasmin Barman Aksözen and Elisabeth Minder: Institute of Laboratory Medicine, Stadtspital Triemli, Zurich, Switzerland Murielle Bochud: Community Prevention Unit, Institute of Social and Preventive Medicine, Lausanne University Hospital, Lausanne, Switzerland
Raffaele Curcio, Helen Stettler, Paolo M. Suter, Jasmin Barman Aksözen, Lanja Saleh,
Katharina Spanaus, Murielle Bochud, Elisabeth Minder and Arnold von Eckardstein*
Reference intervals for 24 laboratory parameters
determined in 24-hour urine collections
DOI 10.1515/cclm-2014-1041
Received October 24, 2014; accepted May 5, 2015; previously published online June 6, 2015
Abstract
Background: Reference intervals for many laboratory parameters determined in 24-h urine collections are either not publicly available or based on small numbers, not sex specific or not from a representative sample.
Methods: Osmolality and concentrations or enzymatic activities of sodium, potassium, chloride, glucose, cre-atinine, citrate, cortisol, pancreatic α-amylase, total
protein, albumin, transferrin, immunoglobulin G, α1
-microglobulin, α2-macroglobulin, as well as porphyrins
and their precursors (δ-aminolevulinic acid and porpho-bilinogen) were determined in 241 24-h urine samples of a population-based cohort of asymptomatic adults (121 men and 120 women). For 16 of these 24 parameters creatinine-normalized ratios were calculated based on 24-h urine creatinine. The reference intervals for these parameters were calculated according to the CLSI C28-A3 statistical guidelines.
Results: By contrast to most published reference inter-vals, which do not stratify for sex, reference intervals of 12 of 24 laboratory parameters in 24-h urine collections and of eight of 16 parameters as creatinine-normalized ratios differed significantly between men and women. For six parameters calculated as 24-h urine excretion and four parameters calculated as creatinine-normalized ratios no
reference intervals had been published before. For some parameters we found significant and relevant deviations from previously reported reference intervals, most notably for 24-h urine cortisol in women. Ten 24-h urine param-eters showed weak or moderate sex-specific correlations with age.
Conclusions: By applying up-to-date analytical methods and clinical chemistry analyzers to 24-h urine collections from a large population-based cohort we provide as yet the most comprehensive set of sex-specific reference intervals calculated according to CLSI guidelines for parameters determined in 24-h urine collections.
Keywords: 24-h urine collection; cortisol; electrolytes; porphyrins; proteinuria; reference interval.
Introduction
Aliquots of 24-h urine collections are classical specimens for the determination of renally excreted endogenous sub-stances which have a strong intra-individual variation in response to daytime, dietary habits and prandial state, physical activity, fluid uptake or urine volume. One major drawback of this specimen is the inaccuracy in sampling. Normalization of analyte concentrations in spot urine for urinary creatinine helped to overcome this problem for some but not all urinary biomarkers. Another major limitation for the diagnostic use of laboratory parameters determined in 24-h urine samples is the uncertainty of reference intervals. The cumbersome 24-h collection of urines makes it difficult to obtain sufficient numbers of samples required for state-of-the-art derivation of refer-ence intervals.
Here we present sex-specific reference intervals for frequently requested laboratory parameters as well as porphyrins calculated according to recent CLSI guidelines [1] in 24-h urine collections of a large population-based cohort of 241 asymptomatic adult European individu-als. These urine parameters were measured by the use of modern clinical chemistry analyzers and present day ana-lytical methods.
Materials and methods
ParticipantsThe participants to this reference interval study are living in the canton of Zurich, Switzerland (see Table 1 for more information about the study population) and they form a sub-cohort of the Swiss Study on Salt intake, a representative random population-based cross- sectional study about the salt intake in Switzerland, who con-tributed 24-h urinary collections (for details see [2]). The study was approved by the Cantonal Ethics Committee Zurich, participation was voluntary and all participants gave written consent. Participants were instructed to collect urine in the container(s) without preserva-tives for 24 h according to the standard procedure [3]. Briefly, they were told to empty their bladder upon awakening in the morning, discard that sample and collect thereafter all voided urine portions including next morning’s first urine in the container. The exact col-lection time was recorded by each participant. A blood sample was also obtained from each participant to this reference interval study to determine serum creatinine for the estimation of the glomerular filtration rate (GFR) [4]. Participants with an estimated GFR below 60 mL/min/1.73 m2 or a 24-h urine collection of < 600 mL were excluded from this study [5]. The final reference sample popula-tion consisted of 120 women (mean age: 43 y, range 19–82 y) and 121 men (mean age: 47 y, 20–89 y). Each 24-h urine collection was mixed and an aliquot of the mixed urine was centrifuged at 2000 g for 10 min. Measurements of electrolytes, osmolality, total protein, pancreatic α-amylase, glucose and creatinine were performed imme-diately after centrifugation of the urine samples. Aliquots of the cen-trifuged urine samples were stored at 2–8 °C before measurement of citrate, albumin, α1-microglobulin, α2-macroglobulin, transferrin, and immuno globulin G (IgG) and at –20 °C before measurement of cortisol, porphyrins and their precursors.
Laboratory tests
The concentrations or enzymatic activities of the following param-eters were determined by the use of a cobas 8000 analyzer as
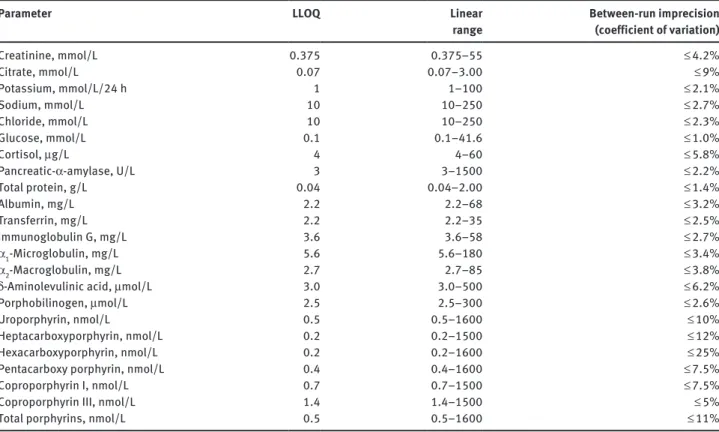
well as reagents from Roche Diagnostics (Rotkreuz, Switzerland); the analytical method employed is given in parenthesis: sodium, potassium and chloride (all by ion selective electrodes), creati-nine (rate-blanked Jaffé reaction [6], total protein (turbidimetry with benzethonium chloride), pancreas α-amylase (colorimetric test with antibody inhibition of human salivary α-amylase) and glucose (hexokinase method), The concentrations of albumin, α1-microglobulin, α2-macroglobulin, transferrin, and IgG were determined by immuno-nephelometry on a BN ProSpec (Siemens Healthcare Diagnostics, Marburg, Germany). The concentrations of the porphyrins (uroporphyrin, hepta-, hexa- and pentacar-boxy porphyrins, coproporphyrin I and III) and their precursors (δ-aminolevulinic acid and porphobilinogen) were determined by HPLC with fluorescence detection [7] and by ion-exchange chro-matography with spectrophotometric detection after reaction with modified Ehrlich’s reagent [8], respectively. Osmolality of the urine specimens was measured by freezing point depression (Advanced Instruments, Needham Heights, MA, USA). Citrate concentration was determined by an enzymatic UV-test (r-Biopharm, Darmstadt, Germany) on a Konelab 30i analyzer (Thermo Fisher Scientific, Vantaa, Finland). The cortisol concentration was determined by a chemiluminescent immunoassay without extraction of the analyte from the urine samples on an Access analyzer (Beckman Coulter, Nyon, Switzerland). For more details on the employed analytical methods see Table 2. Quality control material was analyzed in the same manner as the samples of the probands. The quality control was managed according to Swiss governmental regulations as defined by QUALAB (www.qualab.ch).
Data analysis
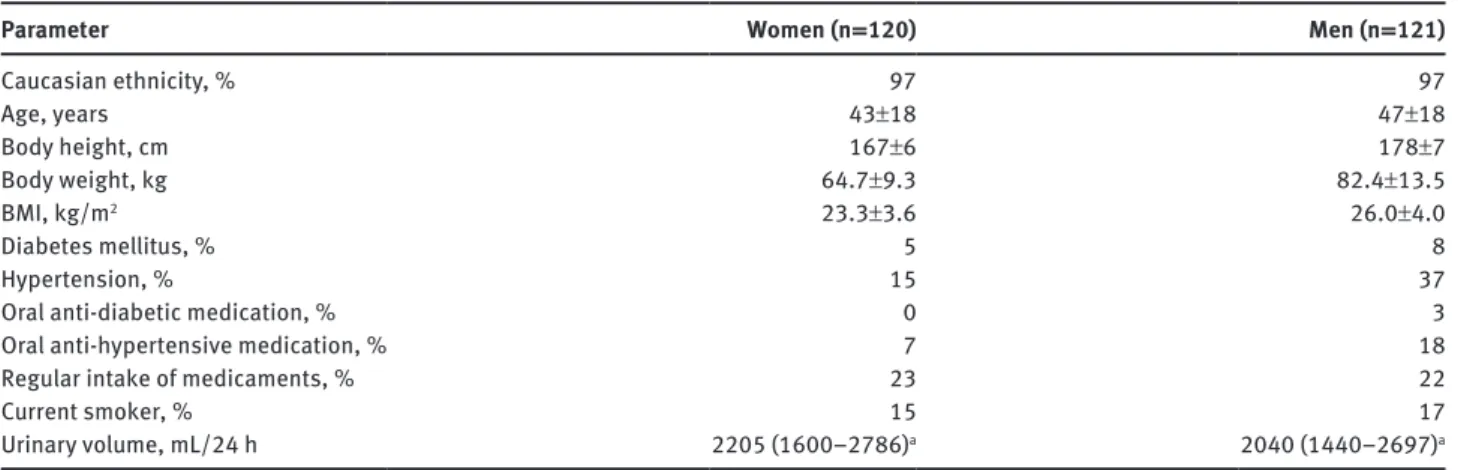
The reference intervals were determined for all participants as well as for women and men separately as the central 95% of the measurement results according to the CLSI C28-A3 statistical guidelines [1] using Reference Value Advisor [9], a set of macroin-structions for Microsoft Excel (Microsoft, Redmond, WA, USA) developed for this purpose. The 2.5th and the 97.5th percentiles of the distribution of the test results represent the lower and the upper reference limit, respectively, and were annotated with 90% Table 1: Major characteristics of the study participants (percentage or mean±standard deviation).
Parameter Women (n = 120) Men (n = 121)
Caucasian ethnicity, % 97 97 Age, years 43±18 47±18 Body height, cm 167±6 178±7 Body weight, kg 64.7±9.3 82.4±13.5 BMI, kg/m2 23.3±3.6 26.0±4.0 Diabetes mellitus, % 5 8 Hypertension, % 15 37
Oral anti-diabetic medication, % 0 3
Oral anti-hypertensive medication, % 7 18
Regular intake of medicaments, % 23 22
Current smoker, % 15 17
Urinary volume, mL/24 h 2205 (1600–2786)a 2040 (1440–2697)a
confidence intervals. Outliers within the data sets were identified and removed with the Tukey test [10] after Box-Cox transformation [11] of the data to approximate a normal distribution. However, the data of some parameters was not normally distributed even after Box-Cox transformation (Andersen-Darling test). These data sets were visually inspected (box-whisker plots) to identify and remove extreme values. Box-Cox transformation was then applied to the rest of the data and if the transformed data was normally distributed the Tukey test was employed to identify and remove further outliers.
Quantities below the lower limit of quantitation (LLOQ) of the employed analytical method were assigned a value of LLOQ divided by the square root of two [12] for statistical data analysis. As recom-mended by the CLSI C28-A3 statistical guidelines [1], the reference intervals and the 90% confidence intervals for the reference interval limits were calculated by the use of the non-parametric rank method and the robust method of Horn and Pesce [13] for partitions with at least 120 and with < 120 reference values, respectively. Statistical analysis was performed with Microsoft Excel (Microsoft, Redmond) and IBM SPSS Statistics for Windows (Version 21.0, Armonk, NY, IBM Corp). Visual inspection of the data, Spearman’s, Pearson’s cor-relation and least-square linear regression analysis were performed to infer age-dependency and the Mann-Whitney U-test to assess sex-dependency of the measured parameters. p-Values < 0.05 were defined as statistically significant. Least-square regression analysis was performed only if all measurement results of a parameter were above the LLOQ of the employed analytical method and normally distributed.
Results
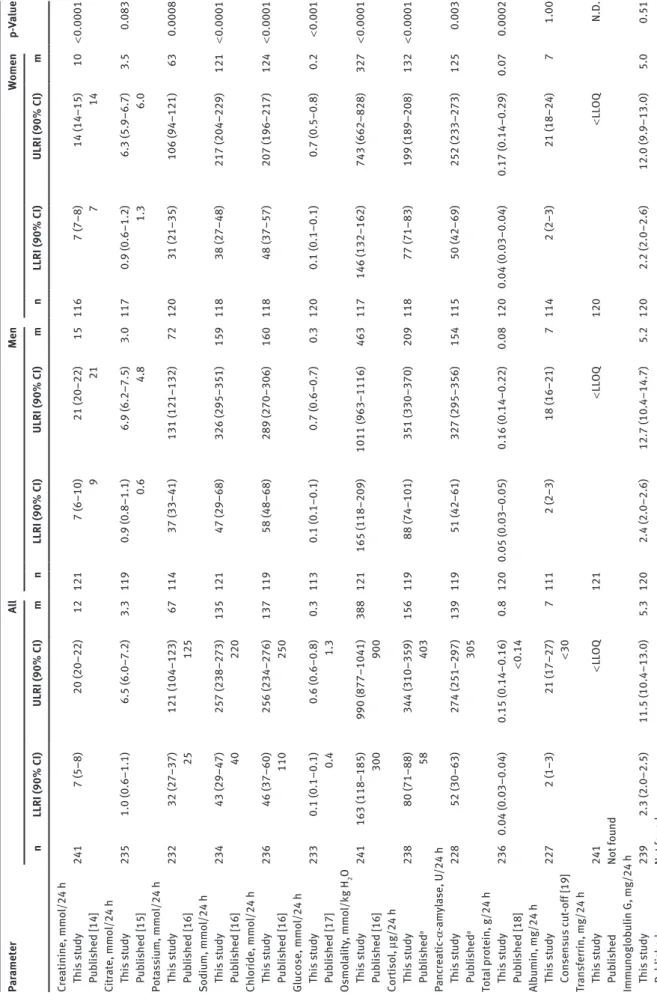
Table 3 shows the medians and reference intervals includ-ing the 90% confidence intervals for the lower and the upper reference limits for 24 laboratory parameters quan-tified in 24-h urine collections. Data are presented for the entire population as well as after stratification for men and women (see Table 3). Most of these data sets were not normally distributed. For half of the 24 parameters (creatinine, potassium, sodium, chloride, osmolality, cortisol, pancreatic α-amylase, δ-aminolevulinic acid, porphobilinogen, uroporphyrin, heptacarboxy porphy-rin and coproporphyporphy-rin I) the upper and lower reference interval limits were higher in men than in women and the sex-dependency of the reference intervals was statistically significant.
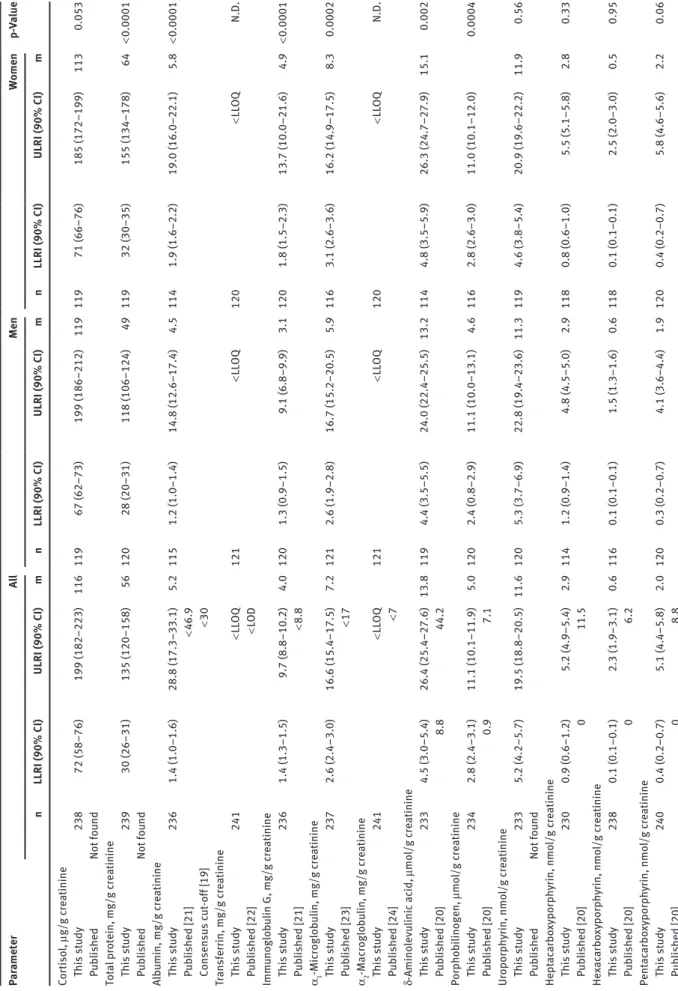
Concentrations of cortisol, proteins, and porphy-rins as well as their precursors in 24-h collections were also normalized for urinary creatinine concentrations (Table 4). In contrast to the higher absolute excreted amounts of the respective biomarkers in males, the cre-atinine-normalized urinary concentrations of uroporphy-rin, hepta-, hexa- and pentacarboxy porphyrins did not differ in a statistically significant manner between men Table 2: Characteristics of the employed analytical methods.
Parameter LLOQ Linear
range Between-run imprecision (coefficient of variation)
Creatinine, mmol/L 0.375 0.375–55 ≤ 4.2% Citrate, mmol/L 0.07 0.07–3.00 ≤ 9% Potassium, mmol/L/24 h 1 1–100 ≤ 2.1% Sodium, mmol/L 10 10–250 ≤ 2.7% Chloride, mmol/L 10 10–250 ≤ 2.3% Glucose, mmol/L 0.1 0.1–41.6 ≤ 1.0% Cortisol, μg/L 4 4–60 ≤ 5.8% Pancreatic-α-amylase, U/L 3 3–1500 ≤ 2.2% Total protein, g/L 0.04 0.04–2.00 ≤ 1.4% Albumin, mg/L 2.2 2.2–68 ≤ 3.2% Transferrin, mg/L 2.2 2.2–35 ≤ 2.5% Immunoglobulin G, mg/L 3.6 3.6–58 ≤ 2.7% α1-Microglobulin, mg/L 5.6 5.6–180 ≤ 3.4% α2-Macroglobulin, mg/L 2.7 2.7–85 ≤ 3.8%
δ-Aminolevulinic acid, μmol/L 3.0 3.0–500 ≤ 6.2%
Porphobilinogen, μmol/L 2.5 2.5–300 ≤ 2.6%
Uroporphyrin, nmol/L 0.5 0.5–1600 ≤ 10%
Heptacarboxyporphyrin, nmol/L 0.2 0.2–1500 ≤ 12%
Hexacarboxyporphyrin, nmol/L 0.2 0.2–1600 ≤ 25%
Pentacarboxy porphyrin, nmol/L 0.4 0.4–1600 ≤ 7.5%
Coproporphyrin I, nmol/L 0.7 0.7–1500 ≤ 7.5%
Coproporphyrin III, nmol/L 1.4 1.4–1500 ≤ 5%
Total porphyrins, nmol/L 0.5 0.5–1600 ≤ 11%
Tab le 3: Reference interva ls for 24-h u rine p ar ameters determined in this st udy and repor ted b y others. Par ameter A ll Men Women p-Va lue n LLRI (90% CI) ULRI (90% CI) m n LLRI (90% CI) ULRI (90% CI) m n LLRI (90% CI) ULRI (90% CI) m Cre atinine, mmo l/24 h This st udy 241 7 (5–8) 20 (20–22) 12 121 7 (6–10) 21 (20–22) 15 116 7 (7–8) 14 (14–15) 10 < 0.0001 P ub lished [14] 9 21 7 14 Cit rate, mmo l/24 h This st udy 235 1.0 (0.6–1.1) 6.5 (6.0–7.2) 3.3 119 0.9 (0.8–1.1) 6.9 (6.2–7.5) 3.0 117 0.9 (0.6–1.2) 6.3 (5.9–6.7) 3.5 0.083 P ub lished [15] 0.6 4.8 1.3 6.0 Pot assiu m, mmo l/24 h This st udy 232 32 (27–37) 121 (104–123) 67 114 37 (33–41) 131 (121–132) 72 120 31 (21–35) 106 (94–121) 63 0.0008 P ub lished [16] 25 125 Sodiu m, mmo l/24 h This st udy 234 43 (29–47) 257 (238–273) 135 121 47 (29–68) 326 (295–351) 159 118 38 (27–48) 217 (204–229) 121 < 0.0001 P ub lished [16] 40 220 Ch lor ide, mmo l/24 h This st udy 236 46 (37–60) 256 (234–276) 137 119 58 (48–68) 289 (270–306) 160 118 48 (37–57) 207 (196–217) 124 < 0.0001 P ub lished [16] 110 250 Glucose, mmo l/24 h This st udy 233 0.1 (0.1–0.1) 0.6 (0.6–0.8) 0.3 113 0.1 (0.1–0.1) 0.7 (0.6–0.7) 0.3 120 0.1 (0.1–0.1) 0.7 (0.5–0.8) 0.2 < 0.001 P ub lished [17] 0.4 1.3 Osmo la lity , mmo l/kg H 2 O This st udy 241 163 (118–185) 990 (877–1041) 388 121 165 (118–209) 1011 (963–1116) 463 117 146 (132–162) 743 (662–828) 327 < 0.0001 P ub lished [16] 300 900 Cor tiso l, μg/24 h This st udy 238 80 (71–88) 344 (310–359) 156 119 88 (74–101) 351 (330–370) 209 118 77 (71–83) 199 (189–208) 132 < 0.0001 P ub lished a 58 403 Panc re atic -α -am yl ase, U/24 h This st udy 228 52 (30–63) 274 (251–297) 139 119 51 (42–61) 327 (295–356) 154 115 50 (42–69) 252 (233–273) 125 0.003 P ub lished a 305 Tot al protein, g/24 h This st udy 236 0.04 (0.03–0.04) 0.15 (0.14–0.16) 0.8 120 0.05 (0.03–0.05) 0.16 (0.14–0.22) 0.08 120 0.04 (0.03–0.04) 0.17 (0.14–0.29) 0.07 0.0002 P ub lished [18] < 0.14 Alb umin, mg/24 h This st udy 227 2 (1–3) 21 (17–27) 7 111 2 (2–3) 18 (16–21) 7 114 2 (2–3) 21 (18–24) 7 1.00 Consensus c ut -off [19] < 30 Tr ansferr in, mg/24 h This st udy 241 < LL OQ 121 < LL OQ 120 < LL OQ N.D. P ub lished Not fo und Immu noglob ulin G, mg/24 h This st udy 239 2.3 (2.0–2.5) 11.5 (10.4–13.0) 5.3 120 2.4 (2.0–2.6) 12.7 (10.4–14.7) 5.2 120 2.2 (2.0–2.6) 12.0 (9.9–13.0) 5.0 0.51 P ub lished Not fo und
Par ameter A ll Men Women p-Va lue n LLRI (90% CI) ULRI (90% CI) m n LLRI (90% CI) ULRI (90% CI) m n LLRI (90% CI) ULRI (90% CI) m α1 -Mic roglob ulin, mg/24 h This st udy 241 3.8 (3.7–4.3) 24.6 (22.2–26.7) 10.0 120 4.3 (3.8–5.1) 26.4 (24.3–26.7) 10.2 120 3.7 (3.4–4.2) 20.1 (16.6–21.7) 9.7 0.09 P ub lished Not fo und α2 -M ac roglob ulin, mg/24 h This st udy 239 < LL OQ 121 < LL OQ 120 < LL OQ N.D. P ub lished Not fo und δ-Amino levu linic ac id , μ mo l/24 h This st udy 236 4.7 (3.9–6.8) 36.0 (32.8–44.5) 18.9 116 4.5 (3.9–8.3) 35.1 (32.2–36.6) 20.3 116 5.3 (4.3–6.5) 30.8 (28.2–33.2) 16.7 < 0.0001 P ub lished [20] 0 50 Porphob ilinogen, μmo l/24 h This st udy 229 3.3 (2.5–3.6) 11.5 (10.9–12.6) 6.8 113 3.2 (2.8–3.7) 12.3 (11.6–13.1) 7.3 116 2.9 (2.6–3.2) 10.7 (9.9–11.4) 6.2 0.0001 P ub lished [20] 0 9 Uroporph yr in, nmo l/24 h This st udy 233 5.7 (4.0–6.5) 30.7 (26.7–32.4) 15.4 115 5.9 (4.3–7.5) 31.2 (29.4–33.0) 18.5 117 4.5 (3.6–5.5) 20.8 (19.7–21.8) 12.4 < 0.0001 P ub lished Not fo und Hept ac arbo xyporph yr in, nmo l/24 h This st udy 234 1.0 (0.7–1.4) 7.6 (7.4–8.5) 3.9 119 1.1 (0.6–1.6) 8.9 (8.3–9.5) 4.9 116 0.8 (0.5–1.0) 5.4 (5.1–5.7) 3.0 < 0.0001 P ub lished [20] 4 16 He xac arbo xyporph yr in, nmo l/24 h This st udy 239 0.1 (0.1–0.2) 3.1 (2.4–4.6) 0.7 119 0.1 (0.1–0.2) 2.8 (2.4–3.2) 0.8 117 0.1 (0.1–0.1) 2.6 (2.1–3.2) 0.5 < 0.0001 P ub lished [20] 0 2 Pent ac arbo xyporph yr in, nmo l/24 h This st udy 241 0.5 (0.3–0.7) 7.0 (6.5–7.9) 2.7 120 0.6 (0.3–1.0) 7.0 (6.5–7.9) 3.0 120 0.5 (0.3–0.7) 7.0 (5.5–7.3) 2.4 0.002 P ub lished [20] 0 2 Coproporph yr in I, nmo l/24 h This st udy 238 8.7 (5.8–9.5) 62.9 (54.0–66.7) 24.0 120 10.4 (7.4–12.9) 67.1 (65.0–84.7) 28.2 120 7.9 (4.3–9.0) 45.2 (39.3–58.6) 20.4 < 0.0001 P ub lished [20] 5 90 Coproporph yr in III, nmo l/24 h This st udy 240 3.9 (2.4–10.3) 217 (196.7–277.1) 65.9 120 3.0 (1.5–8.2) 225.2 (197.1–279.5) 60.8 120 6.1 (2.4–11.8) 207.8 (172.4–277.1) 69.2 0.96 P ub lished [20] 15 242 Tot al porph yr ins, nmo l/24 h This st udy 240 24.7 (12.2–42.7) 312.9 (281.8–363.3) 122.6 120 20.2 (12.2–55.8) 321.1 (286.0–432.2) 128.7 120 24.7 (9.9–42.7) 311.9 (248.8–341.6) 121.7 0.019 P ub lished Not fo und
90% CI, 90% confidence interva
l; LL OQ, lo wer limit of quantit ation of the emp lo yed an alytic al method (see Tab le 2) as reference interva l limit; LLRI, lo wer limit of
the reference interva
l; m, medi an; n, nu mber of st udy sub
jects, i.e. samp
les; N.D., not
determined; ULRI, upper limit
of
the reference interva
l. p-Va lue of the M ann-Whit ney U-test for the se x-dependency of the reference interva ls. aReference interva ls provided b y the di agnostic test m anuf act urer . Tab le 3 (continued)
Tab le 4: Reference interva ls for u rine p ar ameters af ter norm aliz ation for c re atinine observed in this and previo us st udies. Par ameter A ll Men Women p-Va lue n LLRI (90% CI) ULRI (90% CI) m n LLRI (90% CI) ULRI (90% CI) m n LLRI (90% CI) ULRI (90% CI) m Cor tiso l, μg/g c re atinine This st udy 238 72 (58–76) 199 (182–223) 116 119 67 (62–73) 199 (186–212) 119 119 71 (66–76) 185 (172–199) 113 0.053 P ub lished Not fo und Tot al protein, mg/g c re atinine This st udy 239 30 (26–31) 135 (120–158) 56 120 28 (20–31) 118 (106–124) 49 119 32 (30–35) 155 (134–178) 64 < 0.0001 P ub lished Not fo und Alb umin, mg/g c re atinine This st udy 236 1.4 (1.0–1.6) 28.8 (17.3–33.1) 5.2 115 1.2 (1.0–1.4) 14.8 (12.6–17.4) 4.5 114 1.9 (1.6–2.2) 19.0 (16.0–22.1) 5.8 < 0.0001 P ub lished [21] < 46.9 Consensus c ut -off [19] < 30 Tr ansferr in, mg/g c re atinine This st udy 241 < LL OQ 121 < LL OQ 120 < LL OQ N.D. P ub lished [22] < L OD Immu noglob ulin G, mg/g c re atinine This st udy 236 1.4 (1.3–1.5) 9.7 (8.8–10.2) 4.0 120 1.3 (0.9–1.5) 9.1 (6.8–9.9) 3.1 120 1.8 (1.5–2.3) 13.7 (10.0–21.6) 4.9 < 0.0001 P ub lished [21] < 8.8 α1 -Mic roglob ulin, mg/g c re atinine This st udy 237 2.6 (2.4–3.0) 16.6 (15.4–17.5) 7.2 121 2.6 (1.9–2.8) 16.7 (15.2–20.5) 5.9 116 3.1 (2.6–3.6) 16.2 (14.9–17.5) 8.3 0.0002 P ub lished [23] < 17 α2 -M ac roglob ulin, mg/g c re atinine This st udy 241 < LL OQ 121 < LL OQ 120 < LL OQ N.D. P ub lished [24] < 7 δ-Amino levu linic ac id , μ mo l/g c re atinine This st udy 233 4.5 (3.0–5.4) 26.4 (25.4–27.6) 13.8 119 4.4 (3.5–5.5) 24.0 (22.4–25.5) 13.2 114 4.8 (3.5–5.9) 26.3 (24.7–27.9) 15.1 0.002 P ub lished [20] 8.8 44.2 Porphob ilinogen, μmo l/g c re atinine This st udy 234 2.8 (2.4–3.1) 11.1 (10.1–11.9) 5.0 120 2.4 (0.8–2.9) 11.1 (10.0–13.1) 4.6 116 2.8 (2.6–3.0) 11.0 (10.1–12.0) 0.0004 P ub lished [20] 0.9 7.1 Uroporph yr in, nmo l/g c re atinine This st udy 233 5.2 (4.2–5.7) 19.5 (18.8–20.5) 11.6 120 5.3 (3.7–6.9) 22.8 (19.4–23.6) 11.3 119 4.6 (3.8–5.4) 20.9 (19.6–22.2) 11.9 0.56 P ub lished Not fo und Hept ac arbo xyporph yr in, nmo l/g c re atinine This st udy 230 0.9 (0.6–1.2) 5.2 (4.9–5.4) 2.9 114 1.2 (0.9–1.4) 4.8 (4.5–5.0) 2.9 118 0.8 (0.6–1.0) 5.5 (5.1–5.8) 2.8 0.33 P ub lished [20] 0 11.5 He xac arbo xyporph yr in, nmo l/g c re atinine This st udy 238 0.1 (0.1–0.1) 2.3 (1.9–3.1) 0.6 116 0.1 (0.1–0.1) 1.5 (1.3–1.6) 0.6 118 0.1 (0.1–0.1) 2.5 (2.0–3.0) 0.5 0.95 P ub lished [20] 0 6.2 Pent ac arbo xyporph yr in, nmo l/g c re atinine This st udy 240 0.4 (0.2–0.7) 5.1 (4.4–5.8) 2.0 120 0.3 (0.2–0.7) 4.1 (3.6–4.4) 1.9 120 0.4 (0.2–0.7) 5.8 (4.6–5.6) 2.2 0.06 P ub lished [20] 0 8.8
and women. The upper reference interval limits of the cre-atinine-normalized ratios of total protein, albumin, IgG, δ-aminolevulinic acid, coproporphyrin I and III and total porphyrins were even higher in women than in men.
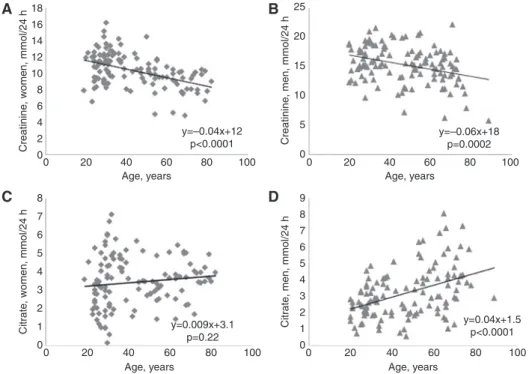
Several parameters in 24-h urine samples showed statistically significant correlations with age (Table 5). However, only the inverse correlations of creatinine (Figure 1A and B) and total porphyrins with age were seen in either sex. Other correlations with age were seen in one sex only, e.g. in males the positive correlations of
citrate (Figure 1), total protein and α1-microglobulin and
the negative correlations of cortisol and coproporphyrin III. However, the negative correlations with age of sodium, chloride and coproporphyrin I were found for females only. To estimate the impact of age and hence the need of age-stratified reference intervals we calculated linear regression equations for normally distributed data sets. The absolute 24-h excretions showed mean changes per 10 years aging (Table 5) in the range of 3%–13% with respect to the median of the measurement results of these parameters.
Discussion
We here report the reference intervals of 24 laboratory parameters determined in 24-h urine collections from a population-based sample of 241 asymptomatic adults. The parameters were chosen because they are regularly requested by clinicians of our hospital and determined by applying present day analytical methods to modern clinical chemistry analyzers. The reference intervals of these parameters were calculated according to recent CLSI-guidelines.
For 18 parameters we found reference intervals either published or provided by the test manufacturers and the majority of these reference intervals were very similar to those of our study. For creatinine, citrate (data of women) and potassium the published reference interval limits were within the 90% confidence interval of our reference interval limits. They were obtained by using the same analytical methods that were employed in our study. However, despite the use of the same analytical system and methods, reference intervals of several other 24-h urine parameters differed in a statistically significant and clinically meaningful manner between our and previous reports. These differences became even more prominent by the stratification of reference intervals for sex.
Except for creatinine, citrate, coproporphyrin I and III, none of the previously published reference intervals
Par ameter A ll Men Women p-Va lue n LLRI (90% CI) ULRI (90% CI) m n LLRI (90% CI) ULRI (90% CI) m n LLRI (90% CI) ULRI (90% CI) m Coproporph yr in I, nmo l/g c re atinine This st udy 235 8.0 (2.1–10.4) 49.8 (45.6–53.4) 26.4 116 9.7 (8.2–11.5) 42.1 (39.6–44.4) 24.8 115 8.8 (6.4–11.2) 50.0 (47.0–53.1) 28.8 0.008 P ub lished [20] 2.7 75.1 Coproporph yr in III, nmo l/g c re atinine This st udy 241 3.8 (2.2–6.9) 164.9 (155.1–241.3) 49.3 120 3.3 (1.0–4.8) 155.0 (128.3–158.2) 38.8 119 5.7 (2.7–9.0) 192.7 (171.1–213.8) 62.7 0.002 P ub lished [20] 15.0 230.0 Tot al porph yr ins, nmo l/g c re atinine This st udy 237 31.9 (18.0–36.5) 223.9 (212.4–246.9) 95.0 120 23.5 (8.2–36.5) 212.3 (191.6–228.0) 88.5 120 24.3 (8.8–41.3) 262.4 (223.7–325.6) 106.2 0.003 P ub lished Not fo und
90% CI, 90%-confidence interva
l; LL OQ, lo wer limit of quantit ation of the emp lo yed an alytic al method (see Tab le 2) as reference interva l limit; LLRI, lo wer limit of
the reference interva
l; L OD, limit of detection; m, medi an; n, nu mber of st udy sub
jects, i.e. samp
les; N.D., not
determined; ULRI, upper limit
of
the reference interva
l. p-Va lue of the M ann-Whit ney U-test for the se x-dependency of
the reference interva
ls.
The conversion f
actor to obt
ain the amo
unt
of
an an
alyte per mmo
l c
re
atinine f
rom the given amo
unt per gr am c re atinine is 0.113. Tab le 4 (continued)
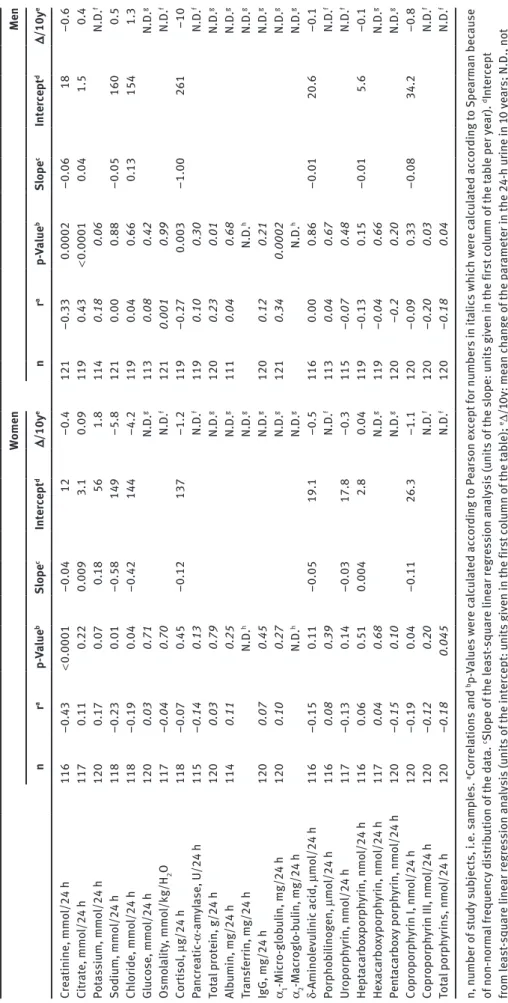
Tab le 5: Correl ation and line ar regression an alysis resu lts of 24-h u rine p ar
ameters for age-dependency
. Women Men n r a p-Va lue b Slope c Intercept d Δ/10y e n r a p-Va lue b Slope c Intercept d Δ/10y e Cre atinine, mmo l/24 h 116 −0.43 < 0.0001 −0.04 12 −0.4 121 −0.33 0.0002 −0.06 18 –0.6 Cit rate, mmo l/24 h 117 0.11 0.22 0.009 3.1 0.09 119 0.43 < 0.0001 0.04 1.5 0.4 Pot assiu m, mmo l/24 h 120 0.17 0.07 0.18 56 1.8 114 0.18 0.06 N.D. f Sodiu m, mmo l/24 h 118 −0.23 0.01 −0.58 149 −5.8 121 0.00 0.88 −0.05 160 0.5 Ch lor ide, mmo l/24 h 118 −0.19 0.04 −0.42 144 −4.2 119 0.04 0.66 0.13 154 1.3 Glucose, mmo l/24 h 120 0.03 0.71 N.D. g 113 0.08 0.42 N.D. g Osmo la lity , mmo l/kg/H 2 O 117 −0.04 0.70 N.D. f 121 0.001 0.99 N.D. f Cor tiso l, μg/24 h 118 −0.07 0.45 −0.12 137 −1.2 119 −0.27 0.003 −1.00 261 –10 Panc re atic -α -am yl ase, U/24 h 115 −0.14 0.13 N.D. f 119 0.10 0.30 N.D. f Tot al protein, g/24 h 120 0.03 0.79 N.D. g 120 0.23 0.01 N.D. g Alb umin, mg/24 h 114 0.11 0.25 N.D. g 111 0.04 0.68 N.D. g Tr ansferr in, mg/24 h N.D. h N.D. g N.D. h N.D. g IgG, mg/24 h 120 0.07 0.45 N.D. g 120 0.12 0.21 N.D. g α1 -Mic ro-glob ulin, mg/24 h 120 0.10 0.27 N.D. g 121 0.34 0.0002 N.D. g α2 -M ac roglo-b ulin, mg/24 h N.D. h N.D. g N.D. h N.D. g δ-Amino levu linic ac id , μ mo l/24 h 116 −0.15 0.11 −0.05 19.1 −0.5 116 0.00 0.86 −0.01 20.6 –0.1 Porphob ilinogen, μmo l/24 h 116 0.08 0.39 N.D. f 113 0.04 0.67 N.D. f Uroporph yr in, nmo l/24 h 117 −0.13 0.14 −0.03 17.8 −0.3 115 −0.07 0.48 N.D. f Hept ac arbo xporph yr in, nmo l/24 h 116 0.06 0.51 0.004 2.8 0.04 119 −0.13 0.15 −0.01 5.6 −0.1 He xac arbo xyporph yr in, nmo l/24 h 117 0.04 0.68 N.D. g 119 −0.04 0.66 N.D. g Pent ac arbo xy porph yr in, nmo l/24 h 120 −0.15 0.10 N.D. g 120 −0.2 0.20 N.D. g Coproporph yr in I, nmo l/24 h 120 −0.19 0.04 −0.11 26.3 −1.1 120 −0.09 0.33 −0.08 34.2 −0.8 Coproporph yr in III, nmo l/24 h 120 −0.12 0.20 N.D. f 120 −0.20 0.03 N.D. f Tot al porph yr ins, nmo l/24 h 120 −0.18 0.045 N.D. f 120 −0.18 0.04 N.D. f n, nu mber of st udy sub
jects, i.e. samp
les. aCorrel ations and b p-Va lues were c alc ul ated according to Pe arson e xcept for nu mbers in it
alics which were c
alc ul ated according to Spe arm an bec ause of non-norm al frequency dist rib ution of the d at a. cSlope of the le ast -square line ar regression an alysis (u nits of the slope: u
nits given in the first
co lu mn of the t ab le per ye ar). dIntercept from le ast -square line ar regression an alysis (u nits of the intercept: u
nits given in the first
co lu mn of the t ab le); eΔ/10y: me an ch ange of the p ar ameter in the 24-h u rine in 10 ye ars; N.D., not determined . Le ast -square line ar regression an alysis not per formed bec ause fThe d at a is not norm al ly dist rib uted or gBec ause of the presence of me asu rement resu lts belo w the LL OQ of the emp lo yed an alytic al method; hN.D., not determined , since more th an 97 .5% of the me asu rement resu lts and
hence the upper reference interva
l limit are belo w the LL OQ of the emp lo yed an a-lytic al method , independent of the p ar tic ip ant’s age.
was sex-specific. By contrast in our study, for most of the parameters a statistically significant sex-dependency of the reference intervals was found, the lower and the upper reference limits being higher for men than for women. Although statistically significant, the sex-specific differ-ences of reference intervals found for some parameters are of minor clinical relevance depending on the clinical indication for determining this parameter.
On the contrary, cortisol is a prominent example for discrepant reference intervals with clinical relevance. The 24-h urinary excretion of cortisol is recommended by endocrinological societies as the screening test for ruling out Cushing’s syndrome [25] and should hence have a high diagnostic sensitivity. However, the test manufac-turer provides a uniform reference interval with 14% and 103% higher upper reference limits (403 μg/24 h) than those determined by us in men (351 μg/24 h) and women (199 μg/24 h), respectively. A similar considerable sex dif-ference in the upper redif-ference limit was previously found in a study of 83 men and 104 women which used LC-MS/MS for the determination of urinary cortisol [26]. Especially for women, this discrepancy has a major impact on diagnostic sensitivity in ruling out hypercortisolism. The discrepancy between our sex-specific cortisol reference intervals and the uniform one of the test manufacturer determined in 140 apparently healthy adults is noteworthy, as the same analyzer and analytical method have been used.
Reference intervals of sodium concentrations were also concerned by important differences between the data provided either by our study or and the published uniform reference interval [16] cited by the test manufacturer (Table 3). The published upper reference limit of sodium excretion is 220 mmol/24 h [16] instead of 326 mmol/24 h for men in our study. Urinary electrolytes are known to show considerable intra- and inter-individual variations in response to changes in dietary intake. For sodium and potassium the intra-individual variation amounts to 31% and 24%, respectively [27]. The sodium excretion in our sample was determined at steady state conditions to reduce this biological variation and to generate represent-ative data. Therefore, the higher median (135 mmol/24 h) and upper reference level probably reflect the higher than recommended salt intake [28] in the Swiss population, which however is in agreement with many other studies [29, 30].
Previous urinary porphyrin measurements using frac-tioned extractions [31] detected two fractions, the “uropor-phyrin fraction” (uropor“uropor-phyrin, heptacarboxy- and part of hexacarboxyporphyrins) and the “coproporphyrin frac-tion” (rest of hexacarboxy-, pentacarboxy- and copropor-phyrins). Reference values based on this technique are outdated, as in the 1980s, HPLC with fluorescence detec-tion was introduced, first as normal then later as reverse phase chromatography. The latter is technical standard
18 A B C D 25 20 15 10 5 0 16 14 12 10 8 8 7 6 5 4 3 2 1 0 9 8 7 6 5 4 3 2 1 0 6 Creatinine , women, mmol/24 h Citrat e, women, mmol/24 h Creatinine , men, mmol/24 h Citrat e, men, mmol/24 h 4 2 0 0 20 40 60 80 100 Age, years 0 20 40 60 80 100 Age, years 0 20 40 60 80 100 Age, years 0 20 40 60 80 100 Age, years y=–0.04x+12 p<0.0001 y=0.009x+3.1 p=0.22 y=–0.06x+18 p=0.0002 y=0.04x+1.5 p<0.0001
Figure 1: Scatter diagrams of 24-h urine creatinine for women (A), for men (B) and for 24-h urine citrate for women (C) and for men (D) versus age of the study participants.
today. Published reference intervals of urinary porphy-rins based on this HPLC method are available for children [32, 33] and for adults [7, 20, 34]. Table 3 shows the refer-ence intervals of 24-h urine porphyrins for adults from the study of Hindmarsh et al. [20] which was performed with the largest sample of the aforementioned reference inter-val studies (96 adults). These reference interinter-vals are in the same range as those of our study. However, it is worth mentioning that for porphyrin analysis a large inter-labo-ratory variation has been reported recently [35].
For 16 of the 24 parameters we also calculated cre-atinine-normalized excretions. Interestingly, this nor-malization either eliminated statistically significant differences of reference intervals between men and women or led to the occurrence of higher reference limits in women than in men. These changes reflect the sig-nificantly higher excretion of creatinine in men, which is the denominator of the ratios. Again we found some reference intervals being different from those published, e.g. for albumin, the porphyrins and their precursors. Some discrepant reference intervals may result from pre-analytical differences in urine sampling. In clinical prac-tice, specimens of second morning spot urines rather than 24-h urine collections are used for the determina-tion of creatinine-normalized concentradetermina-tions of urinary substances, e.g. for the differentiation and classification of proteinuria. In addition it is important to emphasize that clinical decision limits of some urinary parameters, e.g. albuminuria [19], have been defined by consensus of experts on the basis of clinical outcomes in epidemio-logical or clinical intervention studies rather than on the frequency distribution in the population. Similarly to another reference interval study for proteinuria marker proteins [21] the concentrations of these proteins were below the LLOQ of the analytical methods for many of the urine samples of our study. These concentrations were replaced by LLOQ divided by the root square of two [12] for statistical analysis as well as the calculation of reference intervals. The reference interval obtained for IgG using this approach is very close to that of the afore-mentioned study [21] with a similarly large 90% confi-dence interval for the upper reference interval limit. The concentrations of transferrin and of α2-macroglobulin were above the corresponding LLOQ in only three and only in one out of 241 samples, respectively, i.e. in < 2.5% of the samples. Thus the 97.5th percentile, i.e. the upper reference interval limit, is below the LLOQ for the con-centrations of these two proteins, as reported by another study on urinary transferrin [22].
For many parameters including creatinine, cortisol or citrate we found statistically significant correlations
between urinary excretion and age. Nevertheless we did not define any age-dependent reference intervals for the following reasons: Most importantly, further stratifica-tion for age beyond sex would have yielded too small sub-groups. Even a split by the median age of 36 and 47 years for women and men, respectively, would have generated groups of about 60 individuals and thereby large 90% confidence intervals for the reference interval limits. Fur-thermore, our linear regression analysis revealed that the mean 24-h urinary excretion of the analyzed param-eters changed only by 3%–13% within 10 years of aging with respect to the median of the measurement results. This change is within the inter-assay imprecision of the methods used (Table 2). However, we cannot exclude that for particular age groups, e.g. seniors > 70 years for which, however, only few data points are available in our study cohort, the mean relative change of 24-h urinary excretion of particular parameters per unit year aging is larger than expected by extrapolation.
Our reference interval study has several strengths and limitations. The major progress is the sample size which is larger than in most previous studies and allowed the determination of reference intervals with the non-para-metric rank method recommended by the CLSI C28-A3 statistical guidelines [1]. As one limitation our population-based cohort, includes individuals with diabetes mellitus, hypertension, or regular intake of medicines (Table 1). These conditions may affect the urinary excretion of some parameters (e.g. albumin, total protein, glucose). To com-pensate for these uncertainties we used the Tukey test [10] and visual inspection of the data for the detection of outli-ers which were removed from the data set before calcula-tion of reference intervals. Furthermore individuals with
an estimated GFR < 60 mL/min/1.73 m2 were excluded
from this study. Another weakness of this study is inher-ent with the sampling of 24-h urines in the population. Although the volunteers participating in our study were carefully instructed on the procedure of 24-h urine collec-tion and only 24-h urine colleccollec-tions of more than 600 mL were included in this study, we cannot exclude incomplete specimen collection by some participants. As discussed before, reference intervals of some of the 16 parameters relative to urinary creatinine may differ from previously reported ones because we analyzed them in 24-h urine collections rather than in the conventional morning spot urine.
In conclusion, we here provide a clinically helpful resource of sex-specific reference intervals for 24 clinically relevant laboratory parameters determined in 24-h urine collections and for 16 parameters calculated as creatinine-normalized ratios.
Acknowledgments: We thank the laboratory staff of the Institute for Clinical Chemistry and of the Institute of Laboratory Medicine of the University Hospital and the Stadtspital Triemli of Zurich, respectively for their techni-cal assistance.
Author contributions: All the authors have accepted responsibility for the entire content of this submitted manuscript and approved submission.
Research funding: None declared.
Employment or leadership: None declared. Honorarium: None declared.
Competing interests: The funding organization(s) played no role in the study design; in the collection, analysis, and interpretation of data; in the writing of the report; or in the decision to submit the report for publication.
References
1. CLSI. Defining, establishing, and verifying reference intervals in the clinical laboratory; approved guideline, 3rd ed. CLSI document c28-a3. Wayne, PA: Clinical and Laboratory Standards Institute, 2008.
2. Guessous I, Dudler V, Glatz N, Theler JM, Zoller O, Paccaud F, et al. Vitamin D levels and associated factors: a population-based study in Switzerland. Swiss Med Wkly 2012;142:w13719. 3. European Confederation of Laboratory Medicine. European
urinalysis guidelines. Scand J Clin Lab Invest 2000;60:1–96. 4. Levey AS, Stevens LA. Estimating GFR using the CKD
epidemio-logy collaboration (CKD-EPI) creatinine equation: more accurate GFR estimates, lower CKD prevalence estimates, and better risk predictions. Am J Kidney Dis 2010;55:622–7.
5. Schoen T, Blum J, Paccaud F, Burnier M, Bochud M, Conen D. Factors associated with 24-hour urinary volume: the Swiss salt survey. BMC Nephrol 2013;14:246.
6. Jaffé M. Über den Niederschlag, welchen Pikrinsäure in normalem Harn erzeugt und über eine neue Reaktion des Kreatinins. Z Physiol Chem 1886;10:391–400.
7. Minder EI, Schneider-Yin X. Porphyrins, porphobilinogen, delta-aminolevulinic acid. In: Blau N, Duran M, Gibson KM, editors. Laboratory guide to the methods in biochemical genet-ics. Berlin, Heidelberg: Springer Verlag, 2008:751–80. 8. Mauzerall D, Granick S. The occurrence and determination of
delta-amino-levulinic acid and porphobilinogen in urine. J Biol Chem 1956;219:435–46.
9. Geffre A, Concordet D, Braun JP, Trumel C. Reference value advisor: a new freeware set of macroinstructions to calcu-late reference intervals with Microsoft Excel. Vet Clin Pathol 2011;40:107–12.
10. Tukey JW. Exploratory data analysis. Reading, MA: Addison-Wesley, 1977:688.
11. Box G, Cox D. An analysis of transformations. J Royal Stat Soc 1964;B26:211–52.
12. Croghan CW, Egeghy PP. Methods of dealing with values below the limit of detection using SAS. Washington, DC: US Environ-mental Protection Agency (no date given).
13. Horn P, Pesce A. Reference intervals. A user’s guide. Washington, DC: AACC Press, 2005.
14. Junge W, Wilke B, Halabi A, Klein G. Determination of reference intervals for serum creatinine, creatinine excretion and creati-nine clearance with an enzymatic and a modified Jaffe method. Clin Chim Acta 2004;344:137–48.
15. Samuell CT, Kasidas GP. Biochemical investigations in renal stone formers. Ann Clin Biochem 1995;32:112–22.
16. Wu AH, editor. Tietz clinical guide to laboratory tests, 4th ed. St. Louis, MO: Saunders Elsevier, 2006.
17. Krieg M, Gunsser KJ, Steinhagenthiessen E, Becker H. Comparative quantitative clinico-chemical analysis of the characteristics of 24-hour urine and morning urine. J Clin Chem Clin Biochem 1986;24:863–9.
18. Junge W, Wilke B, Halabi A, Jarausch J, Klein G. Reference intervals for total protein in collected and random urine using the benzethonium chloride method. Clin Chem 2006;52:Abstr:A157.
19. American Diabetes Association. Standards of medical care in diabetes-2013. Diabetes Care 2013;36(Suppl 1):S11–66. 20. Hindmarsh JT, Oliveras L, Greenway DC. Biochemical
differentiation of the porphyrias. Clin Biochem 1999;32: 609–19.
21. Tencer J, Thysell H, Grubb A. Analysis of proteinuria: reference limits for urine excretion of albumin, protein HC, immunoglobulin G, kappa- and lambda-immunoreactivity, orosomucoid and alpha 1-antitrypsin. Scand J Clin Lab Invest 1996;56:691–700.
22. Rifai N, Gubark K, Silverman LM. Immunoturbidimetry: an attrac-tive technique for the determination of urinary albumin and transferrin. Clin Biochem 1987;20:179–81.
23. Hofmann W, Guder WG. A diagnostic program for quantitative-analysis of proteinuria. J Clin Chem Clin Biochem 1989;27: 589–600.
24. Hofmann W, Schmidt D, Guder WG, Edel HH. Differentiation of hematuria by quantitative-determination of urinary marker proteins. Klin Wochenschr 1991;69:68–75.
25. Guignat L, Bertherat J. The diagnosis of Cushing’s syndrome: an endocrine society clinical practice guideline: commentary from a European perspective. Eur J Endocrinol 2010;163:9–13. 26. Taylor RL, Machacek D, Singh RJ. Validation of a high-throughput
liquid chromatography-tandem mass spectrometry method for urinary cortisol and cortisone. Clin Chem 2002;48:1511–9. 27. Bingham SA, Williams R, Cole TJ, Price CP, Cummings JH.
Reference values for analytes of 24-h urine collections known to be complete. Ann Clin Biochem 1988;25:610.
28. World Health Organization. Guideline: sodium intake for adults and children. Available from: http://www.who.int/nutrition/ publications/guidelines/sodium_intake_printversion.pdf. Accessed 15 September, 2014.
29. Bernstein AM, Willet WC. Trends in 24-h urinary sodium excre-tion in the United States, 1957–2003: a systematic review. Am J Clin Nutr 2010;92:1172–80.
30. McCarron DA, Kazaks AG, Geerling JC, Stern JS, Graudal NA. Nor-mal range of human dietary sodium intake: a perspective based on 24-hour urinary sodium excretion worldwide. Am J Hypertens 2013;26:1218–23.
31. Doss M. Haematological disturbances of porphyrin metabolism. In: Gross R, Hellrieger K, editors. Strategy in clinical haematol-ogy. Recent results in clinical cancer research. Vol. 69. Heidel-berg: Springer, 1979:97–109.
32. Minder EI, Schneider-Yin X. Age-dependent reference values of urinary porphyrins in children. Eur J Clin Chem Clin Biochem 1996;34:439–43.
33. Bloom KE, Zaider EF, Morledge LJ, Poh-Fitzpatrick MB. Urinary porphyrin excretion in normal children and adults. Am J Kidney Dis 1991;18:483–9.
34. Boynton SB, Roth KS. Rapid and accurate random urinary porphyrin quantitation. Clin Chim Acta 1994;226:1–11.
35. Aarsand AK, Petersen PH, Sandberg S. Estimation and application of biological variation of urinary delta-aminolevulinic acid and porphobilinogen in healthy individuals and in patients with acute intermittent porphyria. Clin Chem 2006;52:650–6.