HAL Id: hal-02271070
https://hal.archives-ouvertes.fr/hal-02271070
Submitted on 26 Aug 2019
HAL is a multi-disciplinary open access archive for the deposit and dissemination of sci-entific research documents, whether they are pub-lished or not. The documents may come from teaching and research institutions in France or abroad, or from public or private research centers.
L’archive ouverte pluridisciplinaire HAL, est destinée au dépôt et à la diffusion de documents scientifiques de niveau recherche, publiés ou non, émanant des établissements d’enseignement et de recherche français ou étrangers, des laboratoires publics ou privés.
Máté Kurucz, Szabolcs Tóth, Roland Flender, Ludovít Haizer, Balint Kiss,
Benjamin Persielle, Eric Cormier
To cite this version:
Máté Kurucz, Szabolcs Tóth, Roland Flender, Ludovít Haizer, Balint Kiss, et al.. Single-shot CEP drift measurement at arbitrary repetition rate based on dispersive Fourier transform. Optics Express, Optical Society of America - OSA Publishing, 2019, 27 (9), pp.13387-13399. �10.1364/OE.27.013387�. �hal-02271070�
Single-shot CEP drift measurement at
arbitrary repetition rate based on dispersive
Fourier transform
M
ÁTÉK
URUCZ,
1S
ZABOLCST
ÓTH,
1R
OLANDF
LENDER,
1L
UDOVÍTH
AIZER,
1B
ÁLINTK
ISS,
1B
ENJAMINP
ERSIELLE2ANDE
RICC
ORMIER2,*1ELI-ALPS, Dugonics tér 13, 6720 Szeged, Hungary
2CELIA, Université de Bordeaux – CNRS – CEA, 33405 Talence, France
*Eric.Cormier@u-bordeaux.fr
Abstract: This paper presents a single-shot technique for measuring CEP. The Temporal
dispersion based One-shot Ultrafast Carrier envelope phase Analysis method (TOUCAN) is an arbitrary repetition rate single-shot CEP drift measurement technique based on dispersive Fourier transformations and has been experimentally tested at 100 kHz. TOUCAN was validated by a direct comparison of decimated data with an independent traditional CEP drift measurement technique. The impact of a temporal jitter on the CEP drift measurement is investigated and a new mitigation technique is shown to produce high accuracy jitter-free CEP drift extraction.
© 2019 Optical Society of America under the terms of the OSA Open Access Publishing Agreement
1. Introduction
High-field physics experiments e.g., attoscience, often require amplified few cycle laser pulses at the millijoule energy level [1]. The outcome of these experiments can drastically be altered by a change in the field amplitude and also by drifts or fluctuations of the carrier envelope phase (CEP) [1,2]. As a consequence, on top of the CEP stabilization scheme (passive or active), parallel single-shot CEP measurement and pulse tagging might become necessary.
One of the most widespread CEP drift measurement method is based on f-to-2f self-referential interferometry [3], where the CEP slip is measured by a heterodyne detection scheme. The single-shot version of a f-to-2f interferometer extracts the phase information by optical spectroscopic method [4,5] i.e. using angular dispersion to map the spectrum onto a spatial dimension. The detection of the spatially dispersed signal usually relies on a detector array, e.g., a charge-coupled device (CCD). The measurement rate of such device is limited by the delay between measurements, which is usually on the hundred microseconds scale. Single–shot CEP drift measurement and pulse tagging above 10 kHz is very challenging to achieve with current technology. Even when replacing the detector array with two photomultipliers, which in principle mitigates this limitation, the demonstrated fastest single-shot detection was at 10 kHz [6].
In the last decade, Stereo-ATI, a new CEP detection technique has been developed, which encodes the phase in an electron spectrum of the above-threshold ionization (ATI) of a noble gas [7–9]. This method allows real time single-shot measurements of the CEP at high repetition rate and is independent of pulse energy to phase coupling inherent to f-to-2f type interferometric measurements. This coupling leads to spurious CEP noise measurement for a system which uses supercontinuum generation for spectral broadening [10]. Single-shot real time stereo-ATI CEP measurements on a 100 kHz repetition rate system have recently been demonstrated and it is claimed, based on the measurement time, that theoretical limit of the acquisition rate is 10 MHz [11]. However, this technique requires two time of flights tubes to be connected to the interaction chamber, under vacuum, resulting in a large expansive device.
#361233 https://doi.org/10.1364/OE.27.013387 Journal © 2019 Received 1 Mar 2019; revised 28 Mar 2019; accepted 3 Apr 2019; published 25 Apr 2019
Also few cycle pulses with at least 30 µJ energy are required for CEP retrieval [9], which makes this diagnostic method unsuitable for a significant proportion of current laser systems.
A different approach for high repetition rate single-shot CEP measurement has been taken which is based on Dispersive Fourier Transform (DFT) [12–15]. The temporal dispersion based one-shot ultrafast carrier envelope phase analysis method (TOUCAN) allows single-shot CEP drift extraction up to gigahertz repetition rates from f-to-2f spectral interference. The concept is demonstrated by recording the CEP drift of 4 cycles pulses at 3.2 µm from an OPCPA laser operating at 100 kHz.
2. Concept
Linear optical interferometry cannot provide information about the CEP so a nonlinear optical effect has to be employed [3]. In f-to-2f self-referential interferometry, a fraction of the laser pulse is frequency doubled while another fraction is spectrally broadened until the blue part reaches the doubled frequency (i.e. broadened over one octave). The interference signal is created by overlapping these two pulses in the temporal, spatial, and spectral domain. The one dimensional temporal evolution of the fundamental laser pulse is given by
( ) ( ) ( ( ))
ω 0
E t =A t exp -i ω t+φ⋅ (1)
where A(t) is the temporal envelope of the pulse, ω0 is the central angular frequency and φ
stands for CEP. In the frequency domain the field reads:
( ) ( ) ( )
ω ω
E ω =A ω exp -iφ⋅ (2)
Under perfect conditions, the second harmonic (SH) pulse is centered at twice the frequency of the original. The resultant phase is twice that of the fundamental pulse and also shifted by an offset. The complex spectrum of the second harmonic electric field is expressed as:
( ) ( ) ( ( ))
2ω 2ω
E ω =A ω exp -i 2φ+π/2⋅ (3)
The above equation describes a process, where dispersion is negligible. In reality material dispersion introduces different constant phase shift for the fundamental and SH pulses. The spectra of these pulses may overlap if the spectrum is either sufficiently broad or if it is broadened by supercontinuum generation. The overlapping region will exhibit a spectral interference pattern, where the fringe period depends on the relative delay between the fundamental and the SH pulse. The resulting signal as detected by an integrating device is described by: ( ) ( ( ) ( )) ( ( ) ( )) ( ) ( ) ( ) ( ) ( ) f-2f ω 2ω ω 2ω ω 2ω ω 2ω D I ω = E ω +E ω E ω +E ω =I ω +I ω +2 I ω I ω cos φ+φ +ω Δt+π/2 ⋅ ⋅ ⋅ ⋅ (4)
where the ΔφD is the phase difference between pulses introduced by the material dispersion. The third term in this equation creates a spectral intensity modulation where the phase of this pattern is in fact linearly related to φ. Thus extracting the phase of the spectral modulation provides the CEP value of the original pulse shifted by an unknown constant value.
Conventional techniques would read the spectrum with an optical spectrometer with a limiting reading frequency of 1 or 10 kHz. The TOUCAN technique, which is based on dispersive Fourier transform, can reach higher data acquisition rate, because there is no dependence on an optical spectrometer. The DFT itself is performed by propagating the laser through a dispersive optical element with very high group delay dispersion (GDD). When the laser pulse enters a dispersive medium, different frequency components travel at different phase velocities, accumulating different time delays. Consequently, the pulse duration is stretched by orders of magnitude above its original value. The resulting temporal shape will only be the function of the original spectral shape and the dispersion. Dispersion can be
considered as a transform, where each spectral component is mapped to the temporal domain. The relation between optical frequency and the corresponding time delay can be expressed in the far-field approximation [13] as:
( ) ( ) ( ) ( ) ( ) ( ) ( ) ( ) 0 0 0 2 3 0 0 0 0 T ω =GD ω +GDD ω ω-ω + 1 1 + TOD ω ω-ω + FOD ω ω-ω +... 2 6 ⋅ ⋅ ⋅ ⋅ ⋅ (5)
where ω is the angular frequency, ω0 is the central angular frequency, T is accumulated time delay of the laser pulse traveling through the medium. The phase derivatives present in the equation are abbreviated as GD: group delay (first order), GDD: group delay dispersion (second order), TOD third order dispersion, FOD fourth order dispersion, etc…The effect of the third and even higher order dispersion can be neglected, if its effect is marginal compared to the effect of the first order GD and the second order GDD. Thus, the frequency-time mapping becomes linear in frequency as:
( ) ( )0 ( ) (0 0)
T ω =GD ω +GDD ω ⋅ ω-ω (6)
Consequently, the spectral and temporal shape become congruent and by dispersing the output signal of an f-to-2f interferometer, the spectral interference pattern is mapped to the temporal domain. The stretched pulse duration can reach hundreds of nanoseconds, which allows for reading the temporal modulation with a relatively slow photodetector. The produced electric signal can then be digitized by an analog-to-digital (A/D) converter with a bandwidth at least twice the modulation frequency. The CEP drift can be extracted from the phase of the digital waveform, provided the dispersion is fully characterized.
3. Experimental setup
The concept has been demonstrated on a high-repetition rate system producing CEP stable few-cycle pulses equipped with a conventional f-to-2f measurement device for comparison and validation. The experimental setup comprises a commercial state-of-the-art mid-infrared (MIR) laser system operated at ELI-ALPS [16] and the MIR laser setup is shown in Fig. 1(a). The system produces passively CEP stabilized 150 µJ, 4 optical-cycle (42 fs) pulses centered at 3.2 µm at a repetition rate of 100 kHz. This OPCPA system uses a Dazzler (Fastlite) [17] to accurately shape the spectral amplitude and control the phase, including the CEP. Therefore, the CEP of the output pulses can be set to an arbitrary value in a very simple way. A sampled portion of the compressed output is sent to a commercial CEP measurement device based on a f-to-2f interferometer and a conventional grating spectrometer (Fringeezz from Fastlite) [18]. This device is able to record single shot CEP values at an under sampled repetition rate of 10 kHz, that is one pulse out of 10 on the 100 kHz laser system, and it is used for calibration and cross-checking purposes.
Another fraction of the laser output is steered towards the TOUCAN setup. The experimental arrangement of this single-shot CEP drift measurement device is shown in Fig. 1(b). The device consists of a f-to-2f interferometer and a DFT measuring system. Dispersion is achieved in the current case by propagation in a dispersion compensation fiber (DCF, FSC-DCM-014D, OFS/Lucent). The spectral modulations originating from the f-to-2f interferometer (described in the concept section) are mapped into the temporal domain and detected by an InGaAs photodiode (DET01CFC, Thorlabs). The temporal waveform is then digitized and recorded with a 600 MHz oscilloscope (RTO2004, R&S). The oscilloscope was operated in segmented memory mode (ultra segmentation) in order to record every waveform at the full repetition rate of 100 kHz [19].
Fig. 1 drift m
A typical Fig. 2. for dif delay is 178 f shifted with th Fig. 2 CEP v betwe 4. Dispersio The dispersiv technique req content from . (a) Scheme of th measurement and F f-to-2f interfer fferent CEP va fs between the he CEP value a 2. f-to-2f spectral values. The dashe een CEP and the po
on characteri
ve element in quires an accur the temporal
he MIR laser syste Fringeezz grating s
rence pattern r alues. The spac e fundamental as predicted by
interference patte ed lines are fitted osition of these ma ization the experimen rate characteriz waveform. Se em. (b) Schematic spectrometer based recorded using cing of the inte and second ha y Eq. (4).
ern recorded with d on spectral fring
axima can be obse
ntal DFT setup zation of the fi everal methods cs of the TOUCAN d cross-checking. g the grating sp erference patte armonic pulse. h grating spectrom ge maxima. Linea erved. p is a 1.88 km iber dispersion s are commonl
N single shot CEP
pectrometer is ern reveals that . The pattern i
meter for different ar correspondence m long DCF. T n to retrieve the ly used to me P shown in t the time s linearly t e The DFT e spectral easure the
dispersion based on interferometric techniques [20]. An ideal dispersion measurement technique would propagate a frequency comb in the fiber and detect on the oscilloscope the delays between each successive frequency line. Such a comb was not available, so the modulated spectrum from the f-to-2f, mimicking a periodic spectral etalon, was used.
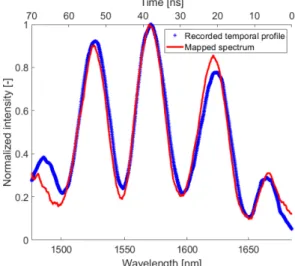
The ~100 ns temporal waveform was measured with the photodiode and oscilloscope. The spectral measurements were made using a high resolution optical spectrum analyzer (AQ6375 B, Yokogawa). Both measurements were low-pass filtered during processing to remove the high frequency noise. The modulation, as predicted by the preliminary calculation, is resolvable with the photodiode and the A/D converter of the oscilloscope. The fiber adds a positive chirp to the signal so the temporal waveform is reversed when compared to the spectrum, if plotted as a function of wavelength. Superposition is thus visualized with the time axis reversed (Fig. 3.). An excellent overlap is obtained when the frequency dependent time delay function (Eq. (5).) is fully retrieved.
Fig. 3. f-2-2f interference pattern used to determine the dispersion of the fiber. Superimposed are the temporal waveform recorded with a photodiode and digitalized by the oscilloscope plotted with a reversed time axis and the spectrum recorded with an optical spectrum analyzer.
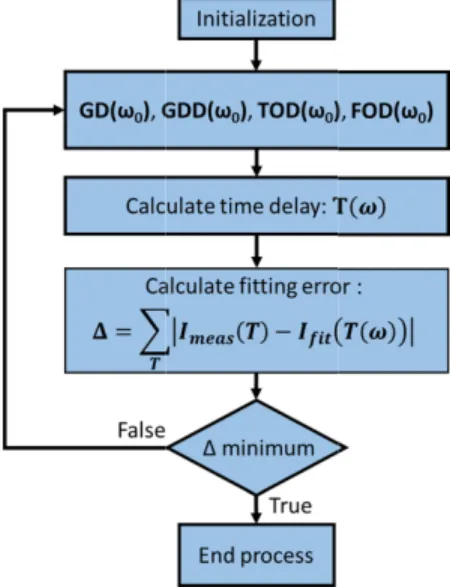
The different dispersion orders of the equation are determined by fitting the dispersed spectral signal over the whole temporal signal according to Eq. (5) using an iterative algorithm, shown in Fig. 4. In the first step, the dispersion parameters are given initial values and the resultant temporal profile is calculated. The difference between the measured and the calculated temporal signals are used as a fitting error, which is subsequently minimized via the iteration process. The most intense peaks have the highest weight in the fitting process, making local difference smaller for the main peaks when compared to the side peaks. The comparative measurement of the interference pattern was done for 13 data sets with different CEP values.
Fig. 4 orders The retrie includes dispe manufacturer, ps/nm calcula time delay me and a FOD o coefficients a insufficient to contribution. Fig. 5 corres the di 4. Schematic repre s.
eved time dela ersion coefficie , is −340 ps/nm ated from the
easurement co of −0.0084 ps4 are marginal t o characterize 5. Retrieved tim sponding dispersio spersion paramete esentation of the it ay function an ents up to the m at the wavele fitting parame ould also be ex 4. The contribu to the time de the dispersion me delay as the on parameter (blue er provided by the terative algorithm nd dispersion fourth order. T ength of 1550 n eters. The diff xtracted: a GDD ution of the F elay and as a n of the fiber function of the e) for the FSC-DC manufacturer. to determine the v parameter is The dispersion nm, which is v ferent dispersio D of 432.7 ps2 FOD and the h consequence, so Eq. (5) wa angular frequenc CM-014D fiber. T various dispersion plotted on Fig n value, provid very close to th on coefficient 2, a TOD of − higher order d Eq. (6) prov as used up to
cy (red) and the The black cross is n g. 5. and ed by the he −339.3 from the 0.537 ps3 dispersion ved to be the TOD e s
5. CEP drift
The CEP drif at the full rep The two data pulses for a memory. How statistical ana sets was achie are cut by the post-processin
In order to TOUCAN CE coincides wit data sets, acq properties of C (7). αi and βi are means [22] of vary between mean is small Figure 6. the ten possib compared to consistently, point on, the d as the decima Fig. 6 possib data s The CEP the 100 kHz T measureme ft of the pulses petition rate of a sets, gathered 1s time perio wever, one se alysis of the sh eved by creatin e LN-AOPDF ng and facilitat o correlate the EP data sets th the Fringeez quired by usin
CEP. The form
both sets of s f these sample n −1 (anticorre l, the resulting shows the corr ble decimated s the 0.982 at allowing the s down sampled ated data set.
6. Circular correlat ble decimated (10 et 9 matches the d fluctuation res TOUCAN data ent s is measured w 100 kHz and d by the two i od, which wa cond of data hort term CEP ng a few millise (Dazzler, Fig. ted synchroniz results from s was decimate zz data. This a ng circular corr mula for calcula
n i=1 cor. n i=1 R = sin
amples, with c es respectively. altion) and 1 ( value is close t relation coeffic sets, the second the maximum selection of the data set with ttion coefficients b kHz) CEP data s decimated Fringeez
ults are summa a set as well as
with a single sh with the Fring independent de as ultimately l corresponds to
change. The s econd long eve 1(a).). This “n ation between systems with d d [21], as on approach prod relation formu ating circular c ( ) ( ( ) i 1 n 2 i i=1 sin α -A sin β n α -A si ⋅ ⋅
circular charac . The Rcor. circ (correlation), a to unwrapped P cient of the ten d highest corre m. This huge e exact corresp the highest corbetween the Fring set measured by th zz CEP data.
arized in Table the decimated
hot at the sam geezz device at evices, contain limited by the o 100,000 sho synchronizatio ent where the s no-seed” event
data sets. different repeti ne of the 10 p duces the highe ula [21] due to correlation coe ) ( ) i 2 i β -B in β -B cteristics, whil cular correlatio and if the devi Pearson correl n possible deci elation coeffici peak appeared ponding data s rrelation coeffi
geezz CEP drift da the TOUCAN met
e 1. The CEP n d data set but n
me time using T t 10 kHz samp ns the CEP dr e oscilloscope ots which is a on of the two C
seed for the OP t was distingui ition rates, the
possible meas est correlation o the circular efficient is show le A and B are on coefficient v iation from the lation coefficie imated data set ient reaches on d in every ex sets reliably. F icient will be re
ata set and the ten thod. In this case
noise is calcula no significant d TOUCAN pling rate. rift of the e internal ample for CEP data PA stages ishable in 100 kHz surements n between algebraic wn in Eq. (7) e circular value can e circular ent. ts. Out of nly 0.491, xperiment From this eferred to n , ated from difference
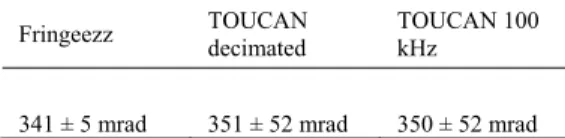
is found as decimating a data set is not equivalent to low-pass filtering the data [23]. After decimation, high-frequency noise contributions are aliased into the lower frequency region, which means that the overall noise level does not change significantly. The measurements with the conventional technique gives a smaller CEP noise standard deviation than the TOUCAN method. The reported uncertainty of the Fringeezz measurement originate from the spectral resolution of the grating spectrometer, provided by the manufacturer. The uncertainty of the TOUCAN method originates from the temporal resolution of the recorded waveforms and partly on time jitter affecting the measurement. The measurement resolution is set by the time resolution of the oscilloscope. The frequency to time mapping is not perfectly linear so the CEP resolution differs at different time in the waveform. For instance, the CEP resolution ranges from 33 to 43 mrad along the recorded waveform and is 38 mrad at the center where the CEP value is extracted. Multiple data points are used for the CEP extraction so this value should only be considered as an upper bound for the uncertainty. The standard deviation of the time jitter is 126 ps, which translates to an additional 48 mrad CEP noise. The combined random error can be calculated by taking the root sum of squares of these two uncertainties, which is also displayed in Table 1.
Table 1. Measured CEP noise by different methods
Fringeezz TOUCAN decimated TOUCAN 100 kHz
341 ± 5 mrad 351 ± 52 mrad 350 ± 52 mrad
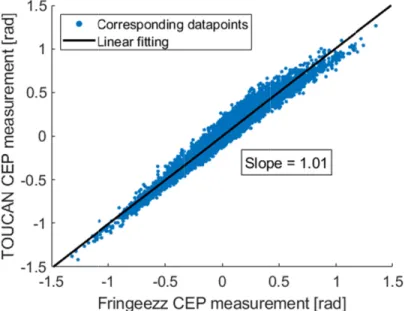
The validation of TOUCAN with the Fringeezz measurements is not straightforward as data set is being compared with another undersampled data set. The CEP standard deviation calculated on both data sets can be identical although the data may be uncorrelated i.e., the measured Fringeezz 10 kHz data set is shifted in time by several pulses compared to the decimated set. In this case, a correlation evaluation should identify the corresponding 10 kHz data sets. However, the correlation coefficient is insufficient to warrant the correct calibration of the device because multiplying one of the data set by an arbitrary small number would still produce almost the same correlation value. Then, in order to certify the CEP calibration, a linear fitting was performed on the scatter plot of the corresponding data sets (Fig. 7.). The slope indicates the relative magnification of the measured CEP between the two measurement techniques. A slope of 1 would be a high correlation (all points scattered along a narrow line) would confirm a proper calibration, which was the case in almost all experiments.
Fig. 7 and b black
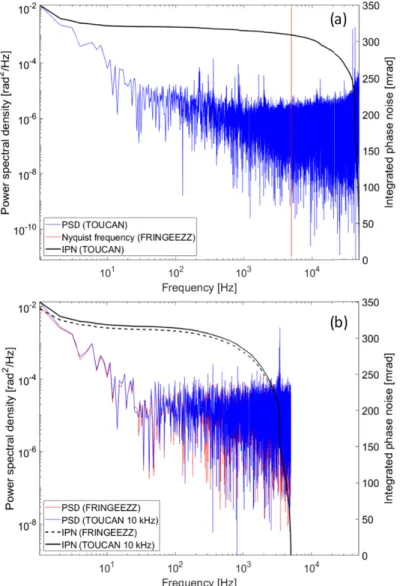
The record integrated pha for the decima (on Fig. 8(b). both methods However, the attributed to frequency for Noise con kHz. One big feedback sign the Nyquist f reaches 88% noise could on CEP detection 7. The correlation by TOUCAN tech line.
ded CEP noise ase noise (IPN) ated TOUCAN ) are almost co s exhibit large se frequency c aliasing of t the 10 kHz me ntributions mos g motivation nal for CEP sta frequency. The of the full inte nly be compen n.
of CEP data-poin hnique. Linear fitti
e was also anal ) for the TOUC N and the Fring
ompletely over e peaks at the omponents are the actual noi easurement) an stly stem from
for real time abilization loop e integrated ph egral between 5 nsated with a 10
nts measured by t ing with slope of
lyzed with the CAN CEP mea geezz measurem rlapping over t same frequen e distributed di ise component nd visible on th the resonance single-shot C p. Any such sta hase noise calc 5 kHz and 50 k 00 kHz feedba the undersampled f 1.01 is displayed power spectra asurement at 10 ment at 10 kHz the entire rang ncies, further v ifferently on th ts recorded a he 100 kHz PS below 10 Hz ( CEP drift mea
abilization loop culated from T kHz. This spec ack-loop based d Fringeezz device d with continuous al density (PSD 00 kHz (Fig. 8 z (Fig. 8(b).). B ge of data. Add validating thes he 100 kHz PSD above 5 kHz SD [23].
(slow drift) and surement is c p can cancel no TOUCAN mea ctral range of t on 100 kHz si e s D) and the 8(a).), and Both PSD ditionally, se results. D. This is (Nyquist d above 5 creating a oise up to asurement the phase ingle-shot
Fig. 8 the co (red li (blue (red li 6. Time jitte The timing sy oscillator of t Unfortunately directly affect cause additio spectrometer. etalon (uncoa replica of th transmitted pu higher freque 8. (a) PSD of the C orresponding IPN ine) (b) PSD of th line), and the corr ine), and the corre
er compensat
ystem of the M the laser system y, any time jit
ts the position onal artificial In order to e ated 100 µm th e pulses with ulses generates ncy. This supe
CEP measured with (black line). The he CEP measured w
responding IPN (b sponding IPN (das
tion
MIR laser provi m) which was tter present be of the peaks a CEP noise co evaluate and m hick YAG pla h a known an s a spectral inte erimposed mod
h the TOUCAN m Nyquist frequency with the TOUCAN black line). PSD m shed black line).
ides 100 kHz T used to trigge etween the out and consequen ompared to a mitigate the im ate) is introduc nd fixed delay erference, simi dulation patter method at a 100 kH y of the Fringeezz N method and dec measured with Fri
TTL signal (tri er the oscillosc utput laser puls ntly the measur measurement mpact of the tim
ced before the y. The time d ilar to the f-to-rn is also trans
Hz (blue line), and z is also displayed cimated to 10 kHz ingeezz at 10 kHz
iggered from th cope in the exp se and the TT red CEP drift. t using a con me jitter a Fab e DFT fiber to delay between -2f signal, alth sformed to the d d z z he master periment. TL signal This can nventional bry-Pérot o create a the two hough at a temporal
domain in th frequency mo change of th modulations a signal is dete extracted from performed by The shot-t domain of th measurement Compared to uncertainty. C Resulting stat noise caused other sources measurements Fig. 9 while and in The uncer exceed that of the bandwidth increased by approach is resolution dat 7. Conclusio A new cost e verified. TOU demonstrated and emitting drift measurem he DFT fiber, odulation is on he carrier env are separated b ermined by em m the high-pa applying inver to-shot tempor he filtered f-to can be obta the uncorrec Circular correl tistical values a
by the time jit in the frequen s are mostly id
9. (a) Double inter the time jitter is ntegrated phase no Table 2 Fring 341 ± rtainty of the T f the Fringeezz h of the oscillo using a longe to use a data ta acquisition a ons effective and s UCAN is capab on a state of at 3.2 µm. The ment and CEP
as shown on nly dependent velope phase. by Fourier spec mploying a low ass filtered sp
rse Fourier tran ral displacemen o-2f signal. T ained, mitigat cted values, th lation coefficie are displayed in tter (Fig. 9(b). ncy domain. Fo dentical to the u rference pattern w encoded in the hi ise function of tim
2. Time jitter com
geezz TOde
± 5 mrad 34
TOUCAN mea z device. The r oscope. The dis er fiber, reduc a acquisition s and processing. simple method ble of single-sh the art CEP st e CEP extracti P stabilization n Fig. 9(a). Th on time jitter In post-proc ctral analysis. T w-pass filterin pectrum. Time nsform on thes nt caused by ti This way a tru
ting one limi he time jitter ent is 0.99, an n Table 2. Des ) is mostly ov or this very rea uncorrected CE
with the CEP enco gh frequency mod me jitter. mpensated CEP n OUCAN ecimated 40 ± 19 mrad surement can b esolution of th spersion and co cing the uncer
system specifi .
d for CEP drif hot measuremen table few-cycle ion is done in can be perform he change in r and complete essing the tw The original si ng, while sing e domain stati se separated sp ime jitter can b uly jitter free itation of the
corrected CEP nd the slope o spite the impro vershadowed b ason the PSD an
EP drift measur
oded in low frequ dulation. (b) Powe noise measuremen TOUCAN 100 kHz 338 ± 19 mrad be further imp he recorded wa onsequently, th rtainty of the ically designe ft detection ha nts at arbitrary es laser system post processin med at the mom
the phase of ely independen wo different f ingle modulatio gle-shot time j istical analysi pectra. be used to shift single-shot C e TOUCAN a P drift data h of linear fitting oved statistics, by the phase no and IPN of the j
rements. uency modulation er spectral density nt proved to match aveforms was li he pulse duratio measurement. d for continu as been develo y repetition rate m operating at ng, so no real t ment. Howeve the high nt on the frequency on f-to-2f jitter was s can be ft the time CEP drift approach. has lower g is 0.99. the phase oise from jitter free , y h or even imited by on can be Another uous high oped and e and was 100 kHz time CEP er, we are
currently working on dedicated electronics able to extract the CEP on the fly at the full repetition rate.
The TOUCAN experimental setup designed for this 100 kHz experiment is suitable without modifications for measurements at a repetition rate up to 10 MHz. The method can be possibly applied at even higher repetition rates with less dispersive fibers and faster scopes, with limitations imposed by the photodiode response time; the bandwidth of the dedicated DAQ hardware and analog data acquisition and recording times. For this reason, the prospect of MHz or even GHz single-shot CEP drift detection with the TOUCAN technique warrants further investigations. Also, many other laser systems produce few cycle pulses directly from an OPCPA or via postcompression however in the near IR spectral range (800 nm to 1030 nm) with some of them operated at repetition rates in excess of 100 kHz. Further investigations are being carried out to transfer this concept to the single shot measurement of the CEP noise to this spectral range. In fact, many CEP sensitive experiments may require an actual pulse tagging if the laser system CEP noise cannot be reduced sufficiently.
The energy needed for the CEP detection with the TOUCAN method was 2.5 µJ minimum with the current setup. This can be significantly lowered as f-to-2f interferometers with specialized optics require only nJ energies, and avalanche photodetectors sensitive at the telecom wavelength are readily available. With further development the energy requirements can be decreased orders of magnitude below that of the single-shot stereo-ATI phase meter.
Funding
European Union - ELI-ALPS project (GOP-1.1.1.-12/B-2012- 0001, GINOP-2.3.6-15-2015-00001), European Regional Development Fund, Laserlab-Europe EU-H2020 654148, Institut Universitaire de France.
References
1. A. Baltuška, T. Udem, M. Uiberacker, M. Hentschel, E. Goulielmakis, Ch. Gohle, R. Holzwarth, V. S. Yakovlev, A. Scrinzi, T. W. Hänsch, and F. Krausz, “Attosecond control of electronic processes by intense light fields,” Nature 421(6923), 611–615 (2003).
2. S. Koke, C. Grebing, B. Manschwetus, and G. Steinmeyer, “Fast f-to-2f interferometer for a direct measurement of the carrier-envelope phase drift of ultrashort amplified laser pulses,” Opt. Lett. 33(21), 2545–2547 (2008). 3. H. R. Telle, G. Steinmeyer, A. E. Dunlop, J. Stenger, D. H. Sutter, and U. Keller, “Carrier-envelope offset phase
control: A novel concept for absolute optical frequency measurement and ultrashort pulse generation,” Appl. Phys. B 69(4), 327–332 (1999).
4. M. Kakehata, H. Takada, Y. Kobayashi, K. Torizuka, Y. Fujihira, T. Homma, and H. Takahashi, “Single-shot measurement of carrier-envelope phase changes by spectral interferometry,” Opt. Lett. 26(18), 1436–1438 (2001).
5. A. Baltuska, M. Uiberacker, E. Goulielmakis, R. Kienberger, V. S. Yakovlev, T. Udem, T. W. Hansch, and F. Krausz, “Phase-controlled amplification of few-cycle laser pulses,” IEEE J. Sel. Top. Quantum Electron. 9(4), 972–989 (2003).
6. C. Feng, J.-F. Hergott, P.-M. Paul, X. Chen, O. Tcherbakoff, M. Comte, O. Gobert, M. Reduzzi, F. Calegari, C. Manzoni, M. Nisoli, and G. Sansone, “Complete analog control of the carrier-envelope-phase of a high-power laser amplifier,” Opt. Express 21(21), 25248–25256 (2013).
7. E. Cormier and P. Lambropoulos, ““Effect of the initial phase of the field in ionization by ultrashort laser pulses,” Eur. Phys. J. - At,” Mol. Opt. Plasma Phys. 2, 15–20 (1998).
8. T. Wittmann, B. Horvath, W. Helml, M. G. Schätzel, X. Gu, A. L. Cavalieri, G. G. Paulus, and R. Kienberger, “Single-shot carrier–envelope phase measurement of few-cycle laser pulses,” Nat. Phys. 5(5), 357–362 (2009). 9. A. M. Sayler, T. Rathje, W. Müller, K. Rühle, R. Kienberger, and G. G. Paulus, “Precise, real-time,
every-single-shot, carrier-envelope phase measurement of ultrashort laser pulses,” Opt. Lett. 36(1), 1–3 (2011).
10. H. Wang, M. Chini, E. Moon, H. Mashiko, C. Li, and Z. Chang, “Coupling between energy and phase in hollow-core fiber based f-to-2f interferometers,” Opt. Express 17(14), 12082–12089 (2009).
11. D. Hoff, F. J. Furch, T. Witting, K. Rühle, D. Adolph, A. M. Sayler, M. J. J. Vrakking, G. G. Paulus, and C. P. Schulz, “Continuous every-single-shot carrier-envelope phase measurement and control at 100 kHz,” Opt. Lett.
43(16), 3850–3853 (2018).
12. P. V. Kelkar, F. Coppinger, A. S. Bhushan, and B. Jalali, “Time-domain optical sensing,” Electron. Lett. 35(19), 1661–1662 (1999).
13. K. Goda and B. Jalali, “Dispersive Fourier transformation for fast continuous single-shot measurements,” Nat. Photonics 7(2), 102–112 (2013).
14. Y. C. Tong, L. Y. Chan, and H. K. Tsang, “Fibre dispersion or pulse spectrum measurement using a sampling oscilloscope,” Electron. Lett. 33(11), 983–985 (1997).
15. P. Ryczkowski, M. Närhi, C. Billet, J.-M. Merolla, G. Genty, and J. M. Dudley, “Real-time full-field
characterization of transient dissipative soliton dynamics in a mode-locked laser,” Nat. Photonics 12(4), 221–227 (2018).
16. N. Thiré, R. Maksimenka, B. Kiss, C. Ferchaud, G. Gitzinger, T. Pinoteau, H. Jousselin, S. Jarosch, P. Bizouard, V. Di Pietro, E. Cormier, K. Osvay, and N. Forget, “Highly stable, 15 W, few-cycle, 65 mrad CEP-noise mid-IR OPCPA for statistical physics,” Opt. Express 26(21), 26907–26915 (2018).
17. P. Tournois, “Acousto-optic programmable dispersive filter for adaptive compensation of group delay time dispersion in laser systems,” Opt. Commun. 140(4-6), 245–249 (1997).
18. F. Lücking, V. Crozatier, N. Forget, A. Assion, and F. Krausz, “Approaching the limits of carrier-envelope phase stability in a millijoule-class amplifier,” Opt. Lett. 39(13), 3884–3887 (2014).
19. “R&S®RTO2000 Oscilloscope User Manual,”
https://www.rohde-schwarz.com/webhelp/rto_html_usermanual_en/RTO_HTML_UserManual_en.htm.
20. J. Hult, R. S. Watt, and C. F. Kaminski, “Dispersion measurement in optical fibers using supercontinuum pulses,” J. Lit. Technol. 25(3), 820–824 (2007).
21. N. I. Fisher and A. J. Lee, “A correlation coefficient for circular data,” Biometrika 70(2), 327–332 (1983). 22. S. R. Jammalamadaka and A. Sengupta, Topics in Circular Statistics (World Scientific Pub Co Inc, 2001). 23. R. G. Lyons, Understanding Digital Signal Processing, II (Prentice Hall PTR, 2004).