HAL Id: hal-01061537
https://hal.archives-ouvertes.fr/hal-01061537
Submitted on 27 May 2020
HAL is a multi-disciplinary open access archive for the deposit and dissemination of sci-entific research documents, whether they are pub-lished or not. The documents may come from teaching and research institutions in France or abroad, or from public or private research centers.
L’archive ouverte pluridisciplinaire HAL, est destinée au dépôt et à la diffusion de documents scientifiques de niveau recherche, publiés ou non, émanant des établissements d’enseignement et de recherche français ou étrangers, des laboratoires publics ou privés.
Short-term dynamics of soil aggregate stability in the
field
Baptiste Algayer, Yves Le Bissonnais, Frédéric Darboux
To cite this version:
Baptiste Algayer, Yves Le Bissonnais, Frédéric Darboux. Short-term dynamics of soil aggregate sta-bility in the field. Soil Science Society of America Journal, Soil Science Society of America, 2014, 78 (4), pp.1168-1176. �10.2136/sssaj2014.01.0009�. �hal-01061537�
Version postprint
Version définitive du manuscrit publié dans / Final version of the manuscript published in:
Soil Science Society of America Journal, 2014, 78(4), 1168- http://dx.doi.org/10.2136/sssaj2014.01.0009
Short-term dynamics of soil aggregate stability in the field
Baptiste ALGAYER1, Yves LE BISSONNAIS2, Frédéric DARBOUX1
April 3, 2014
1Institut National de la Recherche Agronomique (Inra), UR 0272 Science du sol, Centre de
recherche Val de Loire, CS 40001, F-45075 Orléans Cedex 2, France.
2 Institut National de la Recherche Agronomique (Inra), UMR1221 LISAH, 2 place Viala,
F-34060 Montpellier, France.
Abstract
Aggregate stability is a key property affecting the movement and storage of water, seedling emergence and soil sensitivity to erosion. Many studies have shown that aggregate stability changes through time. Field monitoring studies performed with a relatively large (monthly) time step showed seasonal trend of aggregate stability. But shorter time step monitoring are required to explore dynamics of aggregate stability at short term. For now, biological activity was recognized to be the main factor of aggregate stability dynamic. But previous studies were currently based on the external stimulation of aggregate stability. The objectives of the study were to assess variations in aggregate stability at short time steps in the field and to identify the factors controlling these variations of stability. A six months field monitoring was performed at short time step (two to five days) on a bare field on
1 Corresponding author [email protected] 1 2 3 4 5 6 7 8 9 10 11 12 13 14 15 16 17 18 19
Version postprint
Version définitive du manuscrit publié dans / Final version of the manuscript published in:
Soil Science Society of America Journal, 2014, 78(4), 1168- http://dx.doi.org/10.2136/sssaj2014.01.0009 Luvisol without organic amendment. Aggregate stability was measured for both on surface and subsurface materials by the ISO/DIS 10930 method. Rain amount and intensity, air temperature and humidity, soil temperature, water content and hydric history, soil water repellency were measured as explanatory factors. The results showed that aggregate stability varied greatly (up to 40%) over a few days for both surface and subsurface. Short term dynamics of aggregate stability were already shown by laboratory experiments, but such dynamics was never observed in the field for a bare soil without external stimulation of biological activity. For the surface, short time step variations of surface aggregate
stability were primarily controlled by soil water content (WC0 and WC1/2), hydric history
(ΔWC4 and API) and rain intensity. While large changes in aggregate stability were found
for the subsurface, explanatory factors remain to be found.
Introduction
Aggregate stability corresponds to the capacity of a soil aggregate to keep its cohesion and not to break up into smaller fragments when it is submitted to the effect of water. The stability of soil aggregates is a key property since it affects the movement and storage of water, soi aeration, biological activity, seedling emergence, and root penetration (Gallardo-Carrera et al., 2007). It also affects soil sensitivity to erosion and crusting (Le Bissonnais, 1996; Bajracharya et al.,1998; Wang et al., 2013).
It is well-established that aggregate stability is a time dependent variable (e.g. Bullock et al. 1988; Caron et al., 1992; Bajracharya et al., 1998; Denef et al., 2001). For now, numerous field monitoring studies have identified a seasonal pattern, with the largest aggregate stabilities recorded in summer and the lowest values in winter (Bullock et al. 1988; Blackman, 1992; Chan et al. 1994; Dimoyiannis, 2009). Such studies have shown that the temporal variability of the aggregate stability, as measured at monthly time steps over a year, varied between 20% and 30%, depending upon the study. If seasonal trends of 20 21 22 23 24 25 26 27 28 29 30 31 32 33 34 35 36 37 38 39 40 41 42 43 44
Version postprint
Version définitive du manuscrit publié dans / Final version of the manuscript published in:
Soil Science Society of America Journal, 2014, 78(4), 1168- http://dx.doi.org/10.2136/sssaj2014.01.0009 aggregate stability variation are well identified, there is a lack of knowledge concerning the temporal dynamic of aggregate stability at shorter time step (few days).
Laboratory studies performed at short-term explored the mechanisms of aggregate stability variation and the influence of various factors: the biological activity, the wetting and drying cycles, the rain intensity and the freezing-thawing cycles. Such studies showed that aggregate stability increased when the biological activity was stimulated by organic amendment (e.g. Tisdall and Oades, 1982, Le Guillou et al., 2012), underlining that microbial activity has a positive effect on aggregate stability (e.g., Tisdall and Oades, 1982; Chenu et al. 2000). Soil temperature affects aggregate stability directly through freezing (Bullock et al. 1988) and indirectly through the stimulation of microbial activity. Rain affects aggregate stability of the soil surface through several processes, including the kinetic energy of raindrop impact and slaking (Shainberg et al., 2003). Soil water content at the time of sampling was found negatively correlated with aggregate stability (Perfect et al. 1990; Caron et al., 1992). Soil hydric history affects aggregate stability through physico-chemical processes (Utomo and Dexter, 1982; Kemper and Rosenau, 1984) and through its influence on microbial activity (Denef et al., 2001). Water repellency was shown to affect aggregate stability by decreasing the aggregates wetting rate, limiting the effect of slaking and microcracks formation (Piccolo and Mbagwu, 1999; Cosentino et al. 2006). According to this literature (e.g. Perfect et al. 1990; Blackman 1992; Suwardji and Eberbach, 1998; Denef et al., 2001; Cosentino et al., 2006), temporal dynamics of aggregate stability should be primarily controlled by biological activity. However, such studies have generally been based on either the external stimulation of biological activity by organic amendments (amended soils compared to non-amended soils) (e.g., Cosentino et al., 2006; Abiven et al., 2007; Le Guillou et al., 2012) or the comparison of soils with highly contrasting organic matter contents or management practices (e.g., Blackman 1992; Suwardji and Eberbach, 45 46 47 48 49 50 51 52 53 54 55 56 57 58 59 60 61 62 63 64 65 66 67 68 69
Version postprint
Version définitive du manuscrit publié dans / Final version of the manuscript published in:
Soil Science Society of America Journal, 2014, 78(4), 1168- http://dx.doi.org/10.2136/sssaj2014.01.0009 1998). Thus, there is a lack of information concerning the factors of aggregate stability temporal variation without external stimulation of the biological activity.
In the present study, a field monitoring of aggregate stability variations over time steps of a few days was conducted on a bare soil without stimulation of biological activity. The objectives were: 1) to assess how much aggregate stability can vary in the field at short time steps, and 2) to identify the factors controlling the variations of aggregate stability without stimulation of biological activity.
Material and method
Sampling sites
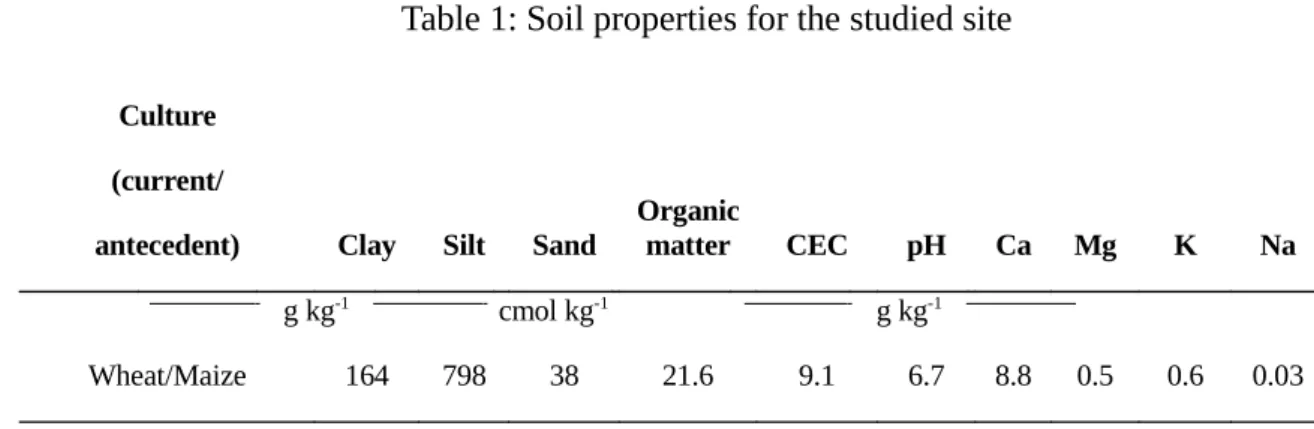
Field monitoring was performed on a site located in the southern part of the Parisian Basin (France), 15 kilometers southwest of the city of Chartres (48°21’5.12”N; 1°16’0.55”E). This site was located on a cultivated field on a typic Luvisol with a gentle slope (7%) oriented to the north. The field was sown with wheat, and soil was drained by subsurface pipes. The A horizons was a silt loam (Soil Survey Division Staff, 1993), with 16% clay and 2.2% organic matter. Other soil characteristics are shown in table 1.
Monitoring and sampling setup
A 50 m² rectangular plot (12 meter in length and 4 meter in width) was defined within the crop field. The plot was kept bare with herbicide (Bayer jardin, versatile weedkiller, 7 g/l glyphosate) during the 6 months of monitoring to facilitate sampling and minimize the effects of vegetation on aggregate stability. The effect of glyphosate on aggregate stability has never been studied according to our knowledge. Monitoring was conducted during six months in 2011. It started just after the seedbed preparation and sowing, on 9 March and it ended on 18 August. 70 71 72 73 74 75 76 77 78 79 80 81 82 83 84 85 86 87 88 89 90 91 92
Version postprint
Version définitive du manuscrit publié dans / Final version of the manuscript published in:
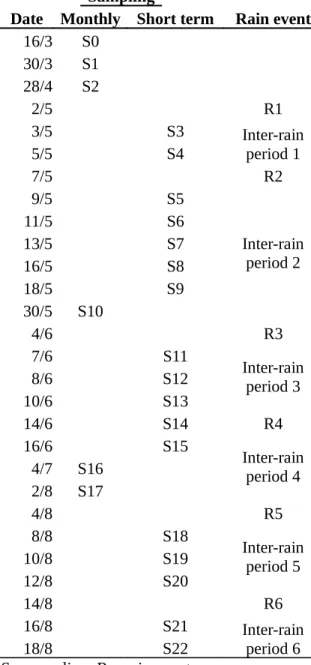
Soil Science Society of America Journal, 2014, 78(4), 1168- http://dx.doi.org/10.2136/sssaj2014.01.0009 The plot was divided in one-meter-square subplots using plastic sticks. During the monitoring, each subplot was sampled only once. Sampling was carried out at two time scales: a regular monthly time step and at a shorter time step (two to five days) during the two weeks after a significant rain event (Table 2). For each monthly sampling, three distinct samples were collected on non-adjacent subplots from each 50 m² plot to assess the spatial variability of the measured variables within a plot. During the monitoring, 6 rain events were considered as significant based on their duration, rain amount and maximum intensity. Sampling at shorter time step (2 to 5 days) was performed during the inter-rain periods (Table 2).
From a subplot, paired samples of surface and subsurface materials were always collected separately. For the surface samples, material was carefully collected from the top 5 mm using a small spatula. When the soil surface was crusted (Bresson and Boiffin, 1990), large pieces (2-to-20 cm²) of the crust material were collected using a sharp knife to cut through the crust without affecting its structure. The subsurface material was defined as the material between 1 cm and 5 cm below the soil surface. It was carefully collected using a small spade. After May 5, the soil surfaces presented a structural crust, which developed into a sedimentary crust after August 2.
For each material (surface and subsurface), samples were divided into 5 subsamples in order to measure aggregate stability, water content at the sampling time, organic matter content, microbial biomass and water repellency. For aggregate stability, samples were dried at 40°C during 2 days and stored at 4°C before measurement. For organic matter content and microbial biomass, fresh soil samples were sieved at 5 mm and stored at 4°C before measurement. For water repellency, fresh samples were stored at 4°C.
93 94 95 96 97 98 99 100 101 102 103 104 105 106 107 108 109 110 111 112 113 114 115
Version postprint
Version définitive du manuscrit publié dans / Final version of the manuscript published in:
Soil Science Society of America Journal, 2014, 78(4), 1168- http://dx.doi.org/10.2136/sssaj2014.01.0009
Measurements Aggregate stability
Aggregate stability was measured using a modified version of the ISO/DIS 10930 (2012) method which is based on Le Bissonnais (1996). Two tests were considered: fast wetting (FW) and slow wetting (SW). 5 g sub-samples were dried at 40°C for 24 h prior to each test, and each test was replicated three times. Following each stability test, the resulting fragments were sieved in ethanol, and results are presented using the mean weighted diameter of the fragments (MWD) (Le Bissonnais, 1996). The results of each test
(hereafter referred as MWDFW and MWDSW) were considered separately to analyze the
resistance of the material against specific processes (slaking for the fast wetting test and differential clay swelling for the slow wetting test). Each MWD value corresponds to one of five classes of stability: MWD above 2 mm corresponds to very stable material, between 2 and 1.3 mm corresponds to stable material, between 1.3 and 0.8 mm corresponds to median stability, between 0.8 and 0.4 mm corresponds to unstable material, and lower than 0.4 mm corresponds to very low stability (Le Bissonnais, 1996).
Organic matter content and microbial biomass
As soil was kept bare and no organic amendment was incorporated, biological activity was not expected to change much during the monitoring. Organic matter content and microbial biomass were measured, as control measurements, to characterize the biological activity. Organic matter content was measured using the sulfochromic oxidation method (ISO 14235, 1998), microbial biomass using the fumigation method (ISO 14240-2, 1997). 116 117 118 119 120 121 122 123 124 125 126 127 128 129 130 131 132 133 134 135 136
Version postprint
Version définitive du manuscrit publié dans / Final version of the manuscript published in:
Soil Science Society of America Journal, 2014, 78(4), 1168- http://dx.doi.org/10.2136/sssaj2014.01.0009
Potential explanatory variables
Air relative humidity and temperature, rain amount and intensity, soil water content and hydric history, and water repellency of the aggregates, were considered as potential explanatory factors of aggregate stability variations.
The air relative humidity and temperature were recorded hourly (Vaisala, HMP45C) at 1.5 m above ground.
Rain amount was measured hourly using a rain gauge (Campbell Scientific, ARG 100). Average rain intensity and maximum rain intensity was calculated for each rain event. To characterize the amount of rainfall in the days preceding a sampling date, an antecedent precipitation index (API) was calculated from the rainfall data using a 7-day duration as:
Pi
where i is the ith day before sampling and P
i (in mm) is the total precipitation height on
the ith day.
Soil water content was measured at each sampling time by the gravimetric method carried out on the surface and subsurface samples. Volumetric soil water content and soil temperature were measured hourly using TDR and thermistor probes (Decagon Devices, soil moisture sensor 5TE) at two depths (1 cm and 5 cm) and at two different locations in each plot (4 probes per plot) for the whole monitoring duration. According to their design principle, TDR probes are known to show approximate data for very top soils. A preliminary analysis was performed to compare gravimetric water content data and volumetric water content data for the 19 sampling times. Results showed that these measurements were significantly correlated and showed similar results (r²= 0.79).
To characterize the hydric history of the soil, two indices were calculated from the water content data: the mean of water content for a duration t (in days) prior sampling
(WCt) and the difference in water content between the beginning and the end of that period
137 138 139 140 141 142 143 144 145 146 147 148 149 150 151 152 153 154 155 156 157 158 159 160 161
Version postprint
Version définitive du manuscrit publié dans / Final version of the manuscript published in:
Soil Science Society of America Journal, 2014, 78(4), 1168- http://dx.doi.org/10.2136/sssaj2014.01.0009
(ΔWCt). A preliminary analysis based on a correlation analysis was performed to identify
the duration of both hydric history indices that was the most relevant to aggregate stability changes. For both indices, durations ranging from 0.25 to 8 days were tested. Results
showed that the most-significant durations were half day for water content (WC1/2) and 4
days for the difference in water content (ΔWC4).
Subcritical water repellency was measured with the intrinsic sorptivity method (Tillman et al., 1989). The experimental design described by Hallett and Young (1999) was used. Measurements were performed on 1-cm-diameter aggregates, on surface samples only. Samples were dried at 40°C during the 48 h prior to measurements. When the soil surface was crusted, measurements were made on the top of 1 cm² crust fragments. Subcritical water repellency was expressed as the water repellency index R defined by Tillman et al. (1989). The given R value corresponds to the mean of 10 replicates. A higher R value means a larger water repellency. An R index equal to 1.0 corresponds to a completely repellent material, an R index between 1.0 and 1.95 corresponds to a non-repellent material and an R index higher than 1.95 corresponds to a subcritical water repellent material (Tillman et al., 1989).
Statistical analysis
Statistical analysis were completed using R software version 2.9.2 (R Development Core Team, 2011). The short time step variability was considered as significant when its coefficient of variation (CV) was significantly larger than the CV of the spatial variability measured at the monthly time step. Throughout the whole study, a 5% significance level was considered. Linear correlation analysis (Pearson’s coefficient) were used to identify relationships between the MWD and the other factors. This analysis was carried out for the surface and subsurface datasets separately. In order to classify the identified factors, and to 162 163 164 165 166 167 168 169 170 171 172 173 174 175 176 177 178 179 180 181 182 183 184 185
Version postprint
Version définitive du manuscrit publié dans / Final version of the manuscript published in:
Soil Science Society of America Journal, 2014, 78(4), 1168- http://dx.doi.org/10.2136/sssaj2014.01.0009 measure their combined effect on aggregate stability (MWD), simple and multiple regression analysis were carried out.
Results
Temporal variation of aggregate stability
MWDFW and MWDSW were significantly correlated (r=0.82, p-value <0.001). Because
the slow wetting test exhibited the largest temporal dynamics, only this test is detailed in the present section (Figures 1 and 2).
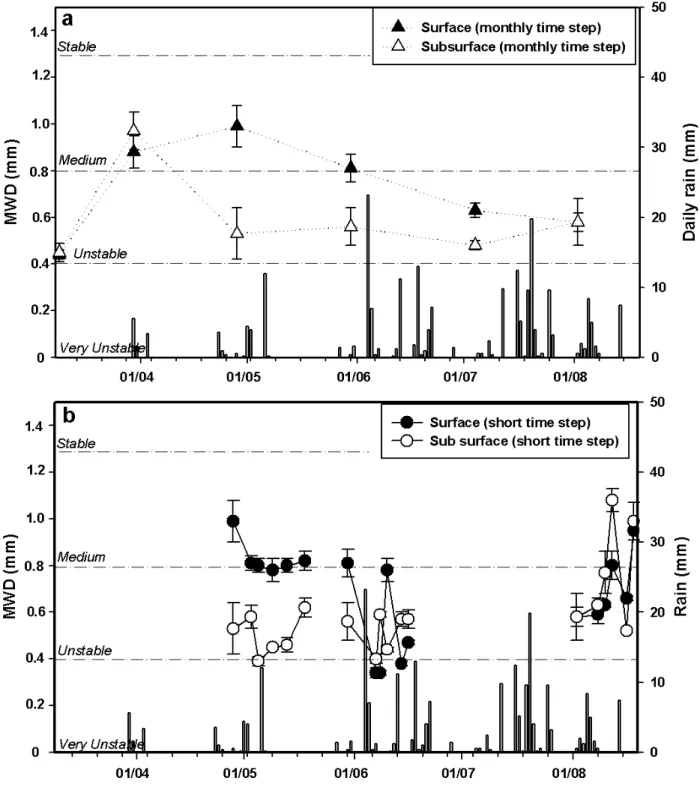
Based on the monthly samples, the largest spatial variability of the MWDSW at a given
time was 9% for the surface and 12% for the subsurface (Figure 1a). As it was explained
previously, variations above this threshold were considered as significant. During the
monitoring period, aggregate stability varied greatly for both the surface and the
subsurface. The surface MWDSW ranged from 0.34 mm (very unstable) to 0.99 mm
(medium stability), with a mean of 0.68 mm, a variance of 0.04 mm² and a CV of 29%.
The subsurface MWDSW ranged from 0.39 mm (very unstable) to 1.08 mm (medium
stability), with a mean of 0.60 mm, a variance of 0.04 mm² and a CV of 32%. Such dynamics in time are considered significant because there are larger than the spatial variability assessed at a given time by the monthly sampling (Figure 1a).
Considering the monthly time step only (Figure 1a), the CV of aggregate stability was 29% for the surface and 32% for the subsurface. Considering the short time step, aggregate stability also varied greatly for both surface and subsurface: the same CV were found for both surface and subsurface. Variance of the aggregate stability was similar between the monthly time step and the short time step monitoring (p-value = 0.8 for both surface and subsurface).
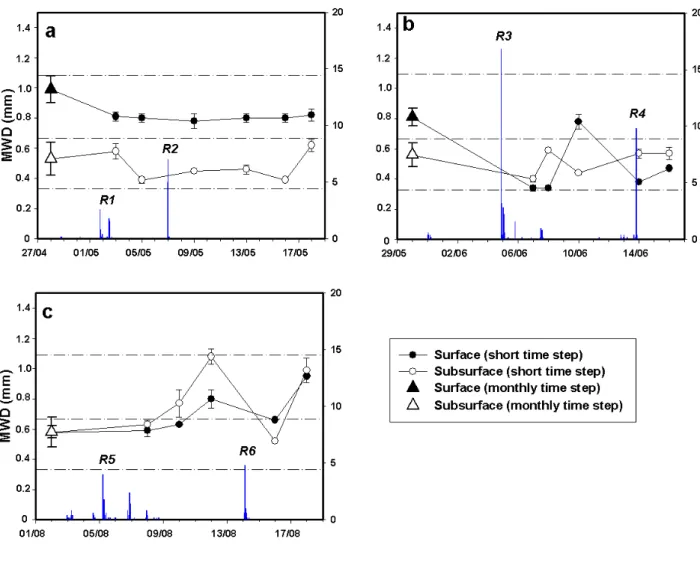
Short time step sampling periods showed various trends in aggregate stability (Figure 2). During the May short-time monitoring period (Figure 2a), the variance of surface 186 187 188 189 190 191 192 193 194 195 196 197 198 199 200 201 202 203 204 205 206 207 208 209 210
Version postprint
Version définitive du manuscrit publié dans / Final version of the manuscript published in:
Soil Science Society of America Journal, 2014, 78(4), 1168- http://dx.doi.org/10.2136/sssaj2014.01.0009
MWDSW was 0.01 mm² for both surface (CV=9%) and subsurface (CV=17%). The surface
MWDSW decreased significantly immediately after rain 1, but did not changed after R2.
Subsurface MWDSW did not varied significantly after both rain events. During June
short-time monitoring period (Figure 2b), the surface MWDSW showed a variance of 0.05 mm²
with a CV of 42%, while the subsurface MWDSW was much more stable (variance = 0.01
mm² and CV=15%). The surface MWDSW decreased significantly after R3 and R4,
showing its largest decrease after R4: from 0.78 mm (10 June, prior rainfall 4) to 0.38 mm
(14 June). Inter-rain periods 3 and 4 showed a significant increase of the MWDSW, the
largest increase of the MWDSW occurring during the inter-rain period 3: from 0.34 mm (8
June) to 0.78 mm (10 June). During August short-time step monitoring (Figure 2c), the
variance of MWDSW was 0.02 mm² for the surface (CV=20%) and 0.05 mm² for the
subsurface (CV=30%). Both surface and subsurface MWDSW kept stable after R5 but
decreased significantly after R6. Inter-rain periods 5 and 6 showed significant increase of
MWDSW for both surface and subsurface.
Explanatory variables
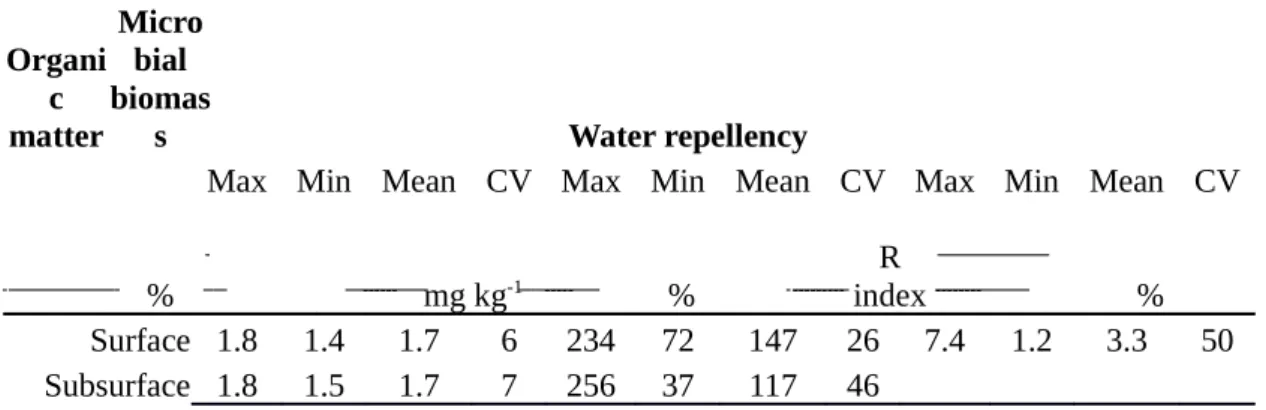
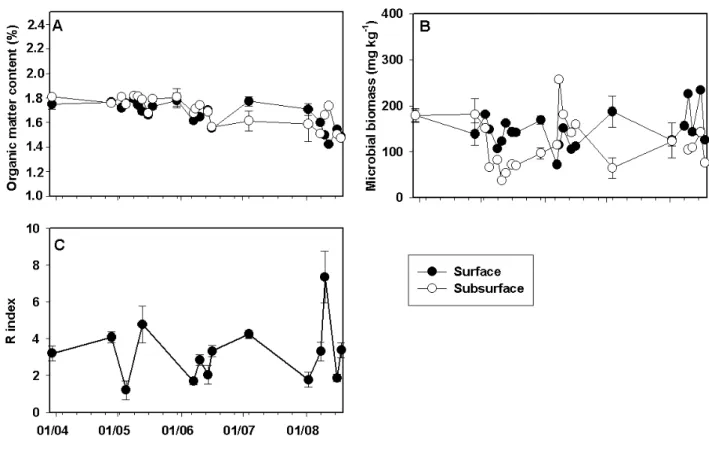
Results of the temporal dynamics of the explanatory variables are presented in Tables 3 and 4 and in Figures 3 and 4. Organic matter content varied between 1.8% and 1.4% , with a variance of 0.01 %² and a CV of 6% for both surface and subsurface (Figure 3a). Microbial biomass showed a larger variability: a variance of 1609 and a CV of 26% for the surface and a variance of 2767 and a CV of 43% for the subsurface (Figure 3b).
The R index of the surface was often larger than 1.95, indicating that the samples could present a subcritical hydrophobicity. Water repellency showed a large temporal variability with a CV of 50% (Table 3, Figure 3c).
211 212 213 214 215 216 217 218 219 220 221 222 223 224 225 226 227 228 229 230 231 232 233
Version postprint
Version définitive du manuscrit publié dans / Final version of the manuscript published in:
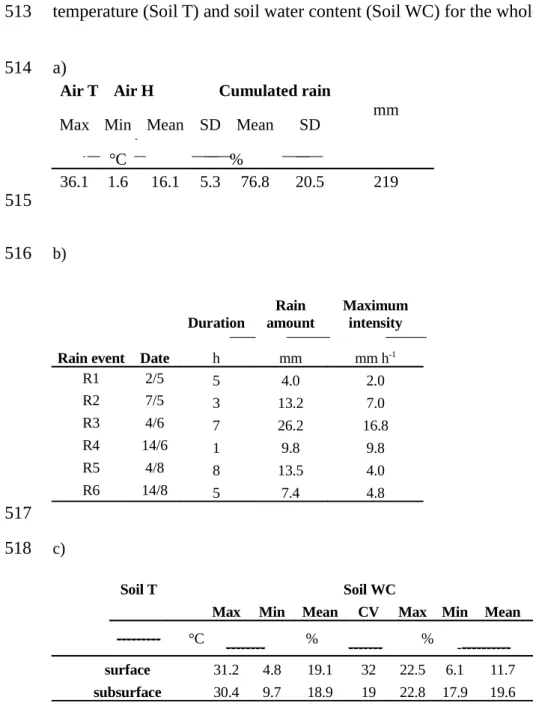
Soil Science Society of America Journal, 2014, 78(4), 1168- http://dx.doi.org/10.2136/sssaj2014.01.0009 Air temperature varied between 1.6°C and 36.1°C. Air temperature was always positive during the monitoring period, hence no freezing occurred. Soil surface temperature varied between 4.8°C and 31.2°C with a CV of 32%, while subsurface temperature varied between 9.7°C and 30.4°C with a CV of 19% (Figure 4a and 4b). The studied site exhibited a cumulated rain of 219 mm. Among the 6 rain event considered, R3 (June 4) presented the highest rain amount (26.2 mm in 7 hours) and a maximum intensity
of 16.8 mm h-1 (table 4b). The dynamic of the soil water content was very different between
the surface and the subsurface. Surface water content showed a variance of 10.3 %² and a CV of 28% while subsurface water content remained very stable (variance = 0.06 %² and CV=4%) (Table 3c; Figure 4c).
Relationships between aggregate stability and explanatory variables
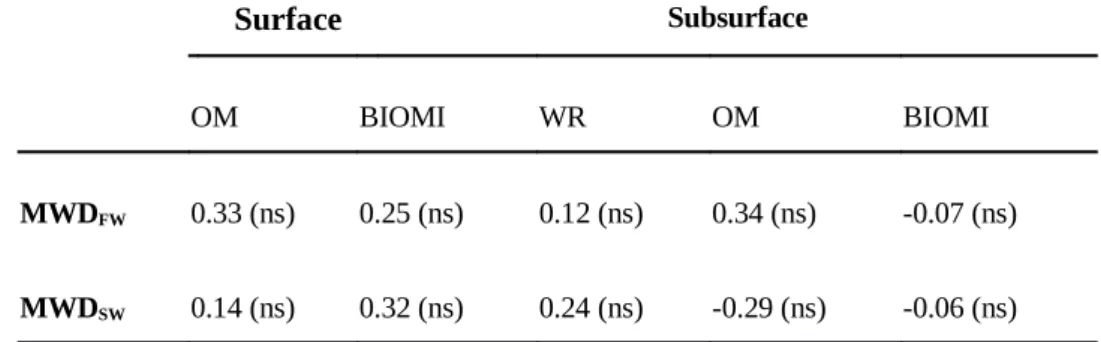
Aggregate stability did not significantly correlated with microbial biomass, organic matter and water repellency whatever the stability test (Table 5). The same results were found between MWD and air temperature, soil temperature or air humidity (not shown).
A correlation analysis was performed to test the influence of the rain characteristic on aggregate stability. For the 6 considered rain events, correlation coefficient were calculated between rain amount, mean intensity and maximum intensity, and the MWD value measured immediately after the rain event. The best correlation coefficient was found between the maximum intensity of the rain event and the surface MWD measured
immediately after the rain event (r= -0.77 for MWDFW and -0.83 for MWDSW). Mean rain
intensity and total rain amount did not correlate significantly with aggregate stability. Subsurface MWD did not correlate with rain event characteristics. The same analysis was performed between rain characteristics and the difference between MWD before and after the rain event. Here also, the best correlation coefficient was found between the maximum intensity of the rain event and the difference between MWD before and after the rain event 234 235 236 237 238 239 240 241 242 243 244 245 246 247 248 249 250 251 252 253 254 255 256 257 258
Version postprint
Version définitive du manuscrit publié dans / Final version of the manuscript published in:
Soil Science Society of America Journal, 2014, 78(4), 1168- http://dx.doi.org/10.2136/sssaj2014.01.0009
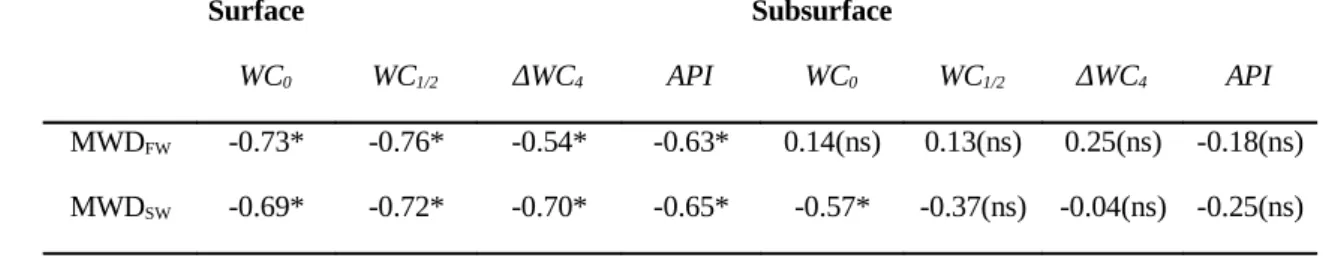
(r= 0.82 for MWDFW and 0.80 for MWDSW). Considering the soil water content and hydric
history, for the surface, the MWD was significantly and negatively correlated with the
WC0, WC1/2, ΔWC4 and API for both stability tests (Table 6). For the subsurface, no
significant correlation were found between any of the MWD and the variables linked to
hydric history (API, WC0, WC1/2 and ΔWC4), except for the MWDSW that significantly and
negatively correlated with WC0 (r=-0.57) (table 6).
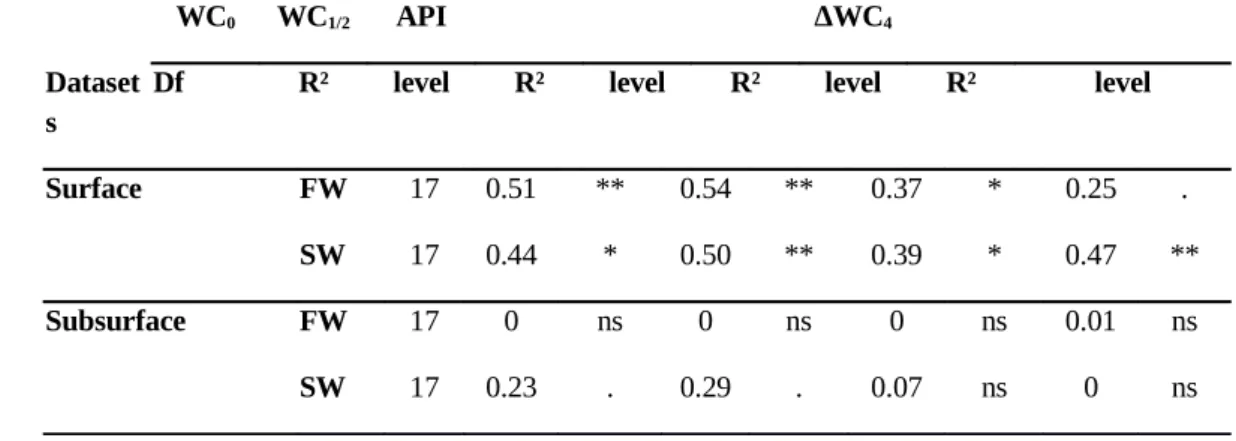
In order to classify the influence of each variable found to be significantly correlated with aggregate stability, and to measure the combined effect of these variables, regression
analysis were done. The considered variables were: WC0, WC1/2, API and ΔWC4 for the
surface, and WC0 for the subsurface. At first, simple regression analysis was conducted
(Table 7). For the subsurface, none of the simple regression models were significant,
regardless of the aggregate stability test. Considering the surface MWDFW, the best simple
regression model was with WC1/2 (54% of MWDFW variation). Models with WC0 or API
were also statistically significant (r²= 51% and 37 %, respectively). For the slow wetting test, all four models were significant, with r² between 39% and 50% (Table 7). The variables found to be significant during this simple regression analysis were combined in
multiple regression models (except WC0, WC1/2, and API, which were not independent).
Among all combinations, the only valid multiple regression models were found for the
surface. WC1/2 and ΔWC4 together accounted for 59% of the MWDSW, and the combination
of WC0 and ΔWC4 accounted for 57% of the MWDSW.
Discussion
Aggregate stability varied significantly at short time step
The results show that the aggregate stability in the field varied greatly at short time steps (of a few days). Variations up to 32% were measured for both surface and subsurface materials. Short term dynamics of aggregate stability was already observed during 259 260 261 262 263 264 265 266 267 268 269 270 271 272 273 274 275 276 277 278 279 280 281 282 283
Version postprint
Version définitive du manuscrit publié dans / Final version of the manuscript published in:
Soil Science Society of America Journal, 2014, 78(4), 1168- http://dx.doi.org/10.2136/sssaj2014.01.0009 laboratory experiments (e.g. Utomo and Dexter, 1982; Denef et al., 2001; Cosentino et al., 2006), but, according to our knowledge, only one study observed it in the field (Caron et al., 1992). Moreover, the variability of aggregate stability was never observed by field measurements for a bare soil without any external stimulation of biological activity.
Up to now, most field monitoring studies used monthly samplings to assess aggregate stability dynamics (Blackman, 1992; Bajracharya et al., 1998; Suwardji and Eberbach, 1998; Dimoyiannis, 2009). Such studies showed that during the year, aggregate stability could vary between 20% up to 30%. The present study showed that same variability of aggregate stability was occurring at a much smaller time scale. Moreover, for specific periods, aggregate stability can show a larger variability at short time step than at monthly time step. It was the case for the June monitoring period when surface aggregate stability varied up to 46% over a 7-day period, proving that large changes in aggregate stability are occurring over a few days. In some cases, variations in aggregate stability at short time steps induced changes of up to two stability classes. Such large changes would affect soil properties, such as storage of water, root penetration (Gallardo-Carrera et al., 2007) or soil
sensitivity to erosion (Le Bissonnais, 1996; Bajracharya et al.,1998; Wang et al., 2013), and
thus, should not be ignored by future studies.
Considering this short term dynamics, it appears clearly that monthly measurements are not enough to assess precisely the temporal dynamic of aggregate stability. Monthly time step monitoring give information on the dynamics of aggregate stability at the seasonal scale, but monthly estimation of aggregate stability cannot be used as actual values of aggregate stability at a given time. Short time step measurements are required to reach accurate assessments of aggregate stability.
Aggregate stability variation was primarily controlled by the rain intensity, soil water content and hydric history
284 285 286 287 288 289 290 291 292 293 294 295 296 297 298 299 300 301 302 303 304 305 306 307 308
Version postprint
Version définitive du manuscrit publié dans / Final version of the manuscript published in:
Soil Science Society of America Journal, 2014, 78(4), 1168- http://dx.doi.org/10.2136/sssaj2014.01.0009 In the present study, soil was kept bare during all the monitoring, and no amendments were incorporated. Aggregate stability did not significantly correlated with organic matter content nor microbial biomass, for both surface and subsurface. This result leads us to conclude that a stimulation of biologic activity (i.e. organic amendment) is required to make it affect aggregate stability.
Water repellency of the surface aggregates varied independently from the aggregate stability. Based on previous studies (Piccolo and Mbagwu, 1999; Cosentino et al., 2006; Goebel et al., 2012) this variable was expected to influence aggregate stability. In our case, the range of measured R index (between 1.9 and 7.0) did not correspond to very contrasted water repellencies. It seeems that more contrasted water repellencies are required to influence aggregate stability.
The result of the present study underlined the significant influence of rain events on surface aggregate stability dynamics. Aggregate stability decreased significantly after 4 of the 6 rain events. The largest decrease was observed for the rain 4 which showed the highest total rain amount and maximum rain intensity. According to the results of the correlation analysis, the maximum rain intensity appeared to be the dominant factor of aggregate stability decrease upon all the considered rain characteristics. The greater the maximum rain intensity, the greater the aggregate stability decrease. Relationships between rain amount and aggregate stability were observed in the field by monthly monitoring studies (Blackman, 1992; Bajracharya et al., 1998; Suwardji and Eberbach, 1998; Dimoyiannis, 2009). Usually, temporal patterns of precipitation are considered as an important factor in aggregate stability decrease through raindrop impact, which affects the structure of surface aggregates, and through the increase of soil water content (e.g. Shainberg et al., 2003; Dimoyiannis, 2009). The present study underlines the importance of rain intensity on the short time step aggregate stability decrease. More than the rain 309 310 311 312 313 314 315 316 317 318 319 320 321 322 323 324 325 326 327 328 329 330 331 332 333
Version postprint
Version définitive du manuscrit publié dans / Final version of the manuscript published in:
Soil Science Society of America Journal, 2014, 78(4), 1168- http://dx.doi.org/10.2136/sssaj2014.01.0009 amount, the maximum rain intensity seems to be a dominant indicator of surface aggregate stability decrease. However, as only six rain events were considered, such result must be taken carefully, and more detail studies should be conducted to confirm this observation. Subsurface aggregate stability was not related to rainfall characteristics
The results also showed that the soil water content and its dynamics were dominant
factors of surface aggregate stability. Soil water content at the time of sampling (WC0) and
few hours before sampling (WC1/2) were significantly and negatively correlated with
aggregate stability. Simple regression models with WC0 explained up to 51% of aggregate
stability variation (MWDFW), while simple regression models that included WC1/2
explained up to 54% of the aggregate stability variations (MWDFW), making WC1/2 the
dominant explanatory factor in aggregate stability variation at short time step.
Previous studies (e.g., Perfect et al., 1990; Blackman, 1992; Dymoyiannis, 2009) have found negative correlations between water content and aggregate stability variation at the monthly time step. The present study found similar relationships at a short time step (a few days) but for surface aggregate stability only. In a field monitoring study performed at short time step (2 days) on a bare soil, Caron et al. (1992) did not found significant
relationships between aggregate stability and WC0. In this previous study, samplings were
performed within the plowed layer (between -15 and -25 cm). Similarly, the present study
did not a relationship between aggregate stability and WC0.for the plowed layer (-1 to -5
cm). Such a relationship was found only for the soil surface (0 to -0.5 cm).
The soil hydric history indices ΔWC4 and API were found to be significant factors of
surface aggregate stability and were negatively correlated with aggregate stability for the soil surface. The relationship between the water content history and aggregate stability give two pieces of information. Firstly, aggregate stability decreases when the soil is getting more humid: the greater the wetting, the larger the decrease of aggregate stability. This 334 335 336 337 338 339 340 341 342 343 344 345 346 347 348 349 350 351 352 353 354 355 356 357 358
Version postprint
Version définitive du manuscrit publié dans / Final version of the manuscript published in:
Soil Science Society of America Journal, 2014, 78(4), 1168- http://dx.doi.org/10.2136/sssaj2014.01.0009 result confirms the negative influence of rain amount and intensity on aggregate stability that we previously observed. A high rain intensity provokes a rapid soil wetting with a large wetting amplitude that decreases aggregate stability (e.g. R3), while a rain event with a low rain intensity and thus a wetting with a small amplitude do not affect aggregate stability (e.g. R5). Secondly, aggregate stability increases when the soil is drying, and the more intense the drying, the larger the increase of aggregate stability: a large amplitude drying caused an increase in aggregate stability as it was the case during IR 3 and 6, while a small drying amplitude did not affect aggregate stability as for IR 1 and 2.
These results were previously observed by laboratory studies. They showed wetting cause a decrease of aggregate stability through physico-chemical processes such as the loss of inter-particle cohesion (Sheel et al., 2008), slaking (Zaher et al., 2005) and microcraking (Le Bissonnais, 1996). They also showed that drying increases aggregate stability by the formation of bonds between particles in relationship with clay flocculation and precipitation of soluble components (Kemper and Rosenau, 1984; Kemper et al., 1987; Dexter et al., 1988). While these relationships were only observed in laboratory experiments, the present study clearly observed similar relationships for field conditions, suggesting the same processes may be active.
Conclusions
Aggregate stability varied greatly over time steps of a few days for both surface and subsurface. Short term dynamics of aggregate stability were already shown by laboratory experiments, but such dynamics was never observed in the field for a bare soil without external stimulation of biological activity (i.e. no organic amendment). MWD variations of up to 42% were measured at short time step for specific periods proving that large changes in aggregate stability are occurring even in a few days. Such large changes are likely to affect soil properties such as storage of water and soil sensitivity to erosion, and thus, 359 360 361 362 363 364 365 366 367 368 369 370 371 372 373 374 375 376 377 378 379 380 381 382 383
Version postprint
Version définitive du manuscrit publié dans / Final version of the manuscript published in:
Soil Science Society of America Journal, 2014, 78(4), 1168- http://dx.doi.org/10.2136/sssaj2014.01.0009 should not be ignored. At the surface, short time step variations of aggregate stability were primarily related with water: Rain maximum intensity, water content at or close to the time
of sampling (WC0 and WC1/2), and hydric history indices (ΔWC4 and API) were the
dominant factors influencing surface aggregate stability. While large changes in aggregate stability were found for the subsurface, explanatory factors remain to be found. These results underline the dominant effect of abiotic factors such as water content dynamics on aggregate stability variations at a short time step in the field in the absence of biological activity stimulation. To improve the prediction of aggregate stability, further research should analyze the interactions between abiotic and biotic factors at short time step in the field. 384 385 386 387 388 389 390 391 392 393
Version postprint
Version définitive du manuscrit publié dans / Final version of the manuscript published in:
Soil Science Society of America Journal, 2014, 78(4), 1168- http://dx.doi.org/10.2136/sssaj2014.01.0009
References
Abiven S., S. Menasseri, D. A. Angers and P. Leterme. 2007. Dynamics of aggregate stability and biological binding agents during decomposition of organic materials. Eur. J. Soil Sci. 58:239-247.
Bajracharya R. M., R. Lal, and G. F. Hall. 1998. Temporal variation in properties of an uncropped, ploughed Miamian soil in relation to seasonal erodibility. Hydr. Proc. 12:1021-1030.
Bullock M. S., W. D. Kemper and S. D. Nelson. 1988. Soil cohesion as affected by freezing, water content, time and tillage. Soil Sci. Soc. Am. J., 52:770-776.
Blackman, J. D. 1992. Seasonal variation in the aggregate stability of downland soils. Soil Use and Management. 8:142-150.
Bresson L. and J. Boiffin. 1990. Morphological characterization of soil crust development stages on an experimental field. Geoderma. 47:301-325.
Caron J., B. D. Kay, J. A. Stone and R. G. Kachanoski. 1992. Modelling temporal changes in structural stability of a clay loam soil. Soil Sci. Soc. Am. J. 56:1597-1604.
Chan, K. Y., D. P. Heenan and R. Ashley. 1994. Seasonal changes in surface aggregate stability under different tillage and crops. Soil & Till. Res. 28:301-314.
Chenu C., Y. Le Bissonnais and D. Arrouays. 2000. Organic matter influence on clay wettability and soil aggregate stability. Soil Sci. Soc. Am. J. 64:1479-1486.
Cosentino D., C. Chenu and Y. Le Bissonnais. 2006. Aggregate stability and microbial community dynamics under drying–wetting cycles in a silt loam soil. Soil Bio. and Biochem. 38:2053-2062.
Denef K., J. Six, H. Bossuyt, S. D. Frey, E. T. Elliott, R. Merckx and K. Paustian. 2001. Influence of wet-dry cycles on the interrelationship between aggregates, particulate 394 395 396 397 398 399 400 401 402 403 404 405 406 407 408 409 410 411 412 413 414 415 416 417 418
Version postprint
Version définitive du manuscrit publié dans / Final version of the manuscript published in:
Soil Science Society of America Journal, 2014, 78(4), 1168- http://dx.doi.org/10.2136/sssaj2014.01.0009 organic matter and microbial community dynamics. Soil Bio. & Biochem. 33:1599-1611.
Dexter A. R., R. Horn and W. D. Kemper. 1988. Two mechanisms for age-hardening of soil. J. Soil Sci. 39:163-175.
Dimoyiannis D. 2009. Seasonal soil aggregate stability variation in relation to rainfall and temperature under Mediterranean conditions. Earth Surf. Proc. Land. 34:860-866. Gallardo-Carrera A., J. Léonard, Y. Duval and C. Dürr. 2007. Effects of seedbed structure
and water content at sowing on the development of soil surface crusting under rainfall. Soil & Till. Res. 95:207-217.
Goebel M. O., S. K. Woche and J. Bachmann. 2012. Quantitative analysis of liquid penetration kinetics and slaking of aggregates as related to solid-liquid interfacial properties. J. of Hydr. 442:63-74.
Hallett P. D. and I. M. Young. 1999. Changes to water repellence of soil aggregates caused by substrate-induced microbial activity. Eur. J. Soil Sci. 50:35-40.
ISO/DIS 10930. 2012. Soil quality - Measurement of the stability of soil aggregates subjected to the action of water. International Organization for Standardization, Geneva, Switzerland.
Kemper W. D. and R. C. Rosenau. 1984. Soil cohesion as affected by time and water content. Soil Sci. Soc. Am. J. 48:1001-1006.
Kemper W. D., R. C. Rosenau and A. R. Dexter. 1987. Cohesion development in disrupted soils as affected by clay and organic matter content and temperature Soil Sci. Soc. Am. J. 51:860-867.
Le Bissonnais Y. 1996. Aggregate stability and assessment of soil crustability and erodibility: I. Theory and methodology. Eur. J. Soil Sci. 47:425-437.
419 420 421 422 423 424 425 426 427 428 429 430 431 432 433 434 435 436 437 438 439 440 441 442
Version postprint
Version définitive du manuscrit publié dans / Final version of the manuscript published in:
Soil Science Society of America Journal, 2014, 78(4), 1168- http://dx.doi.org/10.2136/sssaj2014.01.0009 Le Guillou C., D. A. Angers, P. A. Maron, P. Leterme and S. Menasseri-Aubry. 2012.
Linking microbial community to soil water-stable aggregation during crop residue decomposition. Soil Bio. & Biochem. 50:126-133.
Perfect E., B. D. Kay, W. K. P. Van Loon, R. W. Sheard and T. Pojasok. 1990. Rates of change in soil structural stability under forages and corn. Soil Sci. Soc. Am. J. 54:179-186.
Piccolo A. and J. S. C. Mbagwu. 1999. Role of hydrophobic components of soil organic matter on aggregate stability. Soil Sci. Soc. Am. J. 63:1801-1810.
R Development Core Team. 2011 R: A Language and Environment for Statistical
Computing. R Foundation for Statistical Computing. At: http://www.R-project.org
Shainberg I., A. I. Mamedov and G. J. Levy. 2003. Role of wetting rate and rain energy in seal formation and erosion. Soil Sci. 168:54-62.
Sheel M., R. Seeman, M. Brinkmann, M. D. Michiel, A. Sheppard, B. Breidenbach and S. Herminghaus. 2008. Morphological clues to wet granular pile stability
Nat. materials. 2117:1-5.
Soil Survey Division Staff. 1993. Soil Survey Manual. Soil Conservation Service. United
State Department of Agriculture. Handbook 18. At:
http://soils.usda.gov/technical/manual/
Suwardji P. and P. Eberbach. 1998. Seasonal changes of physical properties of an Oxic Paleustalf (Red Kandosol) after 16 years of direct drilling or conventional cultivation. Soil & Til. Res. 49:65-77.
Tillman J. M., D. R. Scotter, M. G. Wallis and B.E. Clothier B. E. 1989. Water-repellency and its measurement by using intrinsic sorptivity. Aust. J. Soil Res. 27:637-644.
Tisdall J. M. and J. M. Oades. 1982. Organic matter and water stable aggregate in soils. J. Soil Sci. 33:141-163. 443 444 445 446 447 448 449 450 451 452 453 454 455 456 457 458 459 460 461 462 463 464 465 466 467
Version postprint
Version définitive du manuscrit publié dans / Final version of the manuscript published in:
Soil Science Society of America Journal, 2014, 78(4), 1168- http://dx.doi.org/10.2136/sssaj2014.01.0009 Utomo W. H. and A. R. Dexter. 1982. Changes in soil aggregate water stability induced by
wetting and drying cycles in non-saturated soil. Jour. Soil Sci. 33:623-637.
Wang, B., F. Zheng, F. Darboux and M. J. M. Römkens. 2013. Soil erodibility for water erosion. A perspective and Chinese experience. Geomorphology, 187:1-10.
Zaher H., J. Caron and B. Ouaki. 2005. Modeling aggregate internal pressure evolution following immersion to quantify mechanisms of structural stability. Soil Sci. Soc. Am. J. 69:1-12. 468 469 470 471 472 473 474
Version postprint
Version définitive du manuscrit publié dans / Final version of the manuscript published in:
Soil Science Society of America Journal, 2014, 78(4), 1168- http://dx.doi.org/10.2136/sssaj2014.01.0009
Figure caption
Figure 1: Temporal variation of aggregate stability for the slow wetting test of surface and
subsurface at montly time step (a) and short time step (b).
MWDSW monthly time step: each MWDSW point corresponds on the mean of three samples
located on the same plot (spatial variability) and 3 replicates for each measurements (n=9). Bars are standard errors.
MWD short time step: each MWD corresponds on the mean of three replicates (n=3). Bars are standard error.s
Stable, Medium, Unstable, Very unstable, refers to the aggregate stability classes (Le Bissonnais, 1996)
Figure 2: Temporal variation of aggregate stability for the slow wetting test at short time
step for (a) May , (b) June and (c) August.
MWD monthly time step: each MWD corresponds on the mean of three samples located on the same plot (spatial variability) and 3 replicates for each measurements (n=9). Bars are standard errors.
MWD short time step: each MWD corresponds on the mean of three replicates (n=3). Bars are standard errors.
R1, R2, R3, R4, R5, and R6 refer to the number of the rain event.
Figure 3: Temporal variation in (a) organic matter content, (b) microbial biomass and (c)
water repellency.
a and b: each point is the mean of three replicates; bars are standard errors. c: each point is the mean of 10 replicates; bars are standard errors.
Figure 4: Temporal dynamics of the soil variables; a) Surface soil temperature, b)
subsurface soil temperature, c) Volumic soil water content for surface and subsurface. 475 476 477 478 479 480 481 482 483 484 485 486 487 488 489 490 491 492 493 494 495 496 497 498
Version postprint
Version définitive du manuscrit publié dans / Final version of the manuscript published in:
Soil Science Society of America Journal, 2014, 78(4), 1168- http://dx.doi.org/10.2136/sssaj2014.01.0009 Curves are to the mean of two replicates
499 500
Version postprint
Version définitive du manuscrit publié dans / Final version of the manuscript published in:
Soil Science Society of America Journal, 2014, 78(4), 1168- http://dx.doi.org/10.2136/sssaj2014.01.0009
Table 1: Soil properties for the studied site Culture
(current/
antecedent) Clay Silt Sand Organic matter CEC pH Ca Mg K Na
g kg-1 cmol kg-1 g kg-1
Wheat/Maize 164 798 38 21.6 9.1 6.7 8.8 0.5 0.6 0.03
Version postprint
Version définitive du manuscrit publié dans / Final version of the manuscript published in:
Soil Science Society of America Journal, 2014, 78(4), 1168- http://dx.doi.org/10.2136/sssaj2014.01.0009 502
Version postprint
Version définitive du manuscrit publié dans / Final version of the manuscript published in:
Soil Science Society of America Journal, 2014, 78(4), 1168- http://dx.doi.org/10.2136/sssaj2014.01.0009
Table 2: Sampling pattern and rain events during field monitoring
Sampling
Date Monthly Short term Rain event
16/3 S0 30/3 S1 28/4 S2 2/5 R1 3/5 S3 Inter-rain period 1 5/5 S4 7/5 R2 9/5 S5 Inter-rain period 2 11/5 S6 13/5 S7 16/5 S8 18/5 S9 30/5 S10 4/6 R3 7/6 S11 Inter-rain period 3 8/6 S12 10/6 S13 14/6 S14 R4 16/6 S15 Inter-rain period 4 4/7 S16 2/8 S17 4/8 R5 8/8 S18 Inter-rain period 5 10/8 S19 12/8 S20 14/8 R6 16/8 S21 Inter-rain period 6 18/8 S22
S = sampling; R = rain event
503
504 505
Version postprint
Version définitive du manuscrit publié dans / Final version of the manuscript published in:
Soil Science Society of America Journal, 2014, 78(4), 1168- http://dx.doi.org/10.2136/sssaj2014.01.0009
Table 3: variability of the organic matter content, microbial biomass and water repellency of aggregates Organi c matter Micro bial biomas s Water repellency
Max Min Mean CV Max Min Mean CV Max Min Mean CV
% --- mg kg-1 --- % --- R index --- % Surface 1.8 1.4 1.7 6 234 72 147 26 7.4 1.2 3.3 50 Subsurface 1.8 1.5 1.7 7 256 37 117 46 506 507 508 509
Version postprint
Version définitive du manuscrit publié dans / Final version of the manuscript published in:
Soil Science Society of America Journal, 2014, 78(4), 1168- http://dx.doi.org/10.2136/sssaj2014.01.0009
Table 4: variability of the a) atmospheric variables: air temperature (Air T), air humidity (Air H) and cumulated rain, b) rain event characteristics, and c) soil variables: soil temperature (Soil T) and soil water content (Soil WC) for the whole monitoring duration. a)
Air T Air H Cumulated rain
Max Min Mean SD Mean SD mm
°C --- % ---
36.1 1.6 16.1 5.3 76.8 20.5 219
b)
Rain event Date
Duration Rain amount Maximum intensity h mm mm h-1 R1 2/5 5 4.0 2.0 R2 7/5 3 13.2 7.0 R3 4/6 7 26.2 16.8 R4 14/6 1 9.8 9.8 R5 4/8 8 13.5 4.0 R6 14/8 5 7.4 4.8 c) Soil T Soil WC
Max Min Mean CV Max Min Mean CV
--- °C --- % --- % ---surface 31.2 4.8 19.1 32 22.5 6.1 11.7 28 subsurface 30.4 9.7 18.9 19 22.8 17.9 19.6 4 510 511 512 513 514 515 516 517 518
Version postprint
Version définitive du manuscrit publié dans / Final version of the manuscript published in:
Soil Science Society of America Journal, 2014, 78(4), 1168- http://dx.doi.org/10.2136/sssaj2014.01.0009
Table 5: correlations (Pearson’s coefficient) between aggregate stability and organic matter content, microbial biomass and water repellency.
Surface Subsurface
OM BIOMI WR OM BIOMI
MWDFW 0.33 (ns) 0.25 (ns) 0.12 (ns) 0.34 (ns) -0.07 (ns)
MWDSW 0.14 (ns) 0.32 (ns) 0.24 (ns) -0.29 (ns) -0.06 (ns)
dataset: n=19; df=17; α=5%; r=0.46 ns=Not significant at the 5% level OM = organic matter content BIOMI = microbial biomass WR=water repellency 519 520 521 522 523 524 525 526
Version postprint
Version définitive du manuscrit publié dans / Final version of the manuscript published in:
Soil Science Society of America Journal, 2014, 78(4), 1168- http://dx.doi.org/10.2136/sssaj2014.01.0009
Table 6: Correlations (Pearson’s coefficient) between MWD and soil water indices
Surface Subsurface
WC0 WC1/2 ΔWC4 API WC0 WC1/2 ΔWC4 API
MWDFW -0.73* -0.76* -0.54* -0.63* 0.14(ns) 0.13(ns) 0.25(ns) -0.18(ns)
MWDSW -0.69* -0.72* -0.70* -0.65* -0.57* -0.37(ns) -0.04(ns) -0.25(ns)
dataset: n=19; df=17; α=5%; r=0.46 * significant at the 5% level
ns = not significant at the 5% level
WC0: soil water content at the time of sampling
WC1/2: mean soil water content for half a day prior to sampling
ΔWC4: difference between water content at the time of sampling at water content 4 days
prior to sampling
API: antecedent precipitation index 527 528 529 530 531 532 533 534 535 536
Version postprint
Version définitive du manuscrit publié dans / Final version of the manuscript published in:
Soil Science Society of America Journal, 2014, 78(4), 1168- http://dx.doi.org/10.2136/sssaj2014.01.0009
Table 7: Simple regressions for MWD variations
WC0 WC1/2 API ΔWC4
Dataset s
Df R² level R² level R² level R² level
Surface FW 17 0.51 ** 0.54 ** 0.37 * 0.25 .
SW 17 0.44 * 0.50 ** 0.39 * 0.47 **
Subsurface FW 17 0 ns 0 ns 0 ns 0.01 ns
SW 17 0.23 . 0.29 . 0.07 ns 0 ns
Df= degrees of freedom; R²= adjusted coefficient of determination FW: Fast wetting test. SW: Slow wetting test.
** Model significant at the 1 % level * Model significant at the 5% level . Model significant at the 10 % level ns Model not significant at the 10 % level
WC0: soil water content at the time of sampling
WC1/2: average soil water content half a day prior to sampling
ΔWC4 : difference between soil water content at the time of sampling and soil water
content four days before
API: antecedent precipitation index 537 538 539 540 541 542 543 544 545 546 547 548 549 550
Version postprint
Version définitive du manuscrit publié dans / Final version of the manuscript published in:
Soil Science Society of America Journal, 2014, 78(4), 1168- http://dx.doi.org/10.2136/sssaj2014.01.0009
Figure 1: Temporal variation of aggregate stability for the slow wetting test of surface and
subsurface at montly time step (a) and short time step (b). 552
Version postprint
Version définitive du manuscrit publié dans / Final version of the manuscript published in:
Soil Science Society of America Journal, 2014, 78(4), 1168- http://dx.doi.org/10.2136/sssaj2014.01.0009
MWDSW monthly time step: each MWDSW point corresponds on the mean of three samples
located on the same plot (spatial variability) and 3 replicates for each measurements (n=9). Bars are standard errors.
MWD short time step: each MWD corresponds on the mean of three replicates (n=3). Bars are standard error.s
Stable, Medium, Unstable, Very unstable, refers to the aggregate stability classes (Le Bissonnais, 1996) 554 555 556 557 558 559 560
Version postprint
Version définitive du manuscrit publié dans / Final version of the manuscript published in:
Soil Science Society of America Journal, 2014, 78(4), 1168- http://dx.doi.org/10.2136/sssaj2014.01.0009
Figure 2: Temporal variation of aggregate stability for the slow wetting test at short time
step for (a) May , (b) June and (c) August.
MWD monthly time step: each MWD corresponds on the mean of three samples located on the same plot (spatial variability) and 3 replicates for each measurements (n=9). Bars are standard errors.
MWD short time step: each MWD corresponds on the mean of three replicates (n=3). Bars are standard errors.
R1, R2, R3, R4, R5, and R6 refer to the number of the rain event. 562 563 564 565 566 567 568 569 570
Version postprint
Version définitive du manuscrit publié dans / Final version of the manuscript published in:
Soil Science Society of America Journal, 2014, 78(4), 1168- http://dx.doi.org/10.2136/sssaj2014.01.0009
Figure 3: Temporal variation in (a) organic matter content, (b) microbial biomass and (c)
water repellency.
a and b: each point is the mean of three replicates; bars are standard errors. c: each point is the mean of 10 replicates; bars are standard errors.
572 573 574 575
Version postprint
Version définitive du manuscrit publié dans / Final version of the manuscript published in:
Soil Science Society of America Journal, 2014, 78(4), 1168- http://dx.doi.org/10.2136/sssaj2014.01.0009
Figure 4: Temporal dynamics of the soil variables; a) Surface soil temperature, b)
subsurface soil temperature, c) Volumic soil water content for surface and subsurface. Curves are to the mean of two replicates
576
577
578 579 580