HAL Id: hal-00907762
https://hal.univ-cotedazur.fr/hal-00907762
Submitted on 18 Dec 2013
HAL is a multi-disciplinary open access
archive for the deposit and dissemination of
sci-entific research documents, whether they are
pub-lished or not. The documents may come from
teaching and research institutions in France or
abroad, or from public or private research centers.
L’archive ouverte pluridisciplinaire HAL, est
destinée au dépôt et à la diffusion de documents
scientifiques de niveau recherche, publiés ou non,
émanant des établissements d’enseignement et de
recherche français ou étrangers, des laboratoires
publics ou privés.
Optimal within-patch movement strategies for
optimising patch residence time: an agent-based
modelling approach
Eric Wajnberg, Thomas Hoffmeister, Patrick Coquillard
To cite this version:
Eric Wajnberg, Thomas Hoffmeister, Patrick Coquillard. Optimal within-patch movement strategies
for optimising patch residence time: an agent-based modelling approach. Behavioural ecology and
sociobiology, 2013, 67 (12), pp.2053-2063. �10.1007/s00265-013-1615-5�. �hal-00907762�
1
Behavioral Ecology and Sociobiology (2013) 67, 2053-2063
Optimal within-patch movement strategies
for optimising patch residence time: an
agent-based modelling approach
E. Wajnberg
1*, T.S. Hoffmeister
2& P. Coquillard
1*: Corresponding author: INRA, 400 Route des Chappes, BP 167, 06903 Sophia Antipolis Cedex, France (e-mail: [email protected], Tel: (33)492386447,
Fax: (33)492386557).
1: INRA, CNRS, Université de Nice, 400 Route des Chappes, BP 167, 06903
Sophia Antipolis Cedex, France ([email protected] and [email protected]).
2: Institute of Ecology, FB 2, Biology, University of Bremen, Leobener Str./NW2, 28359 Bremen, Germany ([email protected]).
Key words: patch residence time, movement strategy, optimality model, Marginal Value Theorem, simulation, genetic algorithm
Running title: optimal within-patch movement strategies
Abstract
Several optimisation models, like the Marginal Value Theorem (MVT), have been proposed to predict the optimal time foraging animals should remain on patches of resources. These models do not clearly indicate, however, how animals can follow the corresponding predictions. Hence, several proximate patch-leaving decision rules have been proposed. Most if not all of these are based on the animals’ motivation to remain on the patches, but the real behaviours involved in such motivation actually still remain to be identified. Since animals are usually exploiting patches of resources by walking, we developed a model simulating the intra-patch movement decisions of time-limited animals exploiting resources distributed in delimited patches in environments with different resource abundances and distributions. The values of the model parameters were optimised in the different environments by means of a genetic algorithm. Results indicate that simple modifications of the walking pattern of the foraging animals when resources are discovered can lead to patch residence times that appear consistent with the predictions of the MVT. These results provide a more concrete understanding of the optimal patch-leaving decision rules animals should adopt in different environments.
Key words: patch residence time, movement strategy, optimality model, Marginal Value Theorem, simulation, genetic algorithm
Introduction
Most animals are foraging for resources (food, hosts, prey, etc.) that are distributed in discrete patches in the environment (Green 2006; Wajnberg 2006). Under such conditions, they have to optimise the length of time spent on each patch to maximise the number of resource items harvested per time unit (Stephens and Krebs 1986; Wajnberg 2006). One of the most influential theoretical treatments of this problem, that has inspired a large body of research, is the Marginal Value Theorem (MVT; Charnov 1976). It predicts that foraging animals can maximise the rate at which they find resources by leaving each patch when the instantaneous resource intake rate falls below the average rate of gain for the habitat. However, although most species are following rather accurately the predictions of the MVT (Nonacs 2001), animals cannot be expected to calculate optimal behavioural decisions in the way suggested by optimisation models like the MVT (Houston 1987). Waage (1979), working on the parasitic wasp Nemeritis
2
canescens, thus proposed a dynamic patch-leaving rule suggesting that the animal
enters a patch with a certain responsiveness level (tendency to remain). The responsiveness, which is said to correspond to a tendency to turn sharply back to the centre when the edge of the patch is reached, would then decrease with time due to habituation until a threshold value would be reached at which time the turning response would no longer be elicited and the patch would be left. When a resource item is found, the responsiveness would increased by a given increment delaying the time of departure. More recent experimental results indicated that encountering a resource item could also have a decremental influence on the animal’s tendency to remain on the patch (Driessen et al. 1995; Pierre et al. 2012). Iwasa et al. (1981) demonstrated theoretically that an incremental effect of finding a resource item produces optimal patch residence times (e.g., according to the MVT) when there is a large variance in patch quality (i.e., a clumped distribution of resources), while a decremental effect is optimal when resources are regularly distributed among patches. Finding resources that are distributed in patches according to a Poisson distribution should not influence the motivation of the animal to remain on the patch.
Although this is graphically suggested in the original paper of Charnov (1976) and sometimes mentioned in other studies (e.g., Nelson and Roitberg 1995; van Alphen et al. 2003; Hancock and Milner-Guilland 2006), neither models of optimal patch time allocation nor proximate patch-leaving decision rules explicitly consider intra-patch animal movement while foraging for resources. However, animal movement strategy while foraging for resources has often been recognised as crucial (Turchin 1998; de Knegt et al. 2007) and has thus been a central focus in foraging ecology (Bell 1991; Stephens and Krebs 1986).
Most theoretical approaches developed for this problem are based on spatially explicit simulation models and have focused mainly on inter-patch movements (so-called “ranging”) (e.g., Stillman and Sutherland 1990; Zolner and Lima 1999; Nonaka and Holme 2007; Bartoń et al. 2009; Reynolds 2012). For intra-patch displacement patterns (so-called “local search” or “restricted search”), numerous studies have identified and described a simple and efficient resource-harvesting strategy based on a decrease in walking speed with an increase in changes of direction (Bell 1990; Benhamou 1992; Focardi et al. 1996; Turchin 1998; Bartumeus et al. 2005). Between patches, faster and straighter movements become more efficient, increasing net displacement, thereby increasing the chance of finding new resources (McYntyre and Wiens 1999; Bartumeus et al. 2005; Bartoń and Hovestadt 2013).
Although to our knowledge no such studies have been published, it could be that the optimal proximate patch-leaving decision rules can actually be
expressed in terms of animal movement strategy within patches of resources. As explained above, patch-leaving mechanisms are usually phrased in terms of responsiveness level or motivation to remain on the patch. Motivation, considered to be not directly observable, influences an animal’s response, in terms of direction, intensity, and persistence of effort, to perceived environmental stimuli (so-called “incentives”) (Colgan 1989; Bell 1991). The motivation could correspond phenotypically, at least partially, to an animal’s intra-patch movement decisions.
Optimal patch residence time and animal movement have arguably been two of the most-studied problems in behavioural ecology over the past few decades (Wajnberg 2006; Holyoak et al. 2008). However, up to now, the two topics have largely been developed independently. This is unfortunate, since both problems are essential ingredients to be studied simultaneously if we want to understand accurately what sort of optimal decision-making processes animals actually use (Hancock and Milner-Guilland 2006). In order to address this problem, we developed an individual-based, Monte Carlo model with detailed exploration rules of delimited patches simulating the resource-harvesting process of isolated animals with a high degree of flexibility. Optimal locomotory movement strategies, corresponding to optimal patch residence times, were identified by means of a genetic algorithm (Sumida et al. 1990; Ruxton and Beauchamp 2008). Subsequently, a sensitivity analysis was performed in order to identify what are the decision-making movement rules that are the most efficient to approach the optimal predictions of the MVT. The results obtained provide a clearer and concrete understanding of the phenotypic meaning of patch-leaving mechanisms animals should adopt to behave optimally.
Description of the model
To identify optimal intra-patch movement decisions, we developed a spatially explicit foraging model. The model simulates, in a 2D-space and over one generation, the locomotory behaviour of isolated, time-limited animals foraging for fixed pinpoint resource items distributed in delimited patches. This simplified scenario corresponds, for example, to an egg parasitoid female foraging for host egg masses, or to an herbivorous animal looking for fallen fruits or seeds at the bottom of distant trees, or, more generally, to any kind of animals exploiting by walking resources distributed in delimited depletable patches in their environment. The model is discrete in time and integrates both stochastic and deterministic components. In it, animals are foraging in an environment that can
3
be of three different resource abundances corresponding to three average numbers of resource items per patch: 5, 10 or 15. For each resource abundance, three different distributions of resource items per patch were compared. In environments in which resources are uniformly distributed among patches, all patches initially contain the same number of resource items. In environments having resources distributed randomly among patches, the initial number of resource items in each patch is given by a Poisson distribution. In environments in which resources are showing an aggregated distribution among patches, the initial number of resource items in each patch is given by a Negative Binomial distribution with an aggregation parameter k equal to 1.0. In all cases, resource item locations were drawn randomly on circular patches of 120 arbitrary units in diameter each, constraining them from being too close to the patch border (at least 5 arbitrary units) or too close to each other (minimal inter-resource distance of 10 arbitrary units). Patches were identical in surface area in order to standardize perimeter-to-area ratio and maintain a constant overall chance for the animals to reach the patch edge (Turchin 1986).
Following other studies (e.g., Bovet and Benhamou 1988; Benhamou 1992; Bruins et al. 1994; Wajnberg and Colazza 1998; Benhamou 2007; etc.), the walking behaviour of the foraging animals in each patch of resources was simulated with a simple correlated random walk (see Codling et al. 2008 for a recent review). This enables us to simply and accurately analyse the different components of the behavioural decision processes separately.
In the simulations, patches had not been previously exploited by the animals. At the beginning of each visit to a patch, animals are released in the centre, and a linear walking speed and a turning angle are then drawn randomly at each time step to compute their new coordinates. A preliminary test was done by allowing animals to enter patches from a randomly-chosen point on the patch border instead. Results were qualitatively similar. The linear walking speed (expressed in arbitrary length units per time step) was drawn from a Normal distribution whose average changed in the course of time according to the following logistic curve:
t
e
AWS
− ×+
=
G19
1
10
(eq. 1)where AWS is the average walking speed, t is the time elapsed since the animal entered the patch and G1 (> 0) determines the speed of increase in average walking displacement with time (from 1.0 to 10.0 arbitrary units). The standard
deviation used for the Normal distribution was set to 5 arbitrary units per time step and the randomly drawn linear speeds were bounded to remain ≥ 1.0. The logistic function was used because its shape corresponds to what has been sometimes observed in real animals (e.g., Carter and Dixon 1982; Bell 1991). A Normal distribution was also used to draw the turning angles at each time step, with average values equal to the direction of movement at the preceding step and with a standard deviation that followed a decreasing logistic curve coupled to the one given in eq. 1 and that was bounded to remain between 45° and 0°. Hence, as time goes by, and without finding resources, the animal progressively switched from a slow and tortuous to a fast and straighter walking pattern.
As observed, for example, in several insect species (Waage 1978, 1979; Strand and Vinson 1982; Gardner and van Lenteren 1986; Bell 1991), the animal can bounce back to the centre of the patch upon encountering the patch border. Such a behaviour can be the result of a visual, gustatory or olfactory ability of the animal to detect the patch edge. The probability p of the simulated animals to bounce back decreased exponentially with the number of times the border of the patch was encountered according to the following equation:
R
e
p
=
−G2× (eq. 2) where R is the number of times the patch border has been encountered since the animal entered the patch and G2 (>0) is the rate of decrease of the probability to return to the patch centre. Such a decrease has been sometimes considered to result from a habituation process (Waage 1978, 1979; Strand and Vinson 1982).Upon walking on a patch, animals arriving at a new location at each time step are able to detect and exploit resource items within their perceptual detection range (so-called “reactive distance”, Roitberg 1985; Bruins et al. 1994) here set to a distance of 10 arbitrary units. When several resource items are perceived at a given time step, the closest one is the one that is exploited. The model thus explicitly considers that resource items situated between two locations during the walking process (i.e., between two time steps) are not perceived and are thus not exploited by the foraging animal. Each time a resource item is encountered, it is not replaced, so patches are suffering a continuous depletion. For insect parasitoids, this might represent a simplification since hosts attacked by these insects remain in the environment. In this particular case, the model would thus correspond to simulating the foraging behaviour of a parasitoid female able to perfectly discriminate between healthy and already attacked hosts. When a resource item is discovered, the logistic curve defining average changes in the
4
walking pattern in the course of time (eq. 1) is altered such that the time variable t is replaced by
t
+
G3
×
r
, where r is the total number of resource items encountered since the animal entered the patch and G3 (a real number) is the intensity of the switching effect. Hence, if G3 is negative, the animals encountering a resource item returns, on average, to a slower and more tortuous walking behaviour. Such a switching mechanism has been observed in parasitic wasps after a host is discovered (e.g., Gardner and van Lenteren 1986). A positive value of G3 accelerates the animal’s average walking speed and straightness. Encountering a resource item also alters the probability that the animal bounces back when the patch border is encountered (eq. 2). This means that R in eq. 2 is replaced byR
+
G4
×
r
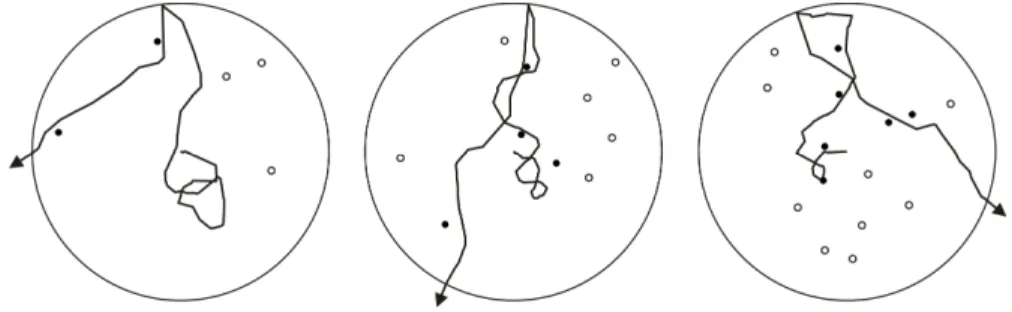
, where R is the total number of times the patch border has been encountered, r is the number of resource items encountered since the animal entered the patch, and G4 (real number) is the intensity of the switching effect. Whatever the value of G4, the probability to bounce back was bounded to remain ≤ 1.0. Here again, if G4 is negative, the animal encountering a resource item increases back its bouncing probability upon encountering the patch border while a positive value accelerates its probability of leaving the patch. Negative values of both parameters G3 and G4 result in a longer stay in the patch each time a resource item is discovered. This corresponds to the incremental mechanism in Waage’s (1979) patch-leaving rule. Reciprocally, positive values for these two parameters are corresponding to a decremental influence of encountering a resource item on the patch residence time. Zero values for these two parameters correspond to no influence of resources encountered on the patch residence time of the simulated animals.Table 1 lists all parameters of the simulation model, with their meaning and/or the values used, and Fig. 1 shows a couple of examples of the walking pattern produced by this model. Such movement patterns resemble those observed in real animals (Waage 1978; Galis and van Alphen 1981; Strand and Vinson 1982; Gardner and van Lenteren 1986).
It has to be noted that there are some possible correlations between the four state parameters G1 to G4. The goal of the model was to provide a simple mathematical characterisation of the different behavioural movement routines animals should use to adjust their patch residence time and, although being potentially correlated, the four parameters G1 to G4 are actually describing different features of movement strategy of the modelled animals.
After leaving a patch of resources, the animal always had to travel 200 time steps before finding a new patch that is then exploited using the same foraging algorithm described above, and the whole process is repeated until a total
number of 5,000 time steps has elapsed, which corresponds to the total lifetime of the foraging animal. Using optimised values for the parameters G1 to G4 (see below), such a procedure led to an average of about 16.7 patch visits (range: 12-20; pooling all situations studied) during a forager’s lifetime duration. Different inter-patch travel times or total lifetime durations gave qualitatively similar results, demonstrating that the particular parameters used were not influential. At the end of each simulation, the foraging success of the simulated animals was quantified by the total number of resource items harvested per time unit. In the case of insect parasitoids looking for and exploiting hosts, such a foraging success is directly translated into rate of offspring production and thus into individual fitness (Wajnberg 2006).
In order to remain simple, tractable and sufficiently general, the simulation model developed makes six main simplifications compared to real animals. First, the simulated animals are not capable of detecting the quality of the patch upon entering it, although real animal have been shown to be able to do so. This is the case, for example, for some parasitic wasps that are known to perceive the amount of contact kairomones produced by their hosts (Waage 1978; 1979; Wajnberg 2006). Second, foraging animals are moving within, and travelling between patches of resources without paying an energetic or physiological cost, although the importance of such a cost has been demonstrated several times (e.g., Liu et al. 2009). Third, both the walking strategy and resource-harvesting ability of the simulated animals remain the same all over their entire lifetime duration, although the corresponding behaviours could change with the age of the animals (Gossard and Jones 1977; Bell 1990). Fourth, resources discovered are exploited instantaneously, although a substantial handling time is usually necessary, leading likely to possible quantitative changes in the optimal time animals should allocate to each patch they visit. Fifth, there is no competition between foraging animals, although competition between foragers is known to influence their patch time allocation (Wajnberg et al. 2004; Fraser et al. 2006). Finally, the simulated animals are not able to learn progressively the quality of their habitat, although an important number of studies demonstrated that learning, both during a visit to a patch (e.g., Outreman et al. 2005) or while travelling between patches (e.g., Dall and Cuthill 1997; Thiel and Hoffmeister 2004; Tentelier et al. 2006), can enable animals to acquire rapidly a more accurate estimation of the quality of their environment (McNamara and Houston 1985; Eliassen et al. 2009).
5
Optimisation and sensitivity analysis
In many studies, the walking pattern of foraging animals is simulated with different values of the state parameters, and optimised strategies are identified empirically using graphical outputs of the results (e.g., Stillman and Sutherland 1990; Benhamou 1992; Nonaka and Holme 2007; Bartoń and Hovestadt 2013). Here, values of the parameters G1 to G4 that maximise the foraging success of the simulated animals in each environmental situation were identified by means of a genetic algorithm. Such a numerical optimisation method has been used to solve several ecological questions (Sumida et al. 1990; Hoffmeister and Wajnberg 2008; Ruxton and Beauchamp 2008; Wajnberg et al. 2012), including on optimal movement strategies (e.g., Hancock and Milner-Guilland 2006). Several genetic algorithms are available. We used the GENITOR algorithm which is known to be efficient when optimising stochastic processes (Whitley 1989). One hundred chromosomes were used, each coding for four genes corresponding to the four parameters G1 to G4. In the optimisation process, each chromosome was randomly modified using a mutation rate of 2.5% per gene and a recombination rate of 60%. At each generation, chromosomes leading to lower foraging successes are eliminated and replaced by the offspring of those leading to the higher number of resource items discovered per time unit, and the process was repeated over 350 generations leading to a stable evolutionary solution in each of the environmental situations compared. Since the algorithm used to simulate the walking strategy of the foraging animal is stochastic, the fitness of each chromosome was estimated each time by the average foraging success of 500 runs of the same gene combination using different randomly drawn patch composition and resource item locations. The entire optimisation process was repeated 100 independent times in each environmental situation compared. Finally, the effect of the average resource abundance and of the distribution of the resource items per patch on the optimised values of the four parameters G1 to G4 was analysed with 2-way ANOVA, and a Tukey test was used to identify significant differences between means.
Once they have been obtained, the average optimised values for the four parameters were used to simulate the foraging behaviour of animals in order to check whether their patch residence times were consistent with the optimal predictions of the MVT. For this, simulations were first run 100 times separately for each average resource abundance, each distribution of resource items per patch, and each of the possible patch qualities with the optimised parameters and up to the moment all resource items have been harvested. Results in each case were used to fit a function describing the cumulative number of resource items
harvested in the course of time (fitness function), estimating, by maximisation of a Poisson likelihood, the parameters N0 and β of the following equation:
( )
(
t)
e
N
t
f
=
01
−
−β× . (eq. 3) As an inter-patch travel time of 200 time steps was used in all cases, these parameters were used to compute numerically the optimal patch residence times given by the MVT in each situation. All computations were done using R 2.14.1 software (R Development Core Team 2011). Then, simulations with the optimised values of the parameters G1 to G4 were run 1,000 times in each situation, and the average patch residence times were compared to the expected times from the MVT using the following least-square criterion, expressed in time unit:(
)
∑
=−
q i i i it
t
p
1 2 * (eq. 4)where q is the number of patch types of different quality that are available in the environment, pi is the probability of finding a patch of type i, and ti and
*
i
t
are respectively the observed and expected foraging times of animals exploiting a patch of type i. The lower this criterion, the closer the animals are following the predictions of the MVT.Finally, this criterion was used to perform a sensitivity analysis on each of the four parameters G1 to G4 to estimate their importance for the foraging animals to behave in accordance with the MVT. For this, each parameter was modified separately in each of the environmental situations compared, keeping the others at their optimised values, within an interval extending 6×SE (SE by SE) symmetrically around the optimised value, SE being the standard error of the optimised parameter observed after running the optimisation process. As explained above, checking whether the optimised behaviour is consistent with the MVT was done using the simulated and expected foraging times on patches of resources. Similar results were obtained using marginal fitness gains upon leaving the patches instead.
6
Results
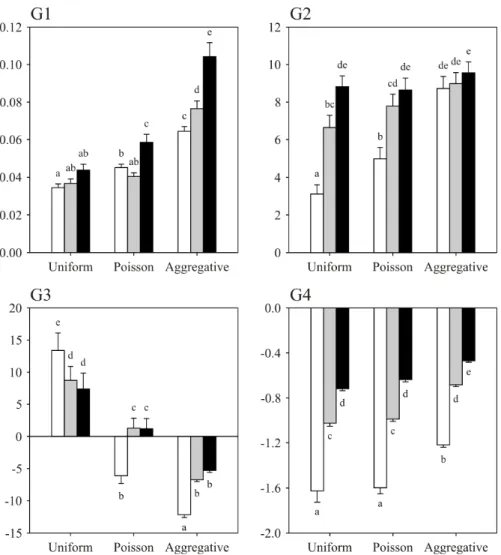
Fig. 2 gives the optimised values of the four parameters G1 to G4 in each environmental situation compared. In environments of increasing resource abundance and with an increasing aggregation level of resource items per patch, animals should increase both the speed at which they switch from a slow and tortuous to a fast and straighter walking pattern (parameter G1: effect of environment richness, F2, 895 = 26.82, p < 0.001; effect of the distribution of
resources per patch, F2, 895 = 110.39, p < 0.001) and the rate of increase in the
patch-leaving probability upon encountering the patch border (parameter G2: effect of environment richness, F2, 895 = 24.32, p < 0.001; effect of the distribution
of resources per patch, F2, 895 = 17.83, p < 0.001).
Upon encountering a resource item, and whatever the richness of their environment, foraging animals should return back to a slower and tortuous walking behaviour, and should thus increase their patch residence time, when resources have an aggregated distribution. On the opposite, they should accelerate their walking speed and straightness, and thus decrease their patch residence time, when resources have a regular distribution (parameter G3: effect of environment richness, F2, 895 = 2.64, NS; effect of the distribution of resources per patch, F2, 895
= 86.59, p < 0.001). When the distribution of the resource items per patch is random, no straightforward effect is found. Finally, each resource item encountered should lead the foraging animals to increase their probability to bounce back on the patch border, and this effect is stronger in a poorer environment and when the resources are more regularly distributed (parameter G4: effect of environment richness, F2, 895 = 333.37, p < 0.001; effect of the distribution
of resources per patch, F2, 895 = 54.50, p < 0.001).
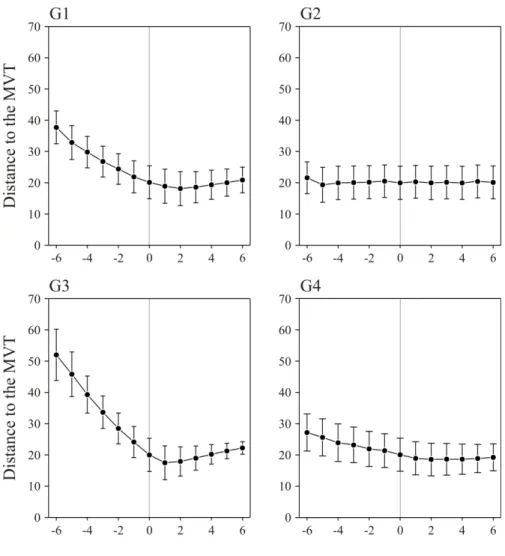
Fig. 3 presents the results of the sensitivity analysis done on each of the four parameters G1 to G4. It is interesting to note that, although not behaving exactly in accordance to the predictions of the MVT, optimised animals are adopting patch residence times that are differing from those predicted by the MVT by a couple of time steps only. The remaining differences are most likely due to the high level of stochasticity of the foraging algorithm developed while the MVT is entirely deterministic. As can be seen in Fig. 3, the four parameters have apparently not the same importance in leading foraging animals to adopt a behaviour that is consistent with the MVT. The two parameters involved in shaping the walking pattern of the simulated animals (G1 and G3) seem to be more important than those involved in determining the patch-leaving probability upon encountering the patch border (G2 and G4). Actually, parameter G3, which determines the incremental/decremental effect of each resource item encountered
on the walking behaviour, in terms of patch residence time, appears to play the most important role. More accurately, decreasing its value (i.e., having a higher incremental effect in terms of patch residence time) is leading the foraging animals to deviate rapidly from the predictions of the MVT.
Discussion
Although much remains to be done, the need for studies integrating optimal behaviours and the proximate mechanisms enabling foraging animals to adopt them is regularly advocated by many authors (McNamara and Houston 2009). Concerning patch time allocation, optimality models like the MVT (Charnov 1976) indicate how long foraging animals should remain on each patch they exploit, but they do not clearly indicate how they can manage to do it (Green 1984). The proximate patch-leaving decision rules that have been studied so far are essentially expressed in terms of animal responsiveness or motivation (Wajnberg 2006; Pierre et al. 2012), but no clear indication has been proposed regarding the actual behaviours involved. Since patch of resources are usually exploited by walking, we tried to identify the optimal patch-leaving decision rules in terms of animal movement patterns. Animal movement is certainly an important ecological component of animal behaviour that is involved in animal foraging decisions (Cronin et al. 2001; Chapman et al. 2007; Nathan et al. 2008). By developing a simple model simulating the walking decisions of isolated, time-limited animals exploiting detime-limited patches of resources, coupled with a genetic algorithm to quantify the optimal displacement patterns, we identified optimised movement strategies enabling animals to maximise the number of resource items harvested per foraging time unit.
Four state parameters were optimised in different environmental situations. G1 and G3 described the change, from the moment a patch of resources is entered, of the walking pattern from a slow and tortuous to a faster and straighter movement while G2 and G4 are involved in modifying the probability of the foraging animals to bounce back when the patch border is encountered. Concerning the first two of these parameters, the results obtained indicate that animals should switch more rapidly to a faster and straighter walking pattern when they have to exploit resources that are more aggregated in patches (parameter G1). In turn, this should lead them to encounter the patch border more frequently but, under such an environmental situation, each resource item encountered should optimally reduce back their walking speed with an increase in their turning rate (parameter G3). In aggregated environments, the two mechanisms may thus
7
potentially cancel out each other. In these environments, resources are mainly concentrated in a few patches only while an important number of patches contain few resource items. Thus, such an optimised combination of mechanisms most likely enables the animals to avoid spending too much time on poor-quality patches and to concentrate their foraging effort on patches in which a higher number of resource items will be discovered. Approaching more rapidly a faster and straighter walking displacement also likely avoids animals remaining too long on better-quality patches. When resource items are more regularly distributed among patches, animals should instead increase the speed at which they switch from a slow and tortuous to a faster and straighter walking pattern each time a resource item is harvested (parameter G3). Thus, in this case, the two parameters G1 and G3 are both leading animals to leave patches earlier. Since parameter G1 acts globally while parameter G3 acts multiplicatively in proportion to the number of resources exploited, the two effects should be cancelled out only when a significant number of resource items can be discovered, which is often not the case in regularly distributed environments and especially when animals are foraging in environment of decreasing richness.
Concerning the two other parameters determining the bouncing probability on the patch border, results indicate that animals should leave patches earlier (parameter G2) when resources are more aggregated in patches, especially when the overall quality of the environment increased. The explanation is most likely the same than for the parameters G1 and G3. Indeed, such an optimised strategy would enable animals to avoid remaining too long on poor-quality patches. Here again, the effect of the two parameters G2 and G4 should cancel out each other since G2 acts in a constant manner through time while G4 modulates the effect of cumulative success in the patch. Actually, all of these results have to be interpreted by taking into account the effect of all four parameters simultaneously. For example, if resources are uniformly distributed among patches, parameter G3 leads animals to adopt a faster and straighter walking pattern each time a resource item is encountered, reducing the time to reach the patch border. In this case, in order to avoid leaving too early, animals should increase their bouncing probability on the patch border, and this corresponds to the optimised negative value of parameter G4. Similar compensatory mechanisms between parameters can be found in other environmental situations.
It has to be noted that the optimised values of parameter G3 (the one that the sensitivity analysis performed revealed to be the most important for the animals to adopt a behaviour that is consistent with the MVT) are in agreement with the theoretical results of Iwasa et al. (1981). The idea is that each time an animal encounters a new resource item in an aggregated environment, it collects
an information indicating that it is most likely foraging in a good-quality patch, thus leading it to remain longer. This corresponds to the optimised incremental effect parameter G3 has on patch residence time in this case. On the other hand, when resources are uniformly distributed, each encounter with one of them informs the animal that there is one resource item less remaining to be discovered, thereby leading it to reduce its time to remain on the patch. This corresponds to the optimised decremental effect parameter G3 has on patch residence time in such a situation. Finally, when resource items are randomly distributed among patches, no clear effect should be observed, and this also corresponds to the results obtained.
All studies done to understand the behaviours involved in determining patch residence time of foraging animals described the decision to turn sharply inward upon encountering the patch edge as the key mechanism (e.g., Waage 1978, 1979; Bell 1990, 1991; Driessen et al. 1995; van Alphen et al. 2003; Wajnberg 2006; Chapman et al. 2007). According to the hypothesis that patch leaving involves habituation to patch border, the intensity of such a behavioural decision then decreases with time, leading the animal to leave. Results presented here, and especially those of the sensitivity analysis, indicated that it is apparently not so much the decision to bounce back on the patch border that matters but rather modifications of the intra-patch locomotory decision each time resource items are discovered that are playing the most important role. In the original paper, Charnov (1976) presented a graphical sketch to explain the optimal patch time allocation problem (see Fig. 1 in Charnov 1976). In it, an hypothetical walking path of a foraging animal visiting several patches in the environment is presented. It is interesting to note that such a schematic description did not consider the possibility of the animal to bounce back on the patch border, intuitively supporting the results presented here. Actually, using intra-patch walking decisions to determine the time to remain on a patch of resources appears to be likely a more efficient strategy than turning sharply when the patch border is encountered. Indeed, adjusting the walking pattern on a patch is certainly leading to a continuous and accurate decision-making process while using encounters with the patch border provides discrete, inaccurate and even sometimes rare information only. For example, the information collected by a foraging animal during its displacement on a patch provides an immediate update in its estimation of the patch current level of depletion while border-encountering events are appearing later in time and are thus providing an information regarding its current position only, which is thus both less relevant and less accurate.
The MVT assumes that foraging animals have a perfect knowledge of the average resource finding rate in their environment (Stephens and Krebs 1986), or,
8
instead, that they are sampling their environment and are progressively learning the average quality of the patches available and the average distance to reach them (McNamara and Houston 1987). Although not taking into account such drastic assumptions, our simple modelling approach leads the simulated animals to adopt a behaviour that appears rather consistent with the predictions of the MVT. For this, foraging animals should simply (i) increase progressively their walking speed and decrease their turning rate from the moment they enter a patch of resources, and (ii) be able to modify their perception of time elapsing in this process when resource items are encountered.
An important number of both experimental and theoretical studies have proposed several different patch-leaving decision rules foraging animals should adopt to optimise their patch residence time. Such proximate decision-making processes are based on animals’ motivation that has been called “foraging motivation” (e.g., Lefebvre et al. 2007), “responsiveness” (e.g., to the patch edge) (e.g., Waage 1978, 1979; van Alphen et al. 2003; Wajnberg 2006), “tendency” (to stay or to leave) (e.g., Pierre et al. 2012; Wajnberg 2012) or even “estimated number of remaining resource items” (e.g., Iwasa et al. 1981). The concept of motivation can perhaps best be replaced, or complemented by demonstrated mechanistic behaviours involved in finding and exploiting resources, thus reducing the need for intervening motivational state variables (Bell 1991). Our results suggest that modifications of intra-patch locomotory walking patterns may provide suitable behavioural mechanisms for determining the optimal time foraging animals are remaining on patches of resources.
As this was already mentioned above, the simulation model developed in this work makes several simplifications compared to real animals (e.g., simulated animals are moving without paying an energetic or physiological cost, and are not competing between each other to exploit the resources available, etc.). Thus, additional developments of the model are now being performed to relax these different simplifications, enabling thus to simulate the behaviour of real animals more accurately. The optimised behaviours that will be obtained are expected to enable foraging animals to adopt a patch exploitation strategy that will most likely be even closer to the predictions of optimisation models like the MVT.
Acknowledgements
S. Benhamou, V. Calcagno, P. Crowley, E. Desouhant and J.S. Pierre are thanked for their comments on an early version of the manuscript. The code of the simulation model was developed thanks to the GAlib, a C++ library that provided
tools for implementing genetic algorithms (http://lancet.mit.edu/ga/), and was run
on the cluster of the INRA MIGALE bioinformatics platform
9
References cited
van Alphen JJM, Bernstein C, Driessen G (2003) Information acquisition and time allocation in insect parasitoids. Trends Ecol Evol 18:81-87
Bartoń KA, Hovestadt T (2013) Prey density, value, and spatial distribution affect the efficiency of area-restricted search. J Theor Biol 316:61-69
Bartoń KA, Phillips BL, Morales JM, Travis JMJ (2009) The evolution of an ‘intelligent’ dispersal strategy: biased, correlated random walks in patchy landscapes. Oikos 118:309-319
Bartumeus F, da Luz MGE, Viswanathan GM, Catalan J (2005) Animal search strategies: a quantitative random-walk analysis. Ecology 86:3078-3087 Bell WJ (1990) Searching behavior patterns in insects. Ann Rev Entomol
35:447-467
Bell WJ (1991) Searching behaviour. The behavioural ecology of finding resources. Chapman and Hall, London
Benhamou S (1992) Efficiency of area-concentrated searching behaviour in a continuous patchy environment. J Theor Biol 159:67-81
Benhamou S (2007) How many animals really do the lévy walk? Ecology, 88:1962-1969
Bovet P, Benhamou S (1988) Spatial analysis of animal’s movement using a correlated random walk model. J Theor Biol 131:419-433
Bruins EBAW, Wajnberg E, Pak GA (1994) Genetic variability in the reactive distance in Trichogramma brassicae after automatic tracking of the walking path. Entomol Exp Appl 72:297-303
Carter MC, Dixon AFG (1982) Habitat quality and the foraging behaviour of coccinelid larvae. J Anim Ecol 51:865-878
Chapman DS, Dytham C, Oxford GS (2007) Landscape and fine-scale movements of a leaf beetle: the importance of boundary behaviour. Oecologia 154:55-64
Charnov EL (1976) Optimal foraging: the marginal value theorem. Theor Pop Biol 9:129-136
Codling EA, Plank MJ, Benhamou S (2008) Random walk models in biology. J Roy Soc Inter 5:813-834
Colgan PW (1989) Animal motivation. Chapman and Hall, New York
Cronin JT, Hyland K, Abrahamson WG (2001) The pattern, rate and range of within-patch movement of a stem-galling fly. Ecol Entomol 26:16-24 Dall SRX, Cuthill IC (1997) Searching in patches by European starlings, Sturnus
vulgaris. Behav Process 39:149-159
de Knegt HJ, Hengeveld GM, van Langevelde F, de Boer WF, Kirkman KP (2007) Patch density determines movement patterns and foraging efficiency of large herbivores. Behav Ecol 18:1065-1072
Driessen G, Bernstein C, van Alphen JJM, Kacelnik A (1995) A count-down mechanism for host search in the parasitoid Venturia canescens. J Anim Ecol 64:117-125
Eliassen S, Jørgensen C, Mangel M, Giske J (2009) Quantifying the adaptive value of learning in foraging behavior. Am Nat 174:478-489
Focardi S, Marcellini P, Montanaro P (1996) Do ungulates exhibit a food density threshold? A field study of optimal foraging and movement patterns. J Anim Ecol 65:606-620
Fraser CP, Ruxton GD, Broom M (2006) Public information and patch estimation for group foragers: a re-evaluation of patch-quitting strategies in a patchy environment. Oikos 112:311-321
Galis F, van Alphen JJM (1981) Patch time allocation and search intensity of
Asobara tabida Nees (Braconidae), a larval parasitoid of Drosophila. Neth
J Zool 31:596-611
Gardner SM, van Lenteren JC (1986) Characterisation of the arrestment responses of Trichogramma evanescens. Oecologia 68:265-270
Gossard TW, Jones RE (1977) The effects of age and weather on egg-laying in
Pieris rapae L. J Appl Ecol 14:65-71
Green RF (1984) Stopping rules for optimal foragers. Am Nat 123:30-43
Green RF (2006) A simpler, more general method of finding the optimal foraging strategy for Bayesian bird. Oikos 112:274-284
Hancock PE, Milner-Gulland EJ (2006) Optimal movement strategies for social foragers in unpredictable environments. Ecology 87:2094-2102
Hoffmeister TS, Wajnberg E (2008) Finding optimal behaviors with genetic algorithms. In: Wajnberg E, Bernstein C, van Alphen J (eds) Behavioural ecology of insect parasitoids - From theoretical approaches to field applications. Blackwell Publishing, Oxford, pp 384-401
Holyoak M, Casagrandi R, Nathan R, Revilla E, Spiegel O (2008) Trends and missing parts in the study of movement ecology. P Natl Acad Sci USA 105:19060-19065
Houston AI (1987) The control of foraging decisions. In: Commons ML, Kacelnik A, Shettleworth SJ (eds) Quantitative analyses of behavior. Foraging, vol 4. Erlbaum, pp 41-61
Iwasa Y, Higashi M, Yamamura N (1981) Prey distribution as a factor determining the choice of optimal foraging strategy. Am Nat 117:710-723
10
Lefebvre D, Pierre J, Outreman Y, Pierre J-S (2007) Patch departure rules in Bumblebees: evidence of a decremental motivational mechanism. Behav Ecol Sociobiol 61:1707-1715
Liu Y-Q, Bernstein C, Thiel A (2009) Travel duration, energetic expenditure, and patch exploitation in the parasitic wasp Venturia canescens. Behav Ecol Sociobiol 63:1459-1469
McIntyre NE, Wiens JA (1999) Interactions between landscape structure and animal behaviour: the roles of heterogeneously distributed resources and food deprivation on movement patterns. Landscape Ecol 14:437-447 McNamara JM, Houston AI (1985) Optimal foraging and learning. J Theor Biol
117:231-249
McNamara JM, Houston AI (1987) Memory and the efficient use of information. J Theor Biol 125:385-295
McNamara JM, Houston AI (2009) Integrating function and mechanism. Trends Ecol Evol 24:670-675
Nathan R, Getz WM, Revilla E, Holyoak M, Kadmon R, Saltz D, Smouse PE (2008) A movement ecology paradigm for unifying organismal movement research. P Natl Acad Sci USA 105:19052-19059
Nelson JM, Roitberg BD (1995) Flexible patch time allocation by the leafminer parasitoid, Opius dimidiatus. Ecol Entomol 20:245-252
Nonacs P (2001) State dependent behavior and the Marginal Value Theorem. Behav Ecol 12:71-83
Nonaka E, Holme P (2007) Agent-based model approach to optimal foraging in heterogeneous landscapes: effects of patch clumpiness. Ecography 30:777-788
Outreman Y, Le Ralec A, Wajnberg E, Pierre J-S (2005) Effects of within- and among-patch experiences on the patch-leaving decision rules in an insect parasitoid. Behav Ecol Sociobiol 58:208-217
Pierre J-S, Masson J-P, Wajnberg E (2012) Patch leaving rules: A stochastic version of a well-known deterministic motivational model. J Theor Biol 313:1-11
R Development Core Team (2011) R: A language and environment for statistical computing. R Foundation for Statistical Computing, Vienna, Austria. ISBN
3-900051-07-0, URL http://www.R-project.org/
Reynolds AM (2012) Fitness-maximizing foragers can use information about patch quality to decide how to search for and within patches: optimal Lévy walk searching patterns from optimal foraging theory. J Roy Soc Inter 9:1568-1575
Roitberg BD (1985) Search dynamics in fruit-parasitic insects. J Insect Physiol 31:865-872
Ruxton GD, Beauchamp G (2008) The application of genetic algorithms in behavioural ecology, illustrated with a model of anti-predator vigilance. J Theor Biol 250:435-448
Stephens DW, Krebs JR (1986) Foraging theory. Princeton University Press, Princeton, New Jersey
Stillman RA, Sutherland WJ (1990) The optimal search patterns in a patchy environment. J Theor Biol 145:177-182
Strand MR, Vinson SB (1982) Behavioral response of the parasitoid Cardiochiles
nigriceps to a kairomone. Entomol Exp Appl 31:308-315
Sumida BH, Houston AI, McNamara JM, Hamilton WD (1990) Genetic algorithms and evolution. J Theor Biol 147:59-84
Tentelier C, Desouhant E, Fauvergue X (2006) Habitat assessment by parasitoids: mechanisms for patch use behavior. Behav Ecol 17:515-521
Thiel A, Hoffmeister TS (2004) Knowing your habitat: linking patch-encounter rate and patch exploitation in parasitoids. Behav Ecol 15:419-425
Turchin PB (1986) Modeling the effect of host patch size on Mexican bean beetle emigration. Ecology 67:124-132
Turchin P (1998) Quantitative analysis of movement: measuring and modeling population redistribution in plants and animals. Sinauer Associates, Sunderland
Waage JK (1978) Arrestment responses of the parasitoid, Nemeritis canescens, to a contact chemical produced by its host, Plodia interpunctella. Physiol Entomol 3:135-146
Waage JK (1979) Foraging for patchily-distributed hosts by the parasitoid,
Nemeritis canescens. J Anim Ecol 48:353-371
Wajnberg E (2006) Time allocation strategies in insect parasitoids: from ultimate predictions to proximate behavioural mechanisms. Behav Ecol Sociobiol 60:589-611
Wajnberg E (2012) Multi-objective behavioural mechanisms are adopted by foraging animals to achieve several optimality goals simultaneously. J Anim Ecol 81:503-511
Wajnberg E, Colazza S (1998) Genetic variability in the area searched by a parasitic wasp. Analysis from automatic video tracking of the walking path. J Insect Physiol 44:437-444
Wajnberg E, Coquillard P, Vet LEM, Hoffmeister T (2012) Optimal resource allocation to survival and reproduction in parasitic wasps foraging in fragmented habitats. PLoS ONE 7:e38227
11
Wajnberg E, Curty C, Colazza S (2004) Genetic variation in the mechanisms of direct mutual interference in a parasitic wasp: consequences in terms of patch-time allocation. J Anim Ecol 73:1179-1189.
Whitley D (1989) The GENITOR algorithm and selective pressure: why rank-based allocation of reproductive trials is best. In: Schaffer D (ed) Proceedings of the 3rd International Conference on Genetic Algorithms. Morgan Kaufmann, Waltham, pp 116-121
Zollner PA, Lima SL (1999) Search strategies for landscape-level interpatch movements. Ecology 80:1019-1030
12
Figure captions
Fig. 1 Examples of intra-patch movement pattern of isolated foraging
animals, exploiting a patch contained 5 (right), 10 (middle) or 15 (left) fixed resource items, produced by the simulation model. White and black dots are representing resource items that remained or that have been exploited, respectively. In the three cases, the values of the parameters used were: G1 = 0.05; G2 = 4.0; G3 = -3.0; G4 = 0.0 (see text)
13
Fig. 2 Average (+ SE) optimised values of the four parameters G1 to G4
with different distributions of resource items per patch and in different environment having 5 (white), 10 (grey) or 15 (black) average number of resource items per patch. Parameters G1 and G2 describe respectively the speed at which the walking pattern and the bouncing behaviour on the patch edge change in the course of time while parameters G3 and G4 are the incremental (negative values) or decremental (positive values) effects each resource item discovered has on the walking pattern and bouncing behaviour on the patch edge, respectively, in terms of patch residence time (see text). In each graph, average values followed by different letters are significantly different at p < 0.05 (Tukey test)
14
Fig. 3 Sensitivity analysis of the four parameters G1 to G4 done to
quantify their importance for the simulated animals to behave in accordance to the Marginal Value Theorem (MVT) optimum. For each parameter, simulations were done with different values extending -6×SE to 6×SE around the optimised values. In each case, simulations were done in all environmental situations compared, and average (± SE) results of the criterion representing a distance to the optimal MVT behaviour (see text, eq. 4) are represented, pooling all environmental richnesses and all distributions of resource items per patch. See Fig. 2 for a description of the four parameters G1 to G4
15
Table 1 Definition of all parameters of the model with the values used. Parameters
G1, G2, G3 and G4 are those that were optimised by means of a genetic algorithm Parameters Meaning / values used
Average resource items per patch [5, 10, 15]
Distribution of resources per patch [uniform, Poisson, aggregative (with k=1.0)]
t Time elapsed since the animal entered the patch Average walking speed at each time
step
(
)
te
− ×+
G19
1
/
10
(arbitrary units) Standard deviation of linear walkingspeed
5 (arbitrary units) Average turning angle at each time
step
Direction of movement at the preceding time step Standard deviation of turning angle Given by a decreasing logistic function (from 45° to 0°) coupled to the function used to compute the average linear walking speed (see above) G1 (>0) Rate of increase in average walking speed and
decrease in turning angle with time Probability to bounce back to the
center upon encountering the patch border
R
e
−G2×R Number of times the patch border has been encountered
G2 (>0) Rate of decrease of the probability to return to the centre upon encountering the patch border Reactive distance to resource items 10 arbitrary units
r Total number of resource items discovered since the animal entered the patch
G3 (real number) Intensity of the switching effect of each resource item discovered on the walking behaviour of the animal
G4 (real number) Intensity of the switching effect of each resource item discovered on the probability to bounce back to the centre upon encountering the patch border Travel time between patches 200 time steps