HAL Id: hal-01535201
https://hal.archives-ouvertes.fr/hal-01535201
Submitted on 8 Jun 2017
HAL is a multi-disciplinary open access
archive for the deposit and dissemination of
sci-entific research documents, whether they are
pub-lished or not. The documents may come from
teaching and research institutions in France or
abroad, or from public or private research centers.
L’archive ouverte pluridisciplinaire HAL, est
destinée au dépôt et à la diffusion de documents
scientifiques de niveau recherche, publiés ou non,
émanant des établissements d’enseignement et de
recherche français ou étrangers, des laboratoires
publics ou privés.
Distributed under a Creative Commons Attribution - ShareAlike| 4.0 International
License
hypertrophy but not myofibre production
Pierre-Yves Rescan, Aurélie Le Cam, Cécile Ralliere, Jérôme Montfort
To cite this version:
Pierre-Yves Rescan, Aurélie Le Cam, Cécile Ralliere, Jérôme Montfort. Global gene expression in
muscle from fasted/refed trout reveals up-regulation of genes promoting myofibre hypertrophy but
not myofibre production. BMC Genomics, BioMed Central, 2017, 18 (1), pp.1-12.
�10.1186/s12864-017-3837-9�. �hal-01535201�
R E S E A R C H A R T I C L E
Open Access
Global gene expression in muscle from
fasted/refed trout reveals up-regulation of
genes promoting myofibre hypertrophy
but not myofibre production
Pierre-Yves Rescan
*, Aurelie Le Cam, Cécile Rallière and Jérôme Montfort
Abstract
Background: Compensatory growth is a phase of rapid growth, greater than the growth rate of control animals, that occurs after a period of growth-stunting conditions. Fish show a capacity for compensatory growth after alleviation of dietary restriction, but the underlying cellular mechanisms are unknown. To learn more about the contribution of genes regulating hypertrophy (an increase in muscle fibre size) and hyperplasia (the generation of new muscle fibres) in the compensatory muscle growth response in fish, we used high-density microarray analysis to investigate the global gene expression in muscle of trout during a fasting-refeeding schedule and in muscle of control-fed trout displaying normal growth.
Results: The compensatory muscle growth signature, as defined by genes up-regulated in muscles of refed trout compared with control-fed trout, showed enrichment in functional categories related to protein biosynthesis and maturation, such as RNA processing, ribonucleoprotein complex biogenesis, ribosome biogenesis, translation and protein folding. This signature was also enriched in chromatin-remodelling factors of the protein arginine N-methyl transferase family. Unexpectedly, functional categories related to cell division and DNA replication were not inferred from the molecular signature of compensatory muscle growth, and this signature contained virtually none of the genes previously reported to be up-regulated in hyperplastic growth zones of the late trout embryo myotome and to potentially be involved in production of new myofibres, notably genes encoding myogenic regulatory factors, transmembrane receptors essential for myoblast fusion or myofibrillar proteins predominant in nascent myofibres. Conclusion: Genes promoting myofibre growth, but not myofibre formation, were up-regulated in muscles of refed trout compared with continually fed trout. This suggests that a compensatory muscle growth response, resulting from the stimulation of hypertrophy but not the stimulation of hyperplasia, occurs in trout after refeeding. The generation of a large set of genes up-regulated in muscle of refed trout may yield insights into the molecular and cellular mechanisms controlling skeletal muscle mass in teleost and serve as a useful list of potential molecular markers of muscle growth in fish.
Keywords: Muscle growth, Muscle hyperplasia, Muscle hypertrophy, Gene expression, Transcriptome, Teleost
* Correspondence:pierre-yves.rescan@inra.fr
INRA, UR 1037, LPGP Fish Physiology and Genomics, Campus de Beaulieu, F-35042 Rennes, France
© The Author(s). 2017 Open Access This article is distributed under the terms of the Creative Commons Attribution 4.0 International License (http://creativecommons.org/licenses/by/4.0/), which permits unrestricted use, distribution, and reproduction in any medium, provided you give appropriate credit to the original author(s) and the source, provide a link to the Creative Commons license, and indicate if changes were made. The Creative Commons Public Domain Dedication waiver (http://creativecommons.org/publicdomain/zero/1.0/) applies to the data made available in this article, unless otherwise stated.
Background
Skeletal muscle has a number of important functions: it maintains posture, produces locomotion and is a dominant organ in energy metabolism. Skeletal muscle is a dynamic structure that forms during embryogenesis, grows after-wards and is subjected to remodeling and changes in mass under a variety of physiological conditions such as nutri-tional perturbations, modifications of activity or ageing. In mammals, embryonic and fetal skeletal muscle forms and grows via the proliferation, differentiation and fusion of myogenic cells, whereas postnatal muscle grows largely through remodelling of pre-existing myofibres [1]. In con-trast, fish lastingly combine muscle hyperplasia (generation of new fibres) and hypertrophy (increase in fibre size) to generate indeterminate muscle growth [2, 3]. Muscle hyperplasia in fish initially occurs in a discrete layer at the surface of the myotome in late embryos or early larvae. This regionalized phase of myogenesis, termed stratified hyperplasia, results from the differentiation of myogenic progenitor cells originating from the dermomyotome-like epithelium present at the surface of the embryonic myo-tome [4–6]. At post-larval stages, new myofibres are formed between existing muscle fibres throughout the myotome, thus producing a typical mosaic appearance in muscle cross sections [2]. A Myog:GFP transgenic trout model has revealed that mosaic hyperplasia is prevalent in the juvenile stage, but progressively decreases as trout age, and eventually ceases at approximately 18 months post-fertilization [7]. Nevertheless, potentially recruitable muscle stem cells are present in muscles of aged trout, as shown by their ability to form myofibres de novo after muscle injury [7, 8].
Although the genetic programs determining muscle de-velopment are well characterized in vertebrates, including fish [9], little is known regarding the programs involved in muscle remodelling and muscle mass changes occurring throughout life. Among adaptive responses that remodel muscle, there is compensatory growth. Compensatory growth is a phase of rapid growth, greater than the growth rate of control animals, that follows growth depression [10]. Compensatory growth is triggered by refeeding of animals after a period of weight loss induced by a prolonged fasting period. In fish, compensatory growth has been related to an increase in feed intake (hyperphagia) [11] and efficiency of food utilization [10]. Hence, there is considerable interest in exploiting compensatory growth, through the design of feeding schedule, to optimize muscle growth [12, 13]. Using nylon macroarrays, we have previously reported a prelimin-ary exploration of the temporal gene expression profiling of trout muscle during a fasting-refeeding schedule [14]. In the present study, using a high-density Agilent-based microarray platform for trout, and considering the gene ex-pression of control-fed trout that displayed usual growth, we exhaustively defined genes specifically associated with
the compensatory muscle growth response, and characte-rized the corresponding functional categories. Additionally, to further characterize the cellular mechanisms involved in the compensatory growth response, we compared the genes composing the compensatory muscle growth signature and the genes up-regulated in hyperplastic growth zones of the post-embryonic trout myotome, as they were previously identified using laser-capture microdissection combined with the same Agilent-based microarray platform [15].
Results
Growth characteristics in fasted, fasted-refed and control (normally) fed trout
Changes in body weight and condition factor K, an indica-tor of body shape, are shown in Fig. 1. This figure shows a slight decrease in total body weight after fasting that was followed by an increase in total body weight after refeed-ing. Nonetheless, total body weight increase in refed ani-mals was found to be comparable to that observed in control group from day 0 to day 36. The condition factor K decreased after nutrient deprivation and increased after refeeding to reach control level. By contrast, condition fac-tor only moderately decreased at day 36. On the whole, these data show a resumption of growth after refeeding, but comparison of growth curves in refed and control trout did not objectify a burst of muscle growth after refeeding. To further provide experimental evidence of a compensatory growth response in muscle of refed trout, a global gene expression analysis was conducted in muscle of refed and control-fed trout.
Gene expression profiling overview
Anova test was used to define genes whose expression levels in trout muscle were significantly different across the various feeding conditions considered (fasted for 1 month (F0), fasted for 2 month and then refed 4, 11 or 36 days (RF4, RF11 and RF36, respectively) and normally fed (control: C0). This analysis led to the identification of approximately 2300 unique differentially expressed genes. The hierarchical clustering of differentially expressed genes, shown in Fig. 2 and available through the heat map file (Additional file 1) and Java TreeView tool (https://sour-ceforge.net/projects/jtreeview/files/) resulted in the for-mation of three major clusters with distinct expression profile. Cluster I contained genes up-regulated in muscles of fasted trout and then down-regulated after refeeding. This cluster contained markers of muscle atrophy such as FBXO32/atrogin1 and trim63 (murf1), and markers of autophagy such as SQSTM1, thus indicating the acti-vation of proteolytic systems in muscles of fasted trout. Clusters IIa and IIb both contained genes up-regulated after refeeding. Cluster IIa included genes whose ex-pression levels after refeeding were restored to values found in control (normally fed) trout, and cluster IIb
included genes whose expression levels after refeeding exceeded those in muscles of control-fed trout. Because compensatory growth refers to a faster than usual (con-trol-fed) growth rate that is induced after refeeding of fasted animals [16], we reasoned that the compensatory muscle growth signature, consisted only of genes con-tained in cluster IIb. The study presented here focused on genes up-regulated after refeeding and more espe-cially on those forming the compensatory growth signa-ture (cluster IIb).
Cluster IIa: Genes whose expression levels after refeeding was restored to values found in control trout
Cluster IIa was composed of 422 unique genes whose expression levels during muscle recovery progressively in-creased to reach those of normally fed trout. Gene onto-logy analysis was performed to understand the functional significance of the genes contained in cluster IIa. The DAVID analysis of 357 eligible genes specific to this cluster showed enrichment in GO terms linked to cell division (mitosis (P < 1.4.10−7), organelle fission (P < 2.6.10−7) and
chromosome condensation (P < 3.9.10−4)). In addition, the
genes in cluster IIa showed enrichment in GO terms re-lated to cytoskeleton organization (P < 3.7.10−6),
compo-nents of the sarcomere (P < 2.5.10−5, 12 genes including
myosins, skeletal muscle actins, troponins and tropomyo-sins), and proteins of the extracellular matrix (P < 4.10−11,
31 genes including collagen chains, laminin subunits, peri-ostin, CILP1, tenascin and many proteoglycans such as syndecan 2, mimecan and keratocan). Overall, cluster IIa showed enrichment in genes involved in cell division and genes encoding structural components of muscle fibres (for details, see Table 1 and Additional file 2 for list of genes that formed cluster IIa).
Cluster IIb: Genes whose expression levels after refeeding exceeded those in control trout
Cluster IIb was composed of 1161 unique genes up-regulated in muscles of refed trout compared with both fasted and control-fed trout; as such, we identified clus-ter IIb as the compensatory muscle growth signature. Notably, genes composing cluster IIb clearly displayed an earlier up-regulation after refeeding than genes form-ing cluster IIa. A DAVID analysis of 960 eligible genes showed enrichment in GO terms linked to transcription, such as RNA processing (P < 5.6.10−53), rRNA metabolic
process (P < 7.4.10−30), mRNA metabolic process
(p < 2.8.10−19), tRNA metabolic process (P < 1.2.10−17),
and ribonucleoprotein complex biogenesis (P < 7.10−49).
Other GO terms associated with cluster IIb included translation (P < 4.7.10−27), ribosome biogenesis (P < 9.1.10 −38), which determines translation capacity, cellular
macromolecular complex assembly (P < 8.4.10−16) and
protein folding (P < 7.1.10−20). Enrichment in genes
in-volved in mitochondria biogenesis and activity (P < 2.10
−19) was also found in cluster IIb. Finally, cluster IIb
in-cluded many genes encoding epigenetic transcriptional regulators. Among them were the histone-lysine N-methyltransferases EZH2, jarid2/Jumonji and RBBP4 which are all components of the PCR2 complex, the histone-lysine N-methyltransferases EHMT2, SETDB1 and WHSC1/NSD2, and many histone modifying enzymes of the protein arginine methyltransferase (PRMT) family such as Prmt1-A, Prmt1-B Prmt3; Prmt5, Prmt6 and Prmt7 (Fig. 3). Overall, the molecular signature of com-pensatory muscle growth showed enrichment in genes en-coding histone methyltransferases, genes regulating protein biosynthesis for cell growth and genes involved in mitochondrion biogenesis for energy supply (for details, see Tables 1, 2, 3 and 4, and Additional file 3 for list of Fig. 1 Change in body mass and condition factor over the time course of the experiment. Body weight (a) and condition factor (b) curves of trout in experimental (fasted-refed) and control (normally fed) groups. Bars indicate standard error of the mean
genes that that formed the major functional categories of cluster IIb).
The compensatory muscle growth signature does not include genes involved in the formation of new myofibres
To characterize the genetic mechanisms regulating the formation of new myofibres in fish we previously exam-ined the transcriptome of the superficial hyperplastic growth zones of the late trout embryo myotome by using laser capture microdissection and microarray ana-lysis [15]. In this study, to further characterize the
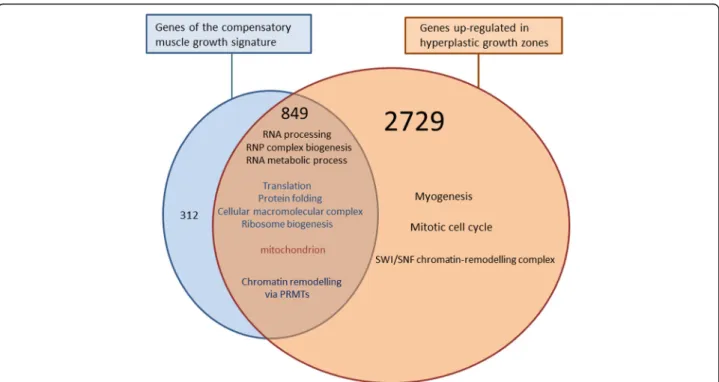
cellular mechanisms involved in the compensatory growth response, we compared its molecular signature with that of the superficial hyperplastic growth zones. A Venn diagram showed that most of the genes (849 out of 1161) of the compensatory muscle growth signature were included in the list of genes up-regulated in super-ficial hyperplastic growth zones (Fig. 4). As a result, GO categories inferred from genes common to both situa-tions were mostly those inferred from the compensatory growth signature, and were related to protein biosyn-thesis and maturation such as RNA processing, ribonu-cleoprotein complex biogenesis, ribosome biogenesis, translation and protein folding. Additionally, several epi-genetic factors of the protein arginine N-methyl transfer-ase (PRMT) family (i.e., Prmt1-A, Prmt-B Prmt3; Prmt5, Prmt6 and Prmt7), as well as several histone lysine N-methyltransferases (EZH2, EHMT2, WHSC1/NSD2 and SETDB1), were found in both situations. In contrast, none of the genes up-regulated in hyperplastic growth zones and that encode SWI/SNF chromatin-remodelling enzymes (i.e., Smarcd1, Smarce1, Smarcb1A, smarca5, smarcad1, Smarcab1, Smarcc1 and Smarca4/BRG1) ap-peared in the compensatory growth signature. This showed that only a subset of the chromatin-remodelling factors up-regulated in hyperplastic growth zones, was present in the compensatory muscle growth signature. Unexpectedly, GO terms related to DNA replication and cell cycle and that were inferred from genes up-regulated in hyperplastic growth zones were not found in the compensatory muscle growth signature. Addition-ally, transcriptional regulators, immunoglobulin domain-containing transmembrane proteins and secreted/signal-ling molecules known or predicted to be important in the differentiation of myogenic cells or their fusion into new myofibres were virtually absent from the compensa-tory growth signature. For example, neither canonical myogenic transcriptional regulators (Pax3, Pax7 and MRFs such as MyoD1a, MyoD1b and MyoD1c, myf5, myogenin and mrf4), nor genes encoding transcriptional regulators known to modulate MRF activity, such as Tsh3, ARX, meis1 and pbx1, were found to be associated with compensatory growth, whereas they were up-regulated in hyperplastic growth zones. Additionally, among the >30 genes found to be specific to the superfi-cial growth areas and to encode homeobox-containing transcriptional regulators or members of the Hairy and enhancer of split family, none were included within the compensatory growth signature. Of note, Hairy and en-hancer of split 6 and myogenin were found to exhibit in-creased expression after refeeding, but their transcription levels were never above those found in control animals. With the notable exception of M-cadherin, hyperplasia-correlated genes encoding promyogenic membrane recep-tors such as N-cadherin, Brother of CDO, NCAM and Fig. 2 Hierarchical clustering of differentially expressed genes in
muscle during a fasting-refeeding schedule and in control-fed trout displaying usual growth. Hierarchical clustering of differentially expressed genes led to the formation of three distinct clusters: I, IIa and IIb. Cluster IIb, which includes genes up-regulated in muscles of refed trout compared with control-fed trout, defines the specific molecular signature of compensatory muscle growth following refeeding. Each row represents the expression pattern of a single gene, and each column corresponds to a single sample: columns 1 to 5, muscles from fasted trout; columns 6 to 10, 11 to 15 and 16 to 19, muscles from 4-, 11- and 36-days refed trout respectively; columns 20 to 23, muscles of control-fed trout. The expression levels are represented by colored tags, with red representing the highest levels of expression and green representing the lowest levels of expression
protogenin [17], or the essential fusion effectors Kin of Irre like-3, and Jamb [18, 19] were also absent from the compensatory muscle growth signature. Similarly, with the exception of stromal cell-derived factor 2-like protein 1 and Hepatoma-derived growth factor-related protein, virtually all the hyperplasia-correlated genes encoding se-creted factors were absent from the compensatory signa-ture. Finally, because the same Agilent-based microarray was used for gene expression profiling in both experi-ments, we reliably determined that among the >30 distinct genes encoding myofibrillar proteins (e.g., troponins, myosin chains, myosin binding proteins, tropomyosins, alpha actins, myozenins) that were up-regulated in laser-captured hyperplastic growth zones, only one (tropo-myosinα4-chain) was found in the compensatory muscle
growth signature (cluster IIb), and none were found among the numerous myofibrillar protein genes found in cluster IIa. Together, these data showed that genes com-mon to superficial hyperplastic growth zone and to the compensatory muscle growth signature were related to protein biosynthesis for myofibre growth. In contrast, hyperplasia-correlated genes involved in myofibre produc-tion or encoding myofibrillar proteins specific to nascent myofibres were virtually excluded from the compensatory growth signature.
Discussion
Until now, very little was known regarding the muscle growth pattern during a fasting-refeeding sequence, essen-tially because cellularity analysis is difficult to interpret in
Table 1 Functional categories related to cluster IIa and cluster IIb
Cluster IIa Cluster IIb
Term Count pValue Term Count p Value GO Biological process GO Biological processes
mitosis 20 1.4.10-7 RNA processing RNA processing 137 5.6.10-53 organelle fission 20 2.6.10-7 ribonucleoprotein complex biogenesis 78 7.10-49 cell division 21 3.1.10-6 ribosome biogenesis 57 9.1.10-38 cytoskeleton organization 26 3.7.10-6 rRNA metabolic process 45 7.4.10-30 GO cellular component translation 77 4.7.10-27 extracellular matrix 31 4.10-11 protein folding 48 7.1.10-20 contractile fiber part 12 2.5.10-5 mRNA metabolic process 70 2.8.10-19 condensed chromosome 11 3.9.10-4 tRNA metabolic process 37 1.2.10-17 cellular macromolecular complex assembly 59 8.4.10-16 GO cellular component membrane-enclosed lumen 297 1.10-69 nucleolus 140 1.1.10-40 mitochondrion 138 2.10-19 spliceosome 41 6.6.10-19 ribosome 47 5.4.10-15 small nuclear ribonucleoprotein complex 16 1.9.10-13
this case. Indeed, small muscle fibres result either from the production of new fibres (muscle hyperplasia) or from the shrinking of pre-existing fibres (muscle fibre atrophy).
To gain insight into the relative contribution of hyper-trophy and hyperplasia in the compensatory muscle growth response, we performed transcriptomic analysis in
Table 2 List of genes of the compensatory muscle growth signature involved in translation
ID Gene Name ID Gene Name
ABCF1 ATP-binding cassette, sub-family F (GCN20), member 1 MRPL12 mitochondrial ribosomal protein L12 GFM1 G elongation factor, mitochondrial 1 MRPL17 mitochondrial ribosomal protein L17 SEPSECS Sep (O-phosphoserine) tRNA:Sec (selenocysteine) tRNA synthase MRPL22 mitochondrial ribosomal protein L22 TSFM Ts translation elongation factor, mitochondrial MRPL28 mitochondrial ribosomal protein L28 AARS alanyl-tRNA synthetase MRPL3 mitochondrial ribosomal protein L3 RARS arginyl-tRNA synthetase MRPL32 mitochondrial ribosomal protein L32 NARS asparaginyl-tRNA synthetase MRPL37 mitochondrial ribosomal protein L37 CARS cysteinyl-tRNA synthetase MRPL4 mitochondrial ribosomal protein L4 DENR density-regulated protein MRPL45 mitochondrial ribosomal protein L45 EEFSEC eukaryotic elongation factor, selenocysteine-tRNA-specific MRPL47 mitochondrial ribosomal protein L47 EEF1E1 eukaryotic translation elongation factor 1 epsilon 1 MRPL51 mitochondrial ribosomal protein L51 EIF1AX eukaryotic translation initiation factor 1A, X-linked MRPL52 mitochondrial ribosomal protein L52 EIF2S1 eukaryotic translation initiation factor 2, subunit 1 alpha, 35 kDa MRPL55 mitochondrial ribosomal protein L55 EIF2B1 eukaryotic translation initiation factor 2B, subunit 1 alpha,
26 kDa
MRPS10 mitochondrial ribosomal protein S10 EIF2B3 eukaryotic translation initiation factor 2B, subunit 3 gamma,
58 kDa
MRPS12 mitochondrial ribosomal protein S12 EIF3D eukaryotic translation initiation factor 3, subunit D MRPS18B mitochondrial ribosomal protein S18B EIF3H eukaryotic translation initiation factor 3, subunit H MRPS25 mitochondrial ribosomal protein S25 EIF3J eukaryotic translation initiation factor 3, subunit J MRPS33 mitochondrial ribosomal protein S33 EIF4G1 eukaryotic translation initiation factor 4 gamma, 1 MRPS5 mitochondrial ribosomal protein S5 EIF4G2 eukaryotic translation initiation factor 4 gamma, 2 MRPS6 mitochondrial ribosomal protein S6 EIF4G3 eukaryotic translation initiation factor 4 gamma, 3 PELO pelota homolog
EIF4E eukaryotic translation initiation factor 4E RSL1D1 ribosomal L1 domain containing 1 EIF4H eukaryotic translation initiation factor 4H RPL23 ribosomal protein L23 pseudogene 6 EIF5 eukaryotic translation initiation factor 5 RPL31 ribosomal protein L31 pseudogene 49 EIF5B eukaryotic translation initiation factor 5B RPL5 ribosomal protein L5 pseudogene 34
EIF6 eukaryotic translation initiation factor 6 RPL7L1 ribosomal protein L7-like 1; ribosomal protein L7 pseudogene 14
ETF1 eukaryotic translation termination factor 1 RPS9 ribosomal protein S9; ribosomal protein S9 pseudogene 4 GTF2B general transcription factor IIB RRBP1 ribosome binding protein 1 homolog 180 kDa (dog) QARS glutaminyl-tRNA synthetase SARS2 seryl-tRNA synthetase 2, mitochondrial
GARS glycyl-tRNA synthetase EIF4A1 eukaryotic translation initiation factor 4A, isoform 1 HARS histidyl-tRNA synthetase MRPL20 similar to mitochondrial ribosomal protein L20 DTD1 D-tyrosyl-tRNA deacylase 1 homolog TRMT6 tRNA methyltransferase 6 homolog
LARS leucyl-tRNA synthetase TARS threonyl-tRNA synthetase
LGTN ligatin TPR translocated promoter region (to activated MET oncogene) KARS lysyl-tRNA synthetase WARS2 tryptophanyl tRNA synthetase 2, mitochondrial
MARS methionyl-tRNA synthetase WARS tryptophanyl-tRNA synthetase
MRP63 mitochondrial ribosomal protein 63 YARS2 tyrosyl-tRNA synthetase 2, mitochondrial MRPL10 mitochondrial ribosomal protein L10 VARS valyl-tRNA synthetase
muscles of fasted, refed and control-fed trout and specific-ally investigate the expression of genes potentispecific-ally involved in these two processes. Although our experimental proto-col was designed to exacerbate compensatory growth (i.e., long fasting period and large excess of food during refeed-ing), growth curve in refed trout did not show the ideal-ized pattern of growth compensation as presented in reviews in the field [10, 20]. Methodological problems in studies on compensatory growth have however been raised when considering growth trajectories [10]. And it is noteworthy that an absence of clear compensatory growth
trajectory has been previously reported in fasted/refed trout [21, 22] and tilapia [23]. Changes in body shape (condition factor) was more suggestive of a compensatory response in our study, but food present de novo in the di-gestive tract of refed animals likely induced biased weights and condition factors. On the other hand, one cannot for-mally exclude that the experimental period chosen in our study was too limited to allow the full expression of the compensatory growth potential. Anyway, that a specific compensatory muscle growth response occurred in trout after refeeding was suggested by the identification in refed
Table 3 List of genes of the compensatory muscle growth signature involved in ribosome biogenesis
ID Gene Name ID Gene Name
C1D C1D nuclear receptor co-repressor; AATF apoptosis antagonizing transcription factor DDX51 DEAD (Asp-Glu-Ala-Asp) box polypeptide 51 BRIX1 brix domain containing 2
DDX56 DEAD (Asp-Glu-Ala-Asp) box polypeptide 56 RPF1 brix domain containing 5 DIMT1L DIM1 dimethyladenosine transferase 1-like BYSL bystin-like
EBNA1BP2 EBNA1 binding protein 2 EIF6 eukaryotic translation initiation factor 6 FCF1 FCF1 small subunit (SSU) processome component
homolog
EXOSC10 exosome component 10 FTSJ3 FtsJ homolog 3 EXOSC2 exosome component 2 HEATR1 HEAT repeat containing 1 EXOSC3 exosome component 3 IMP3 IMP3, U3 small nucleolar ribonucleoprotein, homolog EXOSC4 exosome component 4 IMP4 IMP4, U3 small nucleolar ribonucleoprotein, homolog EXOSC7 exosome component 7 KRR1 KRR1, small subunit (SSU) processome component,
homolog)
EXOSC8 exosome component 8 MPHOSPH10 M-phase phosphoprotein 10 (U3 small nucleolar
ribonucleoprotein
FBL fibrillarin
MINA MYC induced nuclear antigen GNL3L guanine nucleotide binding protein-like 3 (nucleolar)-like NHP2L1 NHP2 non-histone chromosome protein 2-like 1 MRTO4 mRNA turnover 4 homolog
NOP14 NOP14 nucleolar protein homolog NIP7 nuclear import 7 homolog
NOP2 NOP2 nucleolar protein homolog NPM1 nucleophosmin 1 (nucleolar phosphoprotein B23, numatrin) NOP56 NOP56 ribonucleoprotein homolog PES1 pescadillo homolog 1, containing BRCT domain
NOP58 NOP58 ribonucleoprotein homolog POP4 processing of precursor 4, ribonuclease P/MRP subunit SDAD1 SDA1 domain containing 1 PDCD11 programmed cell death 11
TSR2 TSR2, 20S rRNA accumulation, homolog PA2G4 proliferation-associated 2G4, 38 kDa;
UTP11L UTP11-like, U3 small nucleolar ribonucleoprotein PIN4 protein (peptidylprolyl cis/trans isomerase) NIMA-interacting, 4 (parvulin)
UTP14A UTP14, U3 small nucleolar ribonucleoprotein, homolog A
RRP1 ribosomal RNA processing 1 homolog UTP15 UTP15, U3 small nucleolar ribonucleoprotein, homolog RRP1B ribosomal RNA processing 1 homolog B UTP18 UTP18, small subunit (SSU) processome component,
homolog
RRP8 ribosomal RNA processing 8, methyltransferase, homolog UTP23 UTP23, small subunit (SSU) processome component,
homolog
RRP9 ribosomal RNA processing 9, small subunit (SSU) processome component
UTP6 UTP6, small subunit (SSU) processome component, homolog
RPL5 ribosomal protein L5 WDR12 WD repeat domain 12 SURF6 surfeit 6
WDR36 WD repeat domain 36 TBL3 transducin (beta)-like 3 DCAF13 WD repeats and SOF1 domain containing
animals of a muscle molecular signature enriched in genes promoting muscle growth. Gene expression profiling overview showed that genes up-regulated after refeeding fell into two distinct categories: those whose expression level was restored to the values found in control-fed trout displaying normal growth and those whose expression level exceeded that found in control trout. Given that compensatory growth refers to a faster than usual growth rate [10], we reasoned that only genes in the second cat-egory formed the compensatory muscle growth signature, whereas genes of the first category signaled the restoration of cellular mechanisms involved in normal growth. The GO terms associated with genes whose expression was re-stored only after refeeding included cell division, organelle fission and condensed chromosome, thus suggesting that cell proliferation decreased in muscle during fasting but resumed after refeeding. Whether the resumption of cell proliferation after refeeding targets myogenic cells re-mains to be determined. However, a stimulation of myo-genic cell proliferation has been reported in the Antartic fish Notothenia coriiceps after feeding [24]. In line with
results from previous studies on muscle transcriptome dy-namics during fasting-induced recovery growth [14, 25], we observed, in refed trout, the up-regulation of genes en-coding structural components such as sarcomeric proteins and matricial compounds. However, we found that this up-regulation was limited to a restoration of the expres-sion level found during normal growth. Therefore, as in the case of cell cycle regulators, matricial compounds and myofibrillar proteins were excluded from the compensa-tory growth signature. In sharp contrast, a very large number of genes stimulating ribosome biogenesis or en-hancing translational efficiency were up-regulated in com-pensatory muscle growth compared to normal growth. This finding strongly suggested that the compensatory growth response was associated with an accretion of the protein mass necessary for muscle fibre hypertrophy. In agreement with this finding, a correlation has been re-cently established between ribosome biogenesis and the magnitude of fibre hypertrophy in overloaded mouse ske-letal muscle [26], and emerging evidence supports the view that ribosome biogenesis is a crucial mechanism used
Table 4 List of genes of the compensatory muscle growth signature involved in protein folding
ID Gene Name ID Gene Name
Sel15 15 kDa selenoprotein HSPD1 heat shock 60 kDa protein 1 (chaperonin) AHSA1 AHA1, activator of heat shock 90 kDa protein ATPase
homolog 1
HSPA4L heat shock 70 kDa protein 4-like BAG4 BCL2-associated athanogene 4 HSPA8 heat shock 70 kDa protein 8
DNAJA2 DnaJ (Hsp40) homolog, subfamily A, member 2 HSP90AA1 heat shock protein 90 kDa alpha (cytosolic), class A member 1 DNAJA4 DnaJ (Hsp40) homolog, subfamily A, member 4 TCP1 hypothetical gene supported by BC000665; t-complex 1 DNAJB9 DnaJ (Hsp40) homolog, subfamily B, member 9 LMAN1 lectin, mannose-binding, 1
DNAJC2 DnaJ (Hsp40) homolog, subfamily C, member 2 MPDU1 mannose-P-dolichol utilization defect 1
DNAJC21 DnaJ (Hsp40) homolog, subfamily C, member 21 PIN1 peptidylprolyl cis/trans isomerase, NIMA-interacting 1 FKBP11 FK506 binding protein 11, 19 kDa PPIL1 peptidylprolyl isomerase (cyclophilin)-like 1 FKBP2 FK506 binding protein 2, 13 kDa PPIB peptidylprolyl isomerase B (cyclophilin B) FKBP5 FK506 binding protein 5 PPID peptidylprolyl isomerase D
FKBP7 FK506 binding protein 7 PPIE peptidylprolyl isomerase E (cyclophilin E) RANBP2 RAN binding protein 2 PPIG peptidylprolyl isomerase G (cyclophilin G) RUVBL2 RuvB-like 2 (E. coli) PPIH peptidylprolyl isomerase H (cyclophilin H)
CANX calnexin PPWD1 peptidylprolyl isomerase domain and WD repeat containing 1 CALR calreticulin PFDN4 prefoldin subunit 4
CCT2 chaperonin containing TCP1, subunit 2 (beta) PFDN5 prefoldin subunit 5 CCT3 chaperonin containing TCP1, subunit 3 (gamma) PFDN6 prefoldin subunit 6
CCT4 chaperonin containing TCP1, subunit 4 (delta) PIN4 protein (peptidylprolyl cis/trans isomerase) NIMA-interacting, 4 (parvulin)
CCT5 chaperonin containing TCP1, subunit 5 (epsilon) PDIA5 protein disulfide isomerase family A, member 5
CCT6A chaperonin containing TCP1, subunit 6A (zeta 1) PPIA similar to TRIMCyp; peptidylprolyl isomerase A (cyclophilin A) CCT6B chaperonin containing TCP1, subunit 6B (zeta 2) DNAJC19 DnaJ (Hsp40) homolog, subfamily C, member 19
HSPE1 heat shock 10 kDa protein 1 (chaperonin 10) TOR1A torsin family 1, member A (torsin A) VBP1 von Hippel-Lindau binding protein 1
by skeletal muscle to regulate protein synthesis and con-trol muscle mass [27]. Our study further showed that the capacity to convert nascent polypeptides into functional three-dimensional structures also increased, as shown by the up-regulation of a large number of genes involved in this process, notably HSP90 and HSP70. HSP90 is re-quired for myofibril assembly in developing zebrafish em-bryos [28], and its expression has been shown to increase during muscle hypertrophy resulting from functional overload in rats and mice [29]. Recently, Hsp70-null mice have been reported to display a deficit in muscle fibre size [30]. Additionally, in agreement with protein synthesis and cellular growth, which require adjustments in chondrial ATP production, many genes involved in mito-chondrial biogenesis were found in the compensatory muscle growth signature. This finding is in line with previ-ous morphometric analyses showing an increase in mito-chondrial volume density during compensatory muscle hypertrophy produced by tenotomy of the tibialis anterior muscles of rats [31]. Palstra et al. have reported in zebrafish that muscle fibre hypertrophy promoted by swimming-induced exercise is associated with an activa-tion of the myogenic program [32]. In contrast, we found here that the up-regulation of genes promoting myofibre hypertrophy was not associated with an activation of genes involved in myofibre production. In particular,
myogenic regulatory factors of the MyoD family (MyoD, myogenin, myf5 and mrf4), which constitute a cross-regulatory transcriptional network at the core of myogenesis [33], were not found in the compensatory growth response. In line with this observation, Johansen and Overturf have reported only very few changes in MyoD1b and myf5 expression in trout muscle during refeeding following starvation [34]. In addition, the two Ig-domain transmembrane proteins Kin of Irre like3 and jamb which are essential for myocyte fusion in zebrafish embryo [18, 19], and the genes encoding contractile proteins preva-lent in hyperplastic growth zones were absent from the compensatory muscle growth signature. Finally, the com-pensatory muscle growth signature was found to share only a subset of the chromatin-remodelling factors evi-denced in hyperplastic growth zones. In particular, the SWI/SNF chromatin-remodelling enzymes up-regulated in hyperplastic growth zones were totally absent from this signature. This finding and the demonstration that Brg1/ smarca4-SWI/SNF complexes are key epigenetic determi-nants of skeletal muscle differentiation [35] strengthen the notion that the steeper growth rate associated with com-pensatory growth does not involve an increase in myogenic cell differentiation. Contrasting to SWI/SNF components, many histone N-methyl transferases were both up-regulated in hyperplastic growth zones and present in the Fig. 4 The compensatory muscle growth response involves only a subpart of the molecular signature of the hyperplastic growth zone. Venn diagram representing the distribution of genes of the compensatory muscle growth signature and genes up-regulated in the superficial hyperplastic growth zone of the late trout embryo. Functional categories inferred from genes common to the compensatory muscle growth and the hyperplastic growth zone signatures are detailed and major functional categories specific to hyperplastic growth zones are mentioned. The 312 genes specific of the compensatory muscle growth response were mostly related to translation, protein folding, RNA processing and ribosome biogenesis
compensatory growth signature. Among them were mem-bers of the protein arginine M-methyltransferases family. Nine distinct protein arginine M-methyltransferases have been identified in mammals [36] and only Prmt4/carm1 and Prmt5 have been reported to exert myogenic activity [37, 38]. Both Prmt4/carm1 and Prmt5 were up-regulated in hyperplastic growth zones but only Prmt5 was found in the compensatory muscle growth signature. How chromatin-remodelling factors regulate the expression of genes involved in the compensatory muscle growth response will be an interesting topic for futures studies. Together, all these data strongly suggest that the steeper growth rate associated with compensatory growth results from the stimulation of hypertrophy rather than the stimulation of hyperplasia. Of note, the compensatory muscle growth signature strongly differs from the tran-scriptome associated with regenerating muscle [8]; the lat-ter shows redeployment of the transcriptional program involved in myogenesis or myofibrillogenesis of nascent myotubes [8]. This result indicates that distinct genetic pathways may be activated to drive distinct aspects of the growth and remodeling of adult fish muscle.
Conclusion
Using an Agilent-based microarray platform, we identi-fied genes composing the molecular signature of muscle growth in fasted/refed trout and found that they were relevant to functional categories mostly involved in pro-tein synthesis and accretion. In contrast, genes up-regulated in hyperplastic growth zones of trout muscle and that are known or predicted to be important in the formation of new myofibres were virtually absent from this signature. These findings suggest that a burst of muscle growth occurs in refed trout which is mediated by stimulation of myofibre hypertrophy. The generation of a large set of genes composing the compensatory muscle growth signature expands our understanding of the molecular and cellular mechanisms controlling skel-etal muscle mass, and provide a useful list of potential molecular markers of muscle growth in fish.
Methods
Animals and experimental design A spring strain of l-year-old rainbow trout (Oncorhynchus mykiss) was used.Trout were continually fed to satiation until the beginning of the experiment, at which time two groups of trout weighing approximately 130 g were constituted and reared in two separate tanks contain-ing 2000 l of freshwater each. The experimental group was deprived of food for 30 days and refed for 36 days at a rate three times higher than satiation ra-tion to exacerbate growth resumpra-tion. Trout of the control group were continually fed to satiation until
the end of the experiment. Fasted fish and refed fish were taken from the experimental group at 0 day, 4 days, 11 days and 36 days following refeeding (termed F0, RF4, RF11 and RF36, respectively) with 10 fish sampled at each time point. Control-fed trout were taken 30 days (termed C0) and 66 days after the beginning of the experiment with 10 fish sampled at each time point. Fish were exposed to natural photo-period and fed with a commercial diet (BioMar, Nersac, France). The fish were rapidly anaesthetized with phenoxy-ethanol (Aquaveto, 4 ml per 10 l of fresh water) before total body weighing, length mea-surement and muscle sampling (10 fish at each time point). The condition factor (an indicator of the body shape) was calculated as follows: K = body weightx100/ body length 3 (the body length did not include the caudal fin length). Growth trajectories and condition factors were calculated from the 10 samples taken at each time point.
RNA extraction, labelled cRNA preparation, hybridisation
RNA samples of five distinct trout per feeding condi-tions (F0, RF4, RF11, RF36 and C0) were used for micro-array experiments. A transverse slice of fast muscle situated just beneath the dorsal fin was taken for RNA extraction using TRIzol (Invitrogen, Carlsbad, CA, USA) reagent following the manufacturer’s instructions. Cy3-labelled cRNA generation and hybridisation were per-formed as previously described [15]. A control sample that did not give signal on microarray was discarded from the gene expression analysis.
Microarray slides
An Agilent-based microarray platform with 8 × 60 K probes per slide was used. This platform (GEO platform record: GPL15840) that was based on a rainbow trout resource designed by Yao and colleagues [39] was enriched with oligonucleotides designed from recent trout NGS data (http://ngspipelines-sigenae.toulouse.in-ra.fr:9064/). Microarray data sets have been submitted to the GEO-NCBI with the accession number: GSE91048.
Data acquisition and analysis
After hybridisation, the slides were rinsed and scanned at a 3μm resolution with the Agilent DNA Microarray Scan-ner. Fluorescence intensity was calculated using the stand-ard procedures found in the Agilent Feature Extraction (FE) software version 10.7.3.1. The arrays were normalised (scale normalisation) and log-transformed using Gene-Spring software (version 12.6.1). An ANOVA analysis (Benjamini-Hochberg (BH) corrected pval < 0.05) was used to determine the genes that were differentially expressed between feeding conditions. Gene expression
profiles were used to classify genes and biological samples using a hierarchical clustering method using CLUSTER software and the results were visualised with TREEVIEW [40]. GO enrichment analysis was performed using Data-base for annotation, Visualisation and integrated Discov-ery (DAVID 6.7) software tools [41, 42].
Additional files
Additional file 1: Heat map file for Java treeview visualisation of hierarchical clustering of differentially expressed genes in muscle during a fasting-refeeding schedule and in control-fed trout displaying usual growth (CDT 1214 kb)
Additional file 2: Major functional categories of cluster IIa and lists of genes that formed them (XLSX 16 kb)
Additional file 3: Major functional categories of cluster IIb and lists of genes that formed them (XLSX 59 kb)
Abbreviations
DAVID:Database for Annotation, Visualization and Integrated Discovery; DNA: DesoxyriboNucleic acid; NCBI: National Center for Biotechnology Information; RNA: RiboNucleic acid GO: Gene ontology
Acknowledgements
We would like to thank Lionel Goardon and Laurent Labbé (PEIMA-INRA, Sizun, France) for advices, fish rearing and sampling, the INRA-SIGENAE group for bioinformatics support and Dr. Jérôme Bugeon for helpful discussion. Funding
The research leading to these results received funding from the French National Research Agency (ANR08 GENM 035 01). The funding body did not play a role in the design of the study and collection, analysis, and interpretation of data and in in writing the manuscript.
Availability of data and materials
Gene expression data supporting the results of this article are available in the Gene Expression Omnibus (GEO) repository under the accession number: GSE91048.
Authors’ contributions
PYR conceived and supervised the study. AL and CR performed the experiments. JM and PYR analysed the data. PYR wrote the paper. All authors read and approved the final manuscript.
Competing interests
The authors declare that they have no competing interests. Consent for publication
Not applicable.
Ethics approval and consent to participate
Trout used in this study derived from PEIMA which is an experimental unit for research on salmonids (PEIMA: http://www6.rennes.inra.fr/peima_eng/ ABOUT-PEIMA). Fish were reared and handled in strict accordance with French and European policies and guidelines of the INRA PEIMA Institutional Care and Use committee (B29272) which approved this study.
Publisher’s Note
Springer Nature remains neutral with regard to jurisdictional claims in published maps and institutional affiliations.
Received: 2 January 2017 Accepted: 1 June 2017
References
1. Braun T, Gautel M. Transcriptional mechanisms regulating skeletal muscle differentiation, growth and homeostasis. Nat Rev Mol Cell Biol. 2011;12:349–61. 2. Rowlerson A, Veggetti A. Cellular mechanisms of post-embryonic muscle
growth in aquaculture species. In: Johnston IA, editor. Muscle development and growth, fish physiology series, vol. 18. San Diego: Academic; 2001. p. 103–40. 3. Johnston IA, Bower NI, Macqueen DJ. Growth and the regulation of
myotomal muscle mass in teleost fish. J Exp Biol. 2011;214:1617–28. 4. Hollway GE, Bryson-Richardson RJ, Berger S, Cole NJ, Hall TE, Currie PD.
Whole somite rotation generates muscle progenitor cell compartments in the developing embryo. Dev Cell. 2007;12:207–19.
5. Stellabotte F, Dobbs-McAuliffe B, Fernandez DA, Feng X, Devoto SH. Dynamic somite cell rearrangements lead to distinct waves of myotome growth. Development. 2007;134:1253–7.
6. Steinbacher P, Stadlmayr V, Marschallinger J, Sänger AM, Stoiber W. Lateral fast muscle fibers originate from the posterior lip of the teleost dermomyotome. Dev Dyn. 2008;237:3233–9.
7. Rescan PY, Rallière C, Lebret V, Fretaud M. Analysis of muscle fibre input dynamics using a myog:GFP transgenic trout model. J Exp Biol. 2015;218: 1137–42.
8. Montfort J, Le Cam A, Gabillard JC, Rescan PY. Gene expression profiling of trout regenerating muscle reveals common transcriptional signatures with hyperplastic growth zones of the post-embryonic myotome. BMC Genomics. 2016;17:810.
9. Bryson-Richardson RJ, Currie PD. The genetics of vertebrate myogenesis. Nat Rev Genet. 2008;9:632–946.
10. Ali M, Nicieza A, Wootton RJ. Compensatory growth in fishes: a response to growth depression. Fish Fish. 2003;4:147–90.
11. Jobling M, Johansen JS. The lipostat, hyperphagia and catch-up growth. Aquac Res. 1999;30:473–8.
12. Hayward RS, Noltie DB, Wang N. Use of compensatory growth to double hybrid sunfish growth rate. Trans Am Fish Soc. 1997;126:316–22.
13. Zue X, Xie S, Lei W, Cui Y, Yang Y, Wootton RJ. Compensatory growth in the Chinese longsnout catfish, Leiocassislongirostris following feed deprivation: temporal patterns in growth, nutrient deposition, feed intake and body composition. Aquaculture. 2005;248:307–14.
14. Rescan PY, Montfort J, Rallière C, Le Cam A, Esquerré D, Hugot K. Dynamic gene expression in fish muscle during recovery growth induced by a fasting-refeeding schedule. BMC Genomics. 2007;8:438.
15. Rescan PY, Montfort J, Fautrel A, Rallière C, Lebret V. Gene expression profiling of the hyperplastic growth zones of the late trout embryo myotome using laser capture microdissection and microarray analysis. BMC Genomics. 2013;14:173.
16. Hector KL, Nakagawa S. Quantitative analysis of compensatory and catch-up growth in diverse taxa. J Anim Ecol. 2012;81:583–93.
17. Krauss RS, Cole F, Gaio U, Takaesu G, Zhang W, Kang JS. Close encounters: regulation of vertebrate skeletal myogenesis by cell-cell contact. J Cell Sci. 2005;118:2355–62.
18. Srinivas BP, Woo J, Leong WY, Roy S. A conserved molecular pathway mediates myoblast fusion in insects and vertebrates. Nat Genet. 2007;39:781–6. 19. Powell GT, Wright GJ. Jamb and jamc are essential for vertebrate myocyte
fusion. PLoS Biol. 2011;12:e1001216.
20. Jobling M. Are compensatory growth and catch-up growth two sides of the same coin? Aquac Int. 2010:501–10.
21. Gabillard JC, Kamangar BB, Montserrat N. Coordinated regulation of the GH/ IGF system genes during refeeding in rainbow trout (Oncorhynchus mykiss). J Endocrinol. 2006;191:15–24.
22. Cleveland BM, Weber GM. Effects of triploidy on growth and protein degradation in skeletal muscle during recovery from feed deprivation in juvenile rainbow trout (Oncorhynchus mykiss). Comp Biochem Physiol A Mol Integr Physiol. 2013;166:128–37.
23. Fox BK, Breves JP, Davis LK, Pierce AL, Hirano T, Grau EG. Tissue-specific regulation of the growth hormone/insulin-like growth factor axis during fasting and re-feeding: Importance of muscle expression of IGF-I and IGF-II mRNA in the tilapia. Gen Comp Endocrinol. 2010;166:573–80.
24. Brodeur JC, Peck LS, Johnston IA. Feeding increases MyoD and PCNA expression in myogenic progenitor cells ofNotothenia coriiceps. JFish Biol. 2002;60:1475–85.
25. He L, Pei Y, Jiang Y, Li Y, Liao L, Zhu Z, et al. Global gene expression patterns of grass carp following compensatory growth. BMC Genomics. 2015;16:184. 26. Nakada S, Ogasawara R, Kawada S, Maekawa T, Ishii N. Correlation between
ribosome biogenesis and the magnitude of hypertrophy in overloaded skeletal muscle. PLoS One. 2016;11:e0147284.
27. Chaillou T, Kirby TJ, McCarthy JJ. Ribosome biogenesis: emerging evidence for a central role in the regulation of skeletal muscle mass. J Cell Physiol. 2014;229:1584–94.
28. Du SJ, Li H, Bian Y, Zhong Y. Heat-shock protein 90 alpha1 is required for organized myofibril assembly in skeletal muscles of zebrafish embryos. Proc Natl Acad Sci U S A. 2008;105:554–9.
29. Huey KA, Burdette S, Zhong H, Roy RR. Early response of heat shock proteins to functional overload of the soleus and plantaris in rats and mice. Exp Physiol. 2010;95:1145–55.
30. Senf SM, Howard TM, Ahn B, Ferreira LF, Judge AR. Loss of the inducible Hsp70 delays the inflammatory response to skeletal muscle injury and severely impairs muscle regeneration. PLoS One. 2013;8:e62687. 31. Seiden D. Quantitative analysis of muscle cell changes in compensatory
hypertrophy and work-induced hypertrophy. Am J Anat. 1976;145:459–65. 32. Palstra AP, Rovira M, Rizo-Roca D, Torrella JR, Spaink HP, Planas JV.
Swimming-induced exercise promotes hypertrophy and vascularization of fast skeletal muscle fibres and activation of myogenic and angiogenic transcriptional programs in adult zebrafish. BMC Genomics. 2014;15:1136. 33. Buckingham M, Rigby PW. Gene regulatory networks and transcriptional
mechanisms that control myogenesis. Dev Cell. 2014;28:225–38. 34. Johansen KA, Overturf K. Alterations in expression of genes associated with
muscle metabolism and growth during nutritional restriction and refeeding in rainbow trout. Comp Biochem Physiol B Biochem Mol Biol. 2006;144:119–27. 35. Toto PC, Puri PL, Albini S. SWI/SNF-directed stem cell lineage specification:
dynamic composition regulates specific stages of skeletal myogenesis. Cell Mol Life Sci. 2016;73:3887–96.
36. Bedford MT, Clarke SG. Protein arginine methylation in mammals: who, what, and why. Mol Cell. 2009;33:1–13.
37. Chen SL, Loffler KA, Chen D, Stallcup MR, Muscat GE. The coactivator-associated arginine methyltransferase is necessary for muscle differentiation: CARM1 coactivates myocyte enhancer factor-2. J Biol Chem. 2002;277:4324–33. 38. Dacwag CS, Ohkawa Y, Pal S, Sif S, Imbalzano AN. The protein arginine
methyltransferase Prmt5 is required for myogenesis because it facilitates ATP-dependent chromatin remodelling. Mol Cell Biol. 2007;27:384–94. 39. Salem M, Kenney PB, Rexroad CE III, Yao J. Development of a 37 k
high-density oligonucleotide microarray: a new tool for functional genome research in rainbow trout. J Fish Biol. 2008;72:2187–206.
40. Eisen MB, Spellman PT, Brown PO, Botstein D. Cluster analysis and display of genome-wide expression patterns. Proc Natl Acad Sci U S A. 1998;95:14863–8. 41. Huang DW, Sherman BT, Lempicki RA. Systematic and integrative analysis of
large gene lists using DAVID bioinformatics resources. Nat Protoc. 2009;4:44–57. 42. Huang DW, Sherman BT, Lempicki RA. Bioinformatics enrichment tools:
paths toward the comprehensive functional analysis of large gene lists. Nucleic Acids Res. 2009;37:1–13.
• We accept pre-submission inquiries
• Our selector tool helps you to find the most relevant journal
• We provide round the clock customer support
• Convenient online submission
• Thorough peer review
• Inclusion in PubMed and all major indexing services
• Maximum visibility for your research Submit your manuscript at
www.biomedcentral.com/submit