HAL Id: inserm-00145721
https://www.hal.inserm.fr/inserm-00145721
Submitted on 11 May 2007
HAL is a multi-disciplinary open access
archive for the deposit and dissemination of
sci-entific research documents, whether they are
pub-lished or not. The documents may come from
teaching and research institutions in France or
abroad, or from public or private research centers.
L’archive ouverte pluridisciplinaire HAL, est
destinée au dépôt et à la diffusion de documents
scientifiques de niveau recherche, publiés ou non,
émanant des établissements d’enseignement et de
recherche français ou étrangers, des laboratoires
publics ou privés.
Cardiovascular risk factor levels and their relationships
with overweight and fat distribution in children: the
Fleurbaix Laventie Ville Santé II study.
Jérémie Botton, Barbara Heude, Adrien Kettaneh, Jean-Michel Borys, Agnès
Lommez, Jean-Louis Bresson, Pierre Ducimetière, Marie-Aline Charles
To cite this version:
Jérémie Botton, Barbara Heude, Adrien Kettaneh, Jean-Michel Borys, Agnès Lommez, et al..
Car-diovascular risk factor levels and their relationships with overweight and fat distribution in
chil-dren: the Fleurbaix Laventie Ville Santé II study.. Metabolism, Elsevier, 2007, 56 (5), pp.614-22.
�10.1016/j.metabol.2006.12.006�. �inserm-00145721�
Cardiovascular risk factors levels and their relationships with overweight
and fat distribution in children. The Fleurbaix Laventie Ville Santé
II
study.
From the INSERM U780-IFR69 “Recherche en Epidémiologie et Biostatistique”, Villejuif, France
Jérémie Botton1,2, Barbara Heude1,2, Adrien Kettaneh1,2, Jean-Michel Borys3, Agnès Lommez3, Jean-Louis Bresson4,5, Pierre Ducimetiere1,2, Marie-Aline Charles1,2 and the FLVS study group3.
1
INSERM Unité 780-IFR69, Villejuif, France
2Univ Paris Sud, Villejuif, France
3Fleurbaix Laventie Ville Santé Association, Laventie, France 4INSERM CIC930, Hôpital Necker-Enfants Malades, Paris, France 5
Univ Paris V, Paris, France
Mailing address:
M. Jérémie Botton
INSERM U780 “Recherche en Epidémiologie et Biostatistique” 16 avenue Paul Vaillant-Couturier
94807 Villejuif Cedex FRANCE
ABSTRACT
Objectives: To document for the first time in a general population of French children, the prevalence and levels
of cardiovascular risk factors, and to assess, separately in boys and girls, whether these risk factors were associated with fat mass distribution independently of subcutaneous overall adiposity.
Subjects and design: A cross sectional analysis of baseline data from 452 children (235 boys and 217 girls)
aged 8-17 years included in 1999 in a population-based epidemiologic study, the Fleurbaix Laventie Ville Santé II (FLVS II) study.
Methods: Overweight was defined according to the International Obesity Task Force (IOTF) references and to
the 90th percentiles of the French BMI curves. The thresholds of parameters defining cardiovascular and metabolic risk were the 95th percentile of the Task Force Report on High Blood Pressure in Children and
Adolescents for blood pressure, and those of the American Academy of Pediatrics for lipids. Anthropometric and biologic parameters were described by gender and according to overweight. Partial correlations between
cardiovascular risk factors and anthropometric measures of adiposity (BMI, sum of four skinfold thicknesses, waist circumference, waist-to-height ratio) were calculated. In a second step, these correlations were additionally adjusted for the sum of four skinfold thicknesses.
Results: High plasma triglycerides, high insulin concentration and low plasma HDL cholesterol were associated
with all measures of adiposity (|r|≥0.20; p<0.002). When obese children were excluded, overweight children already had high triglycerides and low HDL cholesterol levels respectively 2 and 20 times more frequently than normal weight children. Among overweight children, 7.7% had at least two risk factors among high blood pressure, high plasma triglycerides or glucose, and low HDL concentrations, versus 0.25% among normal weight children (p=0.002). After adjusting for the sum of skinfolds, an independent association between the risk factors and waist circumference was found in girls.
Conclusions: (a) Modest excess weight is associated with increased levels of cardiovascular risk factors. (b) In girls, abdominal fat distribution is associated with cardiovascular risk factors, independently of overall adiposity. (c) International definition of abdominal obesity in children is required to standardize studies and progress in the evaluation of childhood obesity and its consequences.
Introduction
The prevalence of adult obesity has been increasing in France in the last two decades (1), as well as in other industrialized countries (2, 3). Relationships between obesity and cardiovascular and metabolic risk factors (4, 5) and between obesity and mortality (6, 7) have been unequivocally established in adults. Both the total amount of fat and its distribution contribute to these relationships: increased abdominal fat is clearly associated with cardiovascular risk factors in adults (8-11).
Overweight and obesity prevalences are also increasing in children worldwide (12-14), and France is not spared (15, 16). Moreover, the recent increase in mean Body Mass Index (BMI) in children has been reported to be accompanied by an even steeper increase in waist circumference (17), an acceptable surrogate marker for abdominal fat mass. In children, an increase in abdominal fat mass is also associated with increased levels of cardiovascular risk factors (18, 19) and waist circumference could be better than BMI to identify children susceptible to develop cardiovascular diseases in adulthood (20, 21). Few studies have tested whether abdominal fat is associated with cardiovascular risk factors irrespective of the total amount of fat in children (22, 23). None of these studies analyzed genders separately.
Our first aim was to report the prevalence of high levels of cardiovascular risk factors in association with overweight, as defined by the IOTF (24), in a sample of French non-obese children aged 8-17 years from the general population. The prevalence of the cluster of cardiovascular risk factors included in the National Cholesterol Education Program (NCEP) definition of the metabolic syndrome in adults (i.e. plasma blood glucose, triglycerides, HDL cholesterol concentration and blood pressure) was also evaluated. Our second aim was to assess, for the first time separately in boys and girls, whether cardiovascular risk factors are associated with childrens’ abdominal fat mass, independently of subcutaneous fat mass, as already shown in adults.
Population and methods
Population
The children were recruited in 1992 in Fleurbaix and Laventie, two neighbouring towns in northern France, with 2488 and 4426 inhabitants respectively, when the Fleurbaix-Laventie Ville Santé (FLVS) study started. The first part of the study, FLVS I, was a five-year follow-up of children involved in a nutritional education program which recruited all families with at least one child in the classes from the last section of preschool to the last section of primary school (25).
The second part, FLVS II, is an epidemiological study on the determinants of weight change in the population. This study was proposed in 1999 to every family who participated in the FLVS I study. We recruited and examined 294 families among the 393 families still living in the two towns who could be contacted
(acceptance rate: 75%). All family members aged 8 years and over (1113 participants including 251 girls and 256 boys aged 8 to 17 years) were examined in their homes in 1999. The FLVS II study was reviewed by an ethics committee (CCPPRB Lille, France). Confidentiality of data complied with French regulations (Loi Informatique et Liberté). Prior to entering the study, a written consent was obtained from participants and from their parents for those younger than 18 years.
This article uses cross-sectional data collected from children, when they were included in the FLVS II study in 1999. The 34 girls and 21 boys who had at least one missing parameter in anthropometric, blood pressure or biological measurements were excluded from all analyses. They were younger (12.7 2.8 vs 13.6 2.5 years; p=0.01) and after age-adjustment, boys were shorter (152 18 vs 161 15 cm; p=0.007) than those with complete data. None of the other parameters was significantly different between excluded and non-excluded children. Most of the missing values (62%) concerned biological parameters. Missing blood samples were more often refused by the younger children, and this partly accounts for this age difference. Thus, the present report concerns 217 girls and 235 boys.
Measurements
Trained physicians collected anthropometric data. Weight was measured in light clothes and without shoes to the nearest 0.1 kg, and height to the nearest cm. Waist circumference (WC) was measured to the nearest 0.5 cm, during expiration, when breathing normally, at the smallest diameter between iliac crest and the lower rib. The thickness of four skinfolds was measured to the nearest 0.1 mm, in duplicate, using Harpenden callipers, on the left side of the body: tricipital (posterior aspect of the arm, at the midpoint between the acromion and the olecranon), bicipital (anterior aspect of the arm, at the midpoint between the acromion and the olecranon),
subscapular (1 cm below the inferior angle at the scapula) and supra-iliac (1 cm over the iliac crest, at the midaxillary line). The duplicate measures were averaged. The sum of skinfolds and body mass index (BMI=weight/height2, kg/m2) were calculated. As waist circumference is positively correlated with height in children after taking age and Tanner stage into account (r=0.30 in our population), a waist-to-height ratio was also calculated as previously suggested (26). Pubertal stage was determined according to Tanner's classification (27).
A 20 mL blood sample was obtained after an overnight fast for the measurement of total and HDL cholesterol, triglycerides, glucose and insulin concentrations (Bi-Insulin IRMA, Kit Sanofi Pasteur, France). LDL cholesterol was calculated from Friedwald's estimation (28). Systolic (SBP) and diastolic (DBP) blood pressure were measured using an automatic device (Omron 705CT) with an adapted cuff, on the right arm, after approximately five minutes of rest in a sitting position. Three measurements at two-minute intervals were recorded and averaged.
Definitions / Cutoff points
We used recommended cutoff points, whenever specific recommendations were made for higher values in children.
Overweight and obesity were defined according to the IOTF gender- and age- specific BMI cutoffs (24). For comparison with other French data, we also used the 97th percentiles of the French BMI reference curves for age and gender to define F-Overweight (29).
The 95th percentiles of age-, gender- and height- SBP and DBP reference curves established by the US National High Blood Pressure Education Program (NHBPEP) defined high blood pressure (HBP) (30). High blood lipid concentrations were defined according to the American Academy of Pediatrics’ recommendations for children: thresholds of 5.2 mmol/L (2.0 g/L) for total cholesterol, 3.4 mmol/L (1.3 g/L) for LDL cholesterol and 0.9 mmol/L (0.35 g/L) for HDL cholesterol (31). We chose the threshold of 1.5 mmol/L (1.3 g/L) for
triglycerides. It corresponds to the 95th percentile during the second decade of life (32). Fasting plasma glucose higher than 6.1 mmol/L (1.10 g/L) was considered as impaired fasting glucose, according to the Expert Committee on the Diagnosis and Classification of Diabetes Mellitus (33).
Data analysis
Results are given as arithmetic mean standard deviation, geometric mean ×/÷ geometric standard deviation for log-transformed variables or percentage (number). BMI and sum of skinfold were log-transformed
as were total and LDL cholesterol, triglycerides, plasma glucose and insulin. All comparisons between genders or weight status groups used Student’s, Chi-square or exact Fisher tests as appropriate. Analysis of covariance used general linear models.
Quantitative analyses were performed separately in boys and girls, because of different patterns between genders and some interactions between anthropometric parameters and gender for the biological parameters. Mean values and prevalences of cardiovascular and metabolic risk factors were compared between normal and overweight children in separate linear or logistic models, with each cardiovascular risk factor as dependant variables, overweight status as a dichotomous explicative variable, with adjustment for gender, age and Tanner stage. As the number of overweight subjects in both genders was small, boys and girls were pooled for this analysis. Obese children were excluded from these comparisons as they were too few to constitute a separate group.
Partial Pearson correlations, adjusted for age and Tanner stage, were calculated between anthropometric variables and cardiovascular risk factors. In a second step, in order to test for an effect of abdominal fat variables (WC and waist-to-height ratio) on cardiovascular risk factors independently of subcutaneous fat mass, they were additionally adjusted for the sum of skinfolds.
Because of the presence of siblings in our study population, analysis had to take into account familial resemblance. In the analysis of quantitative variables, we introduced a nuclear family variable as a random effect in a linear mixed model. The partial correlation coefficient between two variables X1 and X2 was obtained by the Pearson correlation between the residuals of the regressions of X1 and X2 on the adjustment factors which included a random effect for the nuclear family variable (34).
SAS Software version 8.2 was used for all analyses. All significance tests were two-sided and a probability value less than 0.05 was considered significant.
Results
Descriptive characteristics
The children study had a mean age of 13.6 years, with no difference between boys and girls (Table 1). More girls (21%) than boys (14%) had reached Tanner stage 5. The sum of skinfold thicknesses was higher in girls than boys (p<0.0001). WC was significantly larger in boys (p<0.0001), but the waist-to-height ratios were similar (p=0.36). BMI was not significantly different between genders; around 10% of children were overweight or obese according to the IOTF definition and 9% according to the French definition.
Triglycerides were slightly, but significantly higher in girls (0.66 ×/÷ 1.50 vs 0.74 ×/÷ 1.45 mmol/L; p=0.003), as were LDL and total cholesterol (p<0.0001 for both); however, HDL cholesterol concentration was similar in boys and girls (p=0.55). Plasma glucose concentration was slightly higher in boys than in girls (4.76 ×/÷ 1.08 vs 4.65 ×/÷ 1.09 mmol/L; p=0.001) and plasma insulin was lower (p=0.002). SBP but not DBP was significantly higher in boys. High blood pressure was not significantly different even if more prevalent in boys (5.5% vs 3.2%; p=0.25).
Cardiovascular risk factors and overweight
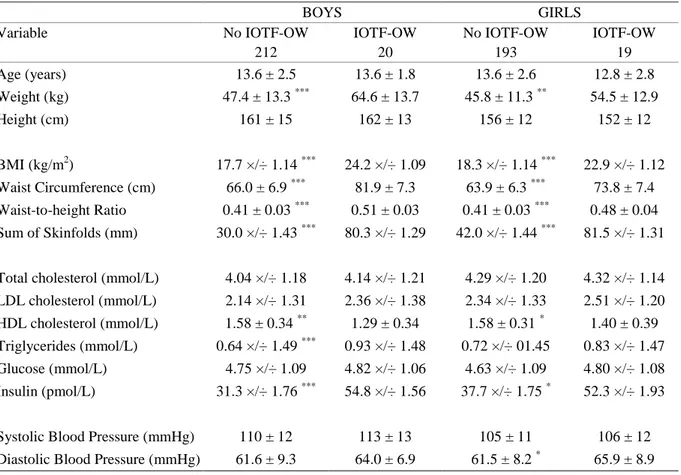
Mean values of cardiovascular and metabolic risk factors and anthropometric parameters are presented by gender and according to IOTF BMI cutoffs (excluding obesity) in Table 2. Mean height was not significantly different between BMI groups and, as expected, all others anthropometric parameters were higher in overweight children. In both genders, HDL cholesterol was significantly lower and triglycerides and insulin significantly higher in IOTF-overweight children. Glucose and total or LDL cholesterol were not significantly different according to the overweight status in either gender.
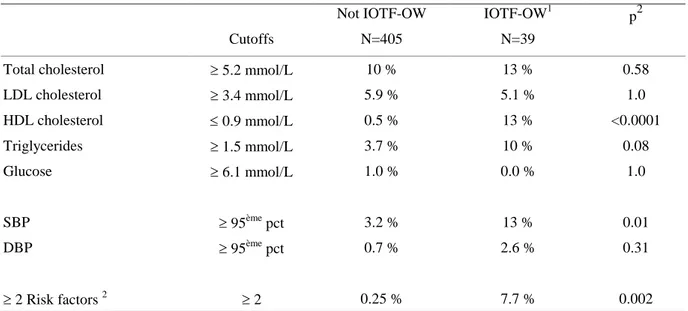
The percentages of children with high levels of cardiovascular risk factors (as defined in the “population and methods” section) are presented according to IOTF overweight in Table 3, both genders pooled. The most striking difference between normal and overweight children was for low HDL cholesterol which reached 13% in IOTF-Overweight children versus 0.5% in normal weight children (p<0.0001). High SBP was more prevalent in overweight children (13% in IOTF-Overweight vs 3.2% in normal weight; p=0.01). Prevalences of other risk factors tended to be higher in overweight children, but the differences did not reach significance. Only four children had at least two of the biological cardiovascular risk factors of the adult NCEP definition of the metabolic syndrome exceeding the thresholds adapted to children: one with normal weight (0.25 %) versus three overweight (7.7 %; p=0.002).
Correlations between anthropometric measurements and cardiovascular risk factors
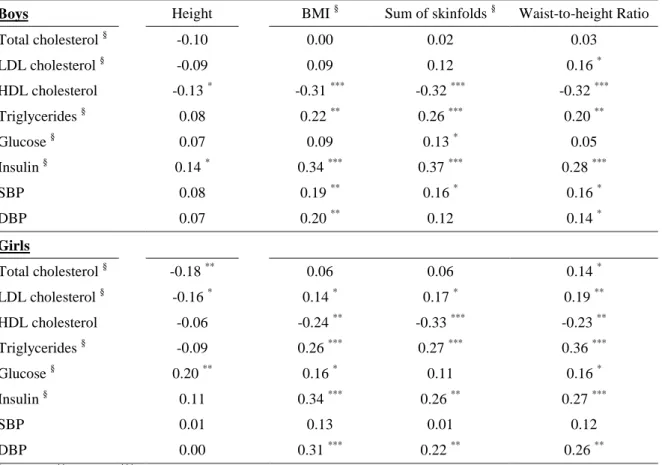
Pearson correlation coefficients between anthropometric variables and cardiovascular risk factors adjusted for age and Tanner stage are presented in Table 4, and in Figure 1 for those between WC and cardiovascular risk factors.
Height was correlated with HDL cholesterol (r=-0.13) and insulin (r=0.14) in boys and with total cholesterol, LDL cholesterol and plasma glucose in girls (r=-0.18, r=-0.16 and r=0.20 respectively). Among the cardiovascular risk factors, HDL cholesterol, triglycerides and insulin concentration (|r|≥0.20; p<0.002) were strongly correlated with all other anthropometric parameters in boys and girls. Although correlations with LDL cholesterol were lower, significant coefficients were observed with sum of skinfolds (r=0.17) and BMI (r=0.14) in girls and with waist-to-height ratio in both genders (r=0.16 in boys and 0.19 in girls). Total cholesterol was not significantly correlated with the anthropometric parameters, except with the waist-to-height ratio in girls (r=0.14). Plasma glucose concentration was correlated with all the anthropometric parameters in girls, but not significantly so with sum of skinfolds. In boys however, there was a weak relationship with sum of skinfolds only (r=0.13; p=0.05). Both SBP (range: 0.16-0.19) and DBP (range: 0.12-0.20) were correlated with almost all of the anthropometric variables in boys (correlations were not significant between DBP and sum of skinfolds), whereas only DBP was significantly associated with adiposity in girls (range: 0.22-0.31).
Additional adjustment for the sum of skinfolds
The Figure 1 presents the correlations coefficients between WC and the cardiovascular risk factors adjusted for age and Tanner stage, with and without an additional adjustment for the sum of skinfolds. Correlations between waist-to-height ratio and cardiovascular risk factors are only cited when different from those with WC.
Most of the cardiovascular risk factors were significantly correlated with waist circumference in girls as in boys, except total and LDL cholesterol in both genders, glucose in boys and SBP in girls. The stronger correlations were observed between WC and HDL cholesterol (r=-0.36) and insulin concentration (r=0.33) in boys, and with triglycerides (r=0.30) and insulin concentration in girls (r=0.32).
In boys, once subcutaneous fat mass was accounted for, none of the relationships with cardiovascular risk factors remained significant, except for HDL cholesterol which was still negatively associated with WC (r=-0.18; p=0.005), but not with waist-to-height ratio (r=-0.12; p=0.07).
In girls, correlations remained significant between WC and triglycerides (r=0.15), glucose (r=0.24), insulin concentration (r=0.17), and was increased with SBP (r=0.14; p=0.04). The strong correlation between
waist-to-height ratio and triglycerides persisted (r=0.24; p=0.0003), but the waist-to-height ratio was no longer significantly associated with plasma glucose concentration (r=0.11; p=0.10).
Finally, the very strong correlation between insulin concentration and WC or waist-to-height ratio disappeared after adjusting for subcutaneous adiposity in boys (r=0.33 to 0.07 and r=0.28 to -0.02 respectively), and decreased in girls (r=0.32 to 0.17 and r=0.27 to 0.08 respectively).
Discussion
In our population of healthy French children, the cardiovascular risk factors most strongly associated with overweight or adiposity parameters were fasting plasma triglycerides, insulin concentrations and blood pressure (positively) and plasma HDL cholesterol concentration (negatively). After adjusting for subcutaneous fat, an association between these risk factors and abdominal fat distribution persisted for triglycerides and blood pressure in girls only, but mostly disappeared for insulin concentration.
A limitation of our study is that adiposity was assessed with anthropometric measurements, which are less accurate than Dual X-ray Absorptiometry (DEXA). However, DEXA is not applicable to large
epidemiological studies. Moreover, waist circumference is considered as an appropriate marker of abdominal obesity in children (22), and the sum of skinfolds, a good indicator of overall adiposity (35-37). Furthermore, our sample is not representative of the French children population. Indeed, the included children lived in two towns in northern France. They underwent a special nutritional education program at school during five years and accepted to participate in a longitudinal epidemiological study (25). The prevalence of overweight (including obesity) was around 10% whereas it was closer to 15% in contemporary samples of French children (16, 38). This relatively low prevalence is probably due to the low participation rate of the overweight children in the longitudinal FLVS II study compared to the FLVS I (8.0 vs 13.5 %), rather than to the effect of the nutritional education program. Indeed, we documented a rise in mean BMI and in the prevalence of obesity in girls in cross-sectional studies of 5-12 year-old children performed before and 8 years after the beginning of the program in the schools (15). To our knowledge, no other descriptive report on cardiovascular risk factors in overweight French children has been published so far. Because of these limitations, we believe that our reported prevalences and correlations represent a minimal estimate of the true situation
.
We can therefore conclude from our study that overweight, as defined by IOTF, is associated with biological signs of insulin resistance and its associated dyslipidemia. The prevalence of clustered risk factors is low in the overweight non-obese children. Only four children in the overall overweight non-obese population presented two or more of the metabolic syndrome risk factors (0.90%), three among the overweight children (7.7%). A German study of overweight children also found noticeable prevalences of dyslipidemia with figures even higher than in our population; 16% for high triglycerides levels (defined as > 1.7 mmol/L) and 17% for low HDL cholesterol (39). However, these children were selected in obesity centers and had probably a mean BMI (not reported) higher than our overweight children.
WC was the adiposity parameter most strongly associated with cardiovascular risk factors in our study as in most other studies (19, 21). It has been widely demonstrated that WC is a good predictor of cardiovascular risk factors in adults (40-42), and it is now used in the adult definitions of metabolic syndrome (43). Several studies showed that, in children, WC is also a good anthropometric parameter to evaluate cardiovascular and metabolic risks (20, 21).
Another indicator of abdominal adiposity is waist-to-height ratio. Several studies reported that this was a better indicator of cardiovascular risk factors than BMI or WC itself (20, 44-46), but others have not found any difference (21, 47). In our study, the correlations between the cardiovascular risk factors and WC or waist-to-height ratio were roughly similar. However, total cholesterol in girls and LDL cholesterol in both genders were significantly associated with waist-to-height ratio and not with WC, similar to a previous report (48).
When cardiovascular risk factors were associated with height, correlation pattern between WC or waist-to-height ratio and cardiovascular risk factors were different. This could be a strength of using waist-waist-to-height ratio as a parameter less influenced by height. After taking age and Tanner stage into account, WC was still closely related to height in our population (r=0.30; p<0.0001). Moreover, WC was dependent on age and gender, whereas waist-to-height ratio was not, as shown in another study (21). Hence, as suggested before (40), and confirmed more recently (48), one particular advantage of the waist-to-height ratio might be that effects, independent of age, sex and height could be identified. It may be possible to define a unique cutoff for all children to define high WC whatever the age and gender. For example, Ho et al. suggested that in adults, a simple message that one’s WC should not exceed half the stature could be recommended to the public (49). This threshold has already been used in a population of young adult students (50). This parameter should be validated in large cohorts of children as a simple measurement allowing the screening of children at risk for cardiovascular diseases.
It is still not clear whether the effects of abdominal fat on cardiovascular risk factors are independent of the effects of total body fat (51). We evaluate in our study whether WC was associated to cardiovascular risk factors independently of subcutaneous fat mass level in children. Other studies have looked at the differential relationship of fat localization measures and cardiovascular risk factors. One such study found that trunk skinfolds predicted cardiovascular disease risk factors to the same extent as total fat mass by DXA, and in some cases independently of total fatness (23). In another study, authors included both the percent body fat and fat distribution in a stepwise multiple linear regression analysis and found that fat distribution was a more important
independent correlate of cardiovascular risk factors (high triglycerides, low HDL cholesterol, high systolic blood pressure, high left ventricular mass) than percent fat mass (52).
These two studies did not perform analyses separately according to gender, whereas we consider that it was more appropriate. Indeed, boys and girls present quite different growth pattern in fat mass, lean mass and fat distribution especially during puberty. Even in our relatively small population, some interactions were significant between anthropometric parameters and gender in relation with some biological parameters (e.g. in the relation between waist-to-height ratio and triglycerides: p=0.02).
The associations found only in girls between waist circumference parameters and cardiovascular risk factors after taking the sum of skinfolds into account were primarily surprising. A central fat distribution is considered as a male specific pattern and an explanation for the high prevalence of cardiovascular disease in men compared to women (53). We hypothesized that the fat distribution is more homogeneously centrally distributed in boys and its effect on cardiovascular risk factors would not be distinguished from that of subcutaneous fat mass. Conversely in girls, there is more variability in the fat distribution, from a gynoid to an android pattern, for a given level of total fat mass. However, we only found a slightly higher correlation between waist
circumference and sum of four skinfolds in boys (r=0.83) than in girls (r=0.68).
One particular result from our study was that the very high positive correlations between anthropometric parameters and insulin concentration disappeared after the adjustment for subcutaneous fat mass, suggesting that subcutaneous fat mass has a role in the relation between abdominal fat distribution and hyperinsulinaemia in these children. Furthermore, plasma glucose was more correlated with anthropometric parameters in girls than in boys. This may be in agreement with the higher prevalence of type 2 diabetes in adolescent girls than in adolescent boys (54).
Conclusion
In conclusion, modest excess weight, using the IOTF definition of overweight, is associated with higher levels of metabolic markers of insulin resistance in boys and girls. In girls only, some metabolic factors were significantly related to the fat distribution independently of the overall amount of fat. An international definition of abdominal obesity in children is required to standardize studies and so that the consequences of childhood obesity can be evaluated and prevented. Our study is important to consider in the context of the increase of obesity and particularly the associated increase in waist circumference in women. How it could affect in the long term the relative protection of women against cardiovascular diseases remains to be determined.
Acknowlegements
We thank Laboratoires Knoll, CEDUS, Groupe Fournier, Lesieur, Nestlé France, Produits Roche and TEPRAL for their support to the Fleurbaix Laventie Ville Santé Studies.
We thank the parents and their children who agreed to participate into the study.
Marie-Aline Charles received grants from the “Association de Langue Française pour l’étude des diabètes et du métabolisme” (ALFEDIAM) and from the “Mutuelle Generale de l’Education Nationale” (MGEN)
No conflict of interest statement.
Members of the Fleurbaix Laventie Ville Santé Group
Arnaud Basdevant, Jean-Michel Borys, Jean-Louis Bresson, Marie-Aline Charles, Pierre Ducimetière, Philippe Froguel, Barbara Heude, Agnes Lommez, Jean-Michel Oppert, Monique Romon.
Table 1: Characteristics by gender1 Boys Girls p2 n=235 n=217 General characteristics Age (years) 13.6 2.4 13.6 2.6 0.87 Tanner stage 1 19 % (45) 18 % (39) 0.10 2 20 % (47) 12 % (26) 3 19 % (45) 21 % (45) 4 28 % (65) 28 % (62) 5 14 % (33) 21 % (45) Weight (kg) 49 15 47 13 0.0002 Height (cm) 161 15 156 12 <0.0001 Adiposity parameters BMI (kg/m2) 18.3 ×/÷ 1.17 18.8 ×/÷ 1.17 0.24 Sum of the 4 mean skinfolds (mm) 33.2 ×/÷ 1.61 45.5 ×/÷ 1.53 <0.0001 Waist circumference (cm) 67.7 8.8 65.2 7.6 <0.0001 Waist-to-height ratio 0.42 ± 0.04 0.42 0.04 0.36 F3-Normal 91 % (214) 92 % (199) 0.79 F-Overweight 9 % (21) 8 % (18) IOTF4-Normal 90 % (212) 89 % (193) 0.68 IOTF-Overweight 8 % (20) 9 % (19) IOTF-Obese 1 % (3) 2 % (5)
Cardiovascular and metabolic risk factors
Total cholesterol (mmol/L) 4.05 ×/÷ 1.19 4.30 ×/÷ 1.20 <0.0001 LDL cholesterol (mmol/L) 2.16 ×/÷ 1.31 2.36 ×/÷ 1.32 <0.0001 HDL cholesterol (mmol/L) 1.55 0.34 1.55 0.34 0.55 Triglycerides (mmol/L) 0.662 ×/÷ 1.50 0.735 ×/÷ 1.45 0.003 Glucose (mmol/L) 4.76 ×/÷ 1.08 4.65 ×/÷ 1.09 0.001 Insulin (pmol/L) 33.1 ×/÷ 1.78 39.3 ×/÷ 1.78 0.002 Systolic blood pressure (mmHg) 110.1 12.0 105.0 11.1 <0.0001 Diastolic blood pressure (mmHg) 61.8 9.0 62.3 8.6 0.79 High blood pressure 5.5 % (13) 3.2 % (7) 0.25
1 Mean standard deviation or geometric mean ×/÷ geometric standard deviation or percentage (number) 2 Student t-test for gender comparisons of quantitative variables or Chi-square test for gender comparisons of
qualitative variables
3 F-Overweight defined as = 97th percentile of the French BMI reference curves 4 Overweight and obesity defined by IOTF cutoff
Table 2: Anthropometric variables and cardiovascular risk factors according to the IOTF overweight status1-2
BOYS GIRLS
Variable No IOTF-OW IOTF-OW No IOTF-OW IOTF-OW
212 20 193 19 Age (years) 13.6 ± 2.5 13.6 ± 1.8 13.6 ± 2.6 12.8 ± 2.8 Weight (kg) 47.4 ± 13.3 *** 64.6 ± 13.7 45.8 ± 11.3 ** 54.5 ± 12.9 Height (cm) 161 ± 15 162 ± 13 156 ± 12 152 ± 12 BMI (kg/m2) 17.7 ×/÷1.14 *** 24.2 ×/÷1.09 18.3 ×/÷1.14 *** 22.9 ×/÷1.12 Waist Circumference (cm) 66.0 ± 6.9 *** 81.9 ± 7.3 63.9 ± 6.3 *** 73.8 ± 7.4 Waist-to-height Ratio 0.41 ± 0.03 *** 0.51 ± 0.03 0.41 ± 0.03 *** 0.48 ± 0.04 Sum of Skinfolds (mm) 30.0 ×/÷1.43 *** 80.3 ×/÷1.29 42.0 ×/÷1.44 *** 81.5 ×/÷1.31
Total cholesterol (mmol/L) 4.04 ×/÷1.18 4.14 ×/÷1.21 4.29 ×/÷1.20 4.32 ×/÷1.14 LDL cholesterol (mmol/L) 2.14 ×/÷1.31 2.36 ×/÷1.38 2.34 ×/÷1.33 2.51 ×/÷1.20 HDL cholesterol (mmol/L) 1.58 ± 0.34 ** 1.29 ± 0.34 1.58 ± 0.31 * 1.40 ± 0.39 Triglycerides (mmol/L) 0.64 ×/÷1.49 *** 0.93 ×/÷1.48 0.72 ×/÷01.45 0.83 ×/÷1.47 Glucose (mmol/L) 4.75 ×/÷ 1.09 4.82 ×/÷1.06 4.63 ×/÷1.09 4.80 ×/÷1.08 Insulin (pmol/L) 31.3 ×/÷1.76 *** 54.8 ×/÷1.56 37.7 ×/÷1.75 * 52.3 ×/÷1.93
Systolic Blood Pressure (mmHg) 110 ± 12 113 ± 13 105 ± 11 106 ± 12 Diastolic Blood Pressure (mmHg) 61.6 ± 9.3 64.0 ± 6.9 61.5 ± 8.2 * 65.9 ± 8.9
1 Mean standard deviation or geometric mean ×/÷ geometric standard deviation
2 IOTF obese were excluded from the comparison because they were too few to constitute a separated group. 3 Student t-test for comparisons between the two groups of overweight status: * p<0.05; ** p<0.01; *** p<0.0001
Table 3: Percentage of children with high level of cardiovascular risk factors according to IOTF overweight (OW) status, girls and boys pooled
Not IOTF-OW IOTF-OW1 p2 Cutoffs N=405 N=39
Total cholesterol 5.2 mmol/L 10 % 13 % 0.58 LDL cholesterol 3.4 mmol/L 5.9 % 5.1 % 1.0 HDL cholesterol 0.9 mmol/L 0.5 % 13 % <0.0001 Triglycerides 1.5 mmol/L 3.7 % 10 % 0.08 Glucose 6.1 mmol/L 1.0 % 0.0 % 1.0 SBP 95ème pct 3.2 % 13 % 0.01 DBP 95ème pct 0.7 % 2.6 % 0.31 2 Risk factors 2 2 0.25 % 7.7 % 0.002
1 IOTF obese were excluded. 2
p-values of a logistic regression with cardiovascular risk factors as dependent variables, OW as explicative variable and gender, age and Tanner stage as adjustment variables.
3 Among those pertaining to the adult definition of the metabolic syndrome (high plasma triglyceride, glucose,
Table 4: Pearson correlation coefficients between cardiovascular and metabolic risk factors and anthropometric parameters, adjusted for age and Tanner stage in boys (N=235) and girls (N=217)
Boys Height BMI § Sum of skinfolds § Waist-to-height Ratio Total cholesterol § -0.10 0.00 0.02 0.03 LDL cholesterol § -0.09 0.09 0.12 0.16 * HDL cholesterol -0.13 * -0.31 *** -0.32 *** -0.32 *** Triglycerides § 0.08 0.22 ** 0.26 *** 0.20 ** Glucose § 0.07 0.09 0.13 * 0.05 Insulin § 0.14 * 0.34 *** 0.37 *** 0.28 *** SBP 0.08 0.19 ** 0.16 * 0.16 * DBP 0.07 0.20 ** 0.12 0.14 * Girls Total cholesterol § -0.18 ** 0.06 0.06 0.14 * LDL cholesterol § -0.16 * 0.14 * 0.17 * 0.19 ** HDL cholesterol -0.06 -0.24 ** -0.33 *** -0.23 ** Triglycerides § -0.09 0.26 *** 0.27 *** 0.36 *** Glucose § 0.20 ** 0.16 * 0.11 0.16 * Insulin § 0.11 0.34 *** 0.26 ** 0.27 *** SBP 0.01 0.13 0.01 0.12 DBP 0.00 0.31 *** 0.22 ** 0.26 ** * p<0.05; ** p<0.01; *** p<0.0001 § Log-transformed variables
-0,40 -0,30 -0,20 -0,10 0,00 0,10 0,20 0,30 0,40
WC in Boys WC in Girls WC in Boys - Adj. for SSK WC in Girls - Adj. for SSK
Total cholesterol LDL cholesterol HDL cholesterol Triglycerides Glucose Insulin SBP DBP
Figure 1: Pearson's correlation between cardiovascular risk factors and waist circumference adjusted for age, and Tanner stage, with and without an additional adjustment for the sum of skinfolds (adj. for SSK) in 235 boys and 217 girls (statistical significance: |r|>0.13)