HAL Id: hal-02566126
https://hal.archives-ouvertes.fr/hal-02566126
Submitted on 6 May 2020
HAL is a multi-disciplinary open access
archive for the deposit and dissemination of sci-entific research documents, whether they are pub-lished or not. The documents may come from teaching and research institutions in France or abroad, or from public or private research centers.
L’archive ouverte pluridisciplinaire HAL, est destinée au dépôt et à la diffusion de documents scientifiques de niveau recherche, publiés ou non, émanant des établissements d’enseignement et de recherche français ou étrangers, des laboratoires publics ou privés.
MnO2 in Mild Aqueous Electrolytes
Mickaël Mateos, Nikolina Makivic, Yee-seul Kim, Benoît Limoges, Véronique
Balland
To cite this version:
Mickaël Mateos, Nikolina Makivic, Yee-seul Kim, Benoît Limoges, Véronique Balland. Accessing the Two-Electron Charge Storage Capacity of MnO2 in Mild Aqueous Electrolytes. Advanced Energy Materials, Wiley-VCH Verlag, 2020, pp.2000332. �10.1002/aenm.202000332�. �hal-02566126�
1
Accessing the two-electron charge storage capacity of MnO
2in
mild aqueous electrolytes
Mickaël Mateos, Nikolina Makivic, Yee-Seul Kim, Benoît Limoges,* Véronique Balland*
Laboratoire d’Electrochimie Moléculaire, Université de Paris, UMR CNRS 7591, 15 rue Jean-Antoine de Baïf, Paris F-75205 cedex 13, France.
E-mail: limoges@u-paris.fr, veronique.balland@u-paris.fr
Abstract
Rechargeable batteries based on MnO2 cathodes, able to operate in mild aqueous electrolytes,
have attracted remarkable attention due to their appealing features for the design of low-cost stationary energy storage devices. However, the charge/discharge mechanism of MnO2 in
such media is still unclear and a matter of debate. Here, an in-depth quantitative spectroelectrochemical analysis of MnO2 thin-films provides a set of important new
mechanistic insights. A major finding is that charge storage occurs through the reversible two-electron faradaic conversion of MnO2 into water-soluble Mn2+ in the presence of a wide range
of weak Brønsted acids, including the [Zn(H2O)6]2+ or [Mn(H2O)6]2+ complexes commonly
present in aqueous Zn/MnO2 batteries. Furthermore, it is evidenced that buffered electrolytes
loaded with Mn2+ are ideal to achieve highly reversible conversion of MnO2 with both high
gravimetric capacity and remarkably stable charging/discharging potentials. In the most favorable case, a record gravimetric capacity of 450 mA·h·g-1 was obtained at a high rate of
1.6 A·g-1, with a coulombic efficiency close to 100% and a MnO2 utilization of 84%. Overall,
the present results challenge the common view on MnO2 charge storage mechanism in mild
aqueous electrolytes and underline the benefit of buffered electrolytes for high-performance rechargeable aqueous batteries.
2
1. Introduction
Over the past few decades, manganese dioxide (MnO2) cathodes attracted increasing
attention due to their low cost, environmental friendliness, high theoretical gravimetric capacity (i.e., 617 mAhg-1 considering the 2 e- transfers from MnIV to MnII), and high reduction potential in water. These features make them attractive for the large scale development of inexpensive, eco-sustainable, and energy-dense rechargeable aqueous batteries, suitable for electricity storage produced from renewable and intermittent energy sources.[1–4] Commonly used primary alkaline batteries, where electrolytic MnO2 is paired
with a zinc anode in a concentrated KOH electrolyte, are well-recognized for their ability to deliver high-energy densities (ranging from 80 to 190 Whkg-1) but can only be discharged once because of irreversible changes in the MnO2 structure.[5] Their discharge is also limited
to the first electron reduction of MnO2 to MnOOH, resulting in a loss of energy density.
Limiting the depth-of-discharge to 5–10% of the maximal capacity of MnO2 was shown as a
valuable strategy to convert primary Zn/MnO2 alkaline batteries into rechargeable ones (over
1,000–3,000 cycles), but at the expense of an energy density reduced to 25-35 Wh.kg-1.[6] It is only recently that a full and reversible access to the two electron capacity of MnO2 has been
demonstrated.[7],[8,9] However, this was achieved for extreme pH values, i.e. either in strongly
basic or acidic electrolytes. Under strong basic conditions (37 wt% KOH), the reversible cycling between MnO2 and Mn(OH)2 was shown with 80-100% utilization of the 617 mAhg -1
over 6 000 cycles.[7] This was made possible thanks to the addition of Bi2O3 and Cu to the
electrode's mix, which both enable the reaction by reducing the charge transfer resistance, preventing the hausmannite (Mn3O4) formation, and favoring the regeneration of MnO2 from
Mn(OH)2.[7] To the other end of the pH scale, reversible cycling between MnO2 and soluble
3
reversible electrodeposition–electrodissolution conversion mechanism.[8,9] Nevertheless, such
extreme pH conditions are not ideal for the design of large-scale energy storage systems, notably because of corrosion issues which reduce the durability of the system and potentially lead to safety concerns. For these reasons, the development of MnO2-based rechargeable
batteries operating under mild aqueous conditions is desirable. This has prompted many groups in the recent years to develop the concept of rechargeable Zn/MnO2 batteries in neutral
or slightly acidic aqueous electrolytes (pH 3-6), containing a few molar ZnSO4 and 0.1–0.3 M
MnSO4.[10–25] While the beneficial effect of adding Mn2+ in the electrolyte was initially shown
in 1998 by Kim and Oh,[26] the demonstration that it can considerably improve the cycling
stability of a Zn/MnO2 battery was only recently reported,[10] allowing to achieve at -MnO2
nanofibers a capacity retention (150 mAhg-1) of 92% over 5 000 cycles. Similar high performances were thereafter reached by other groups with a variety of MnO2 structures and
electrode architectures.[27]
Despite these significant advances, the MnO2 discharge/charge mechanism is still
unclear and a matter of debate, notably regarding the chemical nature of the inserting cation and the exact role of preadded Mn2+ in the cycling improvement. Different charge storage
mechanisms were indeed proposed. A majority of works rely on the assumption of reversible Zn-ion insertion (or intercalation) into MnO2 to produce either layered birnessite,
Zn-buserite, or spinel ZnMn2O4.[11–13,18,21,23,25,28–30] In other studies, the authors claim that both H+
and Zn2+ co-intercalate within MnO2 but along to different thermodynamic paths and
chemical reactions.[15–17,22,31,32] Finally, a few studies report on an exclusive proton uptake to
form either MnOOH[10,14,26,33] or soluble Mn2+ (with simultaneous precipitation of zinc
hydroxide sulfates induced by local pH increase),[34] but without demonstrating where protons
4
Another critical issue is the moderate gravimetric capacities reported in these studies, ranging from 220 to 370 mAhg-1,[27] corresponding roughly to half of the maximal theoretical capacity of MnO2. This led several groups to conclude that the reversible discharge
mechanism is circumscribed to a one-electron reduction of MnIVO2 into different MnIII
species such as MnIIIOOH[10,14,22,31] or Zn-intercalation products.[11,17,18,22,31] However, it
remains difficult to conceive that MnO2 reduction is restricted to a single-electron process,
especially when dissolution to Mn2+ is frequently observed upon discharging
MnO2[10,11,21,31,34,35] (thus necessarily involving a two electron reduction of MnO2 into Mn2+,
whether the latter is generated directly by electrochemical reduction or indirectly from disproportionation of the intermediate MnIII species). Futhermore, the single electron
hypothesis cannot explain the beneficial role of preadded Mn2+. In several studies it is
reported that Mn2+ help to suppress,[10,11] inhibit,[12] or discourages[26] Mn dissolution, with the
underlying assumption that it changes the equilibrium of Mn dissolution from the MnO2
electrode.[10] However, this reasoning is hard to follow given that the preadded concentration
of Mn2+ remains low (0.1-0.3 M) and thus far from saturation.[36]
A main consequence of the aforementioned mechanistic doubts and inconsistencies is that the corresponding balanced equation is uncertain, precluding thus the rational design and optimization of mild aqueous Zn/MnO2 batteries. The purpose of the present work is to fill
this gap by performing an in-depth quantitative analysis of the electrochemical charge/discharge mechanism occurring at pure MnO2 films in various aqueous electrolytes.
To this end, well-defined and reproducible MnO2 thin-films anodically electrodeposited on
flat ITO electrodes were used. These MnO2 electrodes have the advantage to avoid polymer
binder and carbon additives. Moreover, their semi-transparency allows for their quantitative characterization by UV/vis spectroelectrochemistry, a methodology we previously used to investigate the proton-coupled electron charge storage at nanostructured TiO2 electrodes.[37,38]
5
quantify in-situ the amount of MnO2 on the electrode, allowing for real-time monitoring the
active material that dissolves and redeposits along the discharging/charging cycles. In order to deconvolute the exact role of the different chemical species contained in the electrolyte, the electrodes were cycled in buffered and unbuffered aqueous electrolytes of different nature, composition, and pH. Our results unambiguously demonstrate that, under mild aqueous conditions, the nearly two-electron storage capacity of MnO2 is accessible when a weak
Brønsted acid is present at a sufficiently high concentration. This latter act as the essential source of protons required for the easy and reversible dissolution of MnO2 into soluble Mn2+.
2. Results and Discussion
The MnO2 thin-film electrodeposited on the ITO electrode (see Experimental Section)
was characterized by SEM, XRD, XPS and UV-vis absorption spectroscopy as detailed in the SI. The amorphous film exhibits a typical sheetlike nanostructure with a large surface/electrolyte interface. A major feature of the film is the average redox state of the Mn ions, which was estimated to 3.7 from both XPS and ICP quantification. Accordingly, the maximal theoretical gravimetric capacity of the as-deposited MnO2 thin film is 571 mAhg-1.
2.1. Capacitive behavior in unbuffered aqueous KCl electrolyte, pH 5.0
The as-electrodeposited MnO2 thin films were first investigated by UV-vis
spectroelectrochemistry in a 1 M KCl electrolyte adjusted to pH 5.0 ([H3O+] 10-5 M). The
simultaneously recorded cyclic voltammograms (CVs) and cyclic voltabsorptograms (CVAs), as well as the galvanostatic charging/discharging curves concomitantly monitored by potentiometry and UV-vis absorptometry are shown in Figure 1. Both the shape and the stability of the quasi-rectangular CV and the V-shaped galvanostatic curves support the reversible charging of an electrical double layer at the MnO2/electrolyte interface.[39]
In the CV, the magnitude of the MnO2 capacitive current is considerably higher than
6
ability of MnO2 film to boost the overall capacitance of the electrode, which makes it of great
interest for the development of supercapacitors.[40–53] The apparent specific gravimetric
capacitance of the MnO2 film was Cf = 270 Fg-1 at a rate of 0.15 mAcm-2 (14 Ag-1), which
lies within the range of capacitances commonly reported for MnO2 thin films,
electrodeposited on planar electrodes.[40,41,45–47] A higher value of 390 Fg-1 was obtained by decreasing twice the discharging rate to 0.075 mAcm-2. Such a rate effect was frequently reported but only recently elucidated as the consequence of the ohmic potential drop,[54]
generated here across the poorly conductive film of MnO2.
In the galvanostatic experiments, the absence of fading upon continuous cycling reveals excellent reversibility and stability, with nearly 100% coulombic efficiency (Figure 1C). Such a high stability supports the hypothesis of a stable Mn oxidation state upon cycling (at least within the potential window 0 to 0.95 V, otherwise it would lead to a gradual capacity decrease, resulting either from the gradual faradaic dissolution of the film[48] or from the
conversion of MnO2 into less electrochemically active manganese species,[49] which is
typically what happens when a MnO2 electrode is polarized at too negative potential
values[50]). This was confirmed by ex-situ XPS characterization of the electrode at the end of a
first galvanostatic discharge to 0 V in 1 M KCl (Table S1). Contrary to what has been previously published,[44] the XPS Mn(3s) peak splitting (4.63 eV) was practically unchanged
compared to the as-electrodeposited MnO2 film (4.64 eV), demonstrating no noticeable redox
changes at the Mn centers. This is fully consistent with the in situ Mn K-edge XAS analyses of electrodeposited MnO2 films,[49] showing only a small fluctuation in the Mn oxidation state
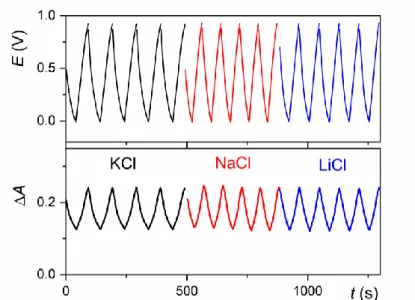
in a similar potential window. Finally, we notice that the galvanostatic charging/discharging cycles remain almost unchanged once the MnO2 electrode is successively immersed in an
aqueous electrolyte containing 1 M KCl, 1 M NaCl or 1 M LiCl (all adjusted to pH 5) (see Figure S1). Such a behavior demonstrates a charge storage mechanism relatively indifferent to
7
the nature, size and solvation of the cation, attesting thus of a conventional double layer capacitance. All these observations are consistent with those extensively reported for MnO2
electrodes in mild aqueous electrolytes containing just an inert salt.[42,43,51–53]
With regard to the electrochromic properties of MnO2, both the CVAs and the
absorptometric traces recorded during the galvanostatic cycles show an almost linear absorbance change as a function of the applied potential, as well as a fully reversible change upon switching back to the starting potential. The absorbance variation stays significant (│A│ 0.1) within the potential window investigated here (0 - 0.95 V). It most likely results from a capacitive effect, as demonstrated for other metal oxide semiconductors in the absence of ion intercalation,[55,56] notably for TiO2.[37,57] It is worth noting that the potential
window investigated here lies within the conduction band of MnO2,[58] so it behaves as an
ohmic conductor which Fermi level is governed by the underlying ITO potential. The density of delocalized charge carriers in MnO2 is consequently modulated through the filling of the
conduction band by charge injection from ITO. This electron doping thus induces a change in the MnO2 absorbance with an almost linear correlation with the applied potential.
Finally, all of the present results demonstrate that the electrodeposited MnO2 thin film
behaves as an electrical double layer capacitor when cycled in an aqueous electrolyte containing only an inert alkali cation and a negligible amount of free protons ([H3O+]∼10-5
M).
2.2. Faradaic MnO2 conversion in the presence of weak acids at pH 5
Next, we investigated the electrochemical behavior of MnO2 thin films in a 1 M
acetate buffer of pH 5.0, along with 0.3 M KCl to maintain the same ionic strength as above. Under these conditions, the concentration of free protons remains low, i.e. [H3O+] = 10-5 M.
The only difference compared to previous conditions is the presence of a weak Brønsted acid with its conjugate base, i.e. the acetic acid (0.25 M) and sodium acetate (0.75 M),
8
characterized by a pKa of 4.76. The experimental data reported in Figure 2 demonstrate a
radically different electrochemical behavior of MnO2 in such buffered electrolyte compared to
that obtained in unbuffered 1 M KCl at the same pH (compare the dashed and plain black lines in Figure 2A).
In the CV experiment (Figure 2A), on top of the capacitive current a very intense, sharp and well-defined faradaic reduction peak located at 0.47 V is observed during the first reduction scan. Its integration leads to a total charge of 16 mC·cm-2. (Integration over the entire
potential window leads to a slightly higher value of 20.5 mC·cm-2, accounting for the
additional contribution of the double layer capacitance of MnO2). Concomitantly to the
faradaic peak, the magnitude of the electrode absorbance is drastically decreased. This faradaic reduction is also irreversible owing to the absence of reoxidation peak in the reverse CV scan and to the continuous decrease of current and absorbance in the further CV and CVA cycles, respectively. Such behavior strongly suggests the reductive dissolution of the MnO2
film, a faradaic process manifestly induced here by the acetate buffer.
In echoes to the CVs, the galvanostatic experiments (Figure 2B) show during the first discharge a well-defined single faradaic plateau centered on an average potential of 0.56 V with a concomitant strong electrode absorbance decrease (A 0.17, which cannot be attributed to MnO2 electrochromism because of the constant potential value). The total charge
of 15 mCcm-2 (nearly the same than from the peak integration in CV) corresponds to a gravimetric capacity of 404 mAhg-1 based on the initial mass of MnO2, which indicates that
more than one electron is passed per Mn center. The subsequent charging/discharging cycles are characterized by a fast fading of both the discharge capacity and electrode absorbance down to residual threshold values, signing thus again the faradaic MnO2 dissolution upon
cycling. The amount of MnO2 remaining on the ITO surface after 5 galvanostatic cycles
9
initial mass of MnO2. This outcome definitely confirms that the electrode fading results from
(i) the rapid loss of MnO2 from the ITO surface according to a reductive faradaic process
leading to soluble Mn2+, and (ii) the ineffectiveness of the back re-electrodeposition of MnO2
from the small amount of Mn2+ released in solution.
In order to better evidence the link between the faradaic reactivity and the buffer composition, a series of first galvanostatic discharges were recorded in electrolytes containing an increasing concentration of acetate buffer (from 1 mM to 1 M), keeping the pH at 5.0. As expected, the discharge curves (Figure S2) show an increase of capacity (from 50 to 410 mA·hg-1) with the increase of buffer concentration, along with a progressive transition from a capacitive behavior (characterized by a linear variation of the potential with time) to a faradaic discharge (characterized by a well-defined potential plateau). This behavior strongly supports a mechanism involving the weak Brønsted acidity of acetic acid. Indeed, at a sufficiently high buffer concentration, it can play the role of an efficient proton donor to assist the faradaic proton-coupled electron transfer reaction required for the dissolution of MnO2
into Mn2+. This is very analogous to what we recently demonstrated for the reversible
insertion of protons in TiO2 in the presence of a weak acid.[37,38] From these considerations,
we can thus propose the following global proton-coupled electron transfer reaction at the metal oxide/electrolyte interface:
MnO2(s) + 4 AH + 2 e- Mn2+(aq) + 4 A- + 2 H2O (1)
where AH and A- are the weak acid and conjugated base of the buffer, respectively. In
absence of preadded Mn2+ in the electrolyte, reaction 2 is apparently irreversible, but we will
show later on that full reversibility can be achieved in an appropriate buffered electrolyte. The striking contrast we observe between buffered and unbuffered conditions perfectly highlights how the presence of a proton donor at an appropriate concentration is crucial to move from a purely capacitive behavior to an almost exclusive faradaic one. It is worth noting that even if the solvent is itself a weak Brønsted acid, H2O cannot induce reductive
10
dissolution of MnO2 in the explored potential window because of thermodynamic
considerations, as we will discuss later.
2.3. Influence of the electrolyte composition on the first discharge of the MnO2 thin films
2.3.1. Effect of the addition of Mn2+ in the electrolyte.
As mentioned in the introduction, addition of Mn2+ (at an optimal concentration
ranging from 0.1 to 0.3 M) has been reported to significantly improve the rechargeability of Zn/MnO2 aqueous batteries,10,[26],27 but through a mechanism that so far has not been clearly
established. [10–12,26] Therefore, we examined the first galvanostatic discharge of an
as-electrodeposited MnO2 electrode in an acetate buffer (1 M, pH 5.0) containing 0.1 M MnCl2.
A well-defined single discharge plateau at an average potential of 0.52 V is obtained (Figure 2C, blue curve), leading after completion to a total discharge capacity of 385 mA·hg-1. Concomitantly, the absorbance dropped by 0.16. These data are very similar to those discussed above in the absence of preadded Mn2+ (compare the blue curves in Figure 2C to
the black ones in Figure 2B). The discharged electrode, further characterized by ex-situ SEM and XPS, was then compared to both an as-electrodeposited MnO2 electrode and a bare ITO
electrode (Figure 3). For the discharged electrode, a strong contribution of the underlying ITO surface is observed in the XPS spectrum (see also Table S1). This validates the dissolution of a large fraction of the MnO2 film, making discernible the underlying ITO, as
also confirmed by SEM. Still, a small fraction of the film remains on the surface at the end of the first discharge, which is consistent with the light-yellow color of the discharged electrode (Figure 3B) and the non-zero value reached by A (Figure 2C). Its further analysis by ex-situ XPS indicates an AOS of Mn almost identical to that of the initial film (Figure 3E and Table S1), suggesting that the MnO2 reductive dissolution occurs without noticeable accumulation
of lower oxidation states of Mn at the electrode surface. We thus assume that the remaining film fraction still correspond to MnO2 but with a low electrical connection to the underlying
11
electrode, impeding thus its efficient reductive dissolution. The residual amount of undissolved MnO2, estimated from both the electrode absorbance (using Equation S2) and
ICP titration, was 20 wt. % of the initial film. Based on this quantitative analysis, the gravimetric capacity delivered by the redox-active fraction of MnO2 (80 wt. %) was
estimated to 480 mA·hg-1. This corresponds to an average number of 1.6 electron passed per dissolved Mn center, thus quite consistent with the MnO2 average oxidation state of 3.7
(determined by both ICP titration and XPS analysis, see SI for details).This result definitely confirms the electrochemical reduction of MnO2 (or more rigorously of
MnIV0.72MnIII0.28O2K0.09H0.19, as reported in SI) into the water-soluble Mn2+ species.
Overall, the above results demonstrate that, whether there is or not Mn2+ in the
electrolyte, the MnO2 film undergoes similar massive reductive dissolution upon discharging
in a 1 M acetate buffer of pH 5.0. In contrast to what has been previously reported in the literature, this dissolution is neither suppressed,[10,11] inhibited,[12] or discouraged[26] by the
preadded Mn2+ in the electrolyte.
2.3.2. Influence of the discharging rate and charge transfer resistance.
The first galvanostatic discharges of as-electrodeposited MnO2 electrodes were
recorded at different rates in a 1 M acetate buffer (pH 5.0) containing 0.1 M MnCl2 (Figure
S3). When the rate increases from 1 to 15 Ag-1, almost 100% of the gravimetric capacity is preserved (see also Table S2), while the discharge plateau potential is only downshifted by a few mV. These observations demonstrate an excellent rate capability wherein MnO2 reductive
dissolution is fast, occurring nearly at the thermodynamic equilibrium for discharge rates < 15 Ag-1. Therefore, according to Equation 1, we can write an equilibrium potential governed by the following Nernst equation (valid at 25°C as long as MnO2 is present on the working
electrode, see SI for details):
2+ 2+ 2 0 MnO /Mn 0.12 pH 0.03 log Mn E E a (2)12
where 2+
2
0 MnO /Mn
E is the standard potential of the MnO2/Mn2+ redox couple defined at pH 0 (i.e.,
1.315 V vs. NHE for -MnO2[59]), and 2+ Mn
a the activity of Mn2+ in solution. For the 1 M
acetate buffer containing 0.1 M MnCl2, the activity of Mn2+ can be estimated as 0.04
(calculated using the Truesdell-Jones equation[60]). Using this value in Equation 2, an
equilibrium potential of E = 0.557 V (vs. Ag/AgCl at pH 5.0) can be predicted. This potential value is close to that obtained for the first discharge plateaus in Figure S3 (i.e., 0.52 V), therefore confirming that the discharge process is close to the equilibrium at the slowest rates.
The first discharging process was also investigated by galvanostatic intermittent titration (GITT). First of all, the GITT plot (Figure 2C) shows a complete dissolution of the film after 22 pulses as attested by the final A value of - 0.014 and the total gravimetric capacity of 518 mA·hg-1 (close to the maximal theoretical capacity of 524 mA·hg-1 if assuming 1.7 e- per Mn), consistent with a complete dissolution of the MnO2 film. Analysis of
the GITT discharge profile allows to clearly identify two distinct regions. A Region I, i.e. below 300 mA·hg-1, where a stable discharge potential value centered on 0.5 V is rapidly reached after each pulse. This is associated to a steadily decrease of the absorbance (by step of
0.01 absorbance unit per pulse). During the relaxation step, while the absorbance remains stable, the OCP relaxes to a constant equilibrium value of 0.54 V, very close to the theoretical equilibrium potential calculated using Equation 2 (represented by the horizontal dotted line in Figure 2C). The small overvoltage observed in Region I is indicative of a low charge transfer resistance as well as of a fast electrochemical reductive dissolution of MnO2 into Mn2+,
occurring thus nearly under thermodynamic equilibrium as discussed above. In Region II, a large voltage drop to ca. -0.7 V is observed, together with an absorbance decrease similar to that in Region I, while the OCP continues to relax close to 0.54 V, as in Region I. The constant equilibrium OCP recorded during the entire GITT experiment strongly agrees with
13
the equilibrium potential defined by eq. 2, which therefore solely depends on the pH and Mn2+
activity in solution.
In Region II, it is interesting to note that a new potential plateau is reached at 0.65 V, signing a new faradaic process we attribute to the electrochemical reduction of dioxygen into hydrogen peroxide. H2O2 is well known to chemically reduce MnO2, even under mild
aqueous conditions.[61–63] It can thus be assumed that the electrochemically generated H2O2
contributes to the chemical reductive dissolution of the residual MnO2 up to a complete
dissolution. Further work is however required to definitely prove such reactivity. 2.3.3. Influence of the buffer composition.
According to Equation 2, the equilibrium discharge potential is expected to be a function of the local activity of Mn2+ and pH, which means that any gradient of [Mn2+] or pH
at the electrode interface should influence the discharge electrode potential and so its evolution with time. In electrolytes containing 0.1 M MnCl2, the Mn2+ concentration locally
released in the diffusion layer cannot significantly alter the already high local concentration of Mn2+ (0.1 M). This is supported by the following rough calculation. If we assume that the
released Mn2+ diffuses ( Mn2+ 6 7 10
D cm2s-1) in solution according to a linear gradient across a constant natural diffusion-convection layer (that takes place after a few tens of seconds over a maximal thickness of 200 µm[64]), we can estimate that the local increase of [Mn2+] should not exceed 2.5 mM. This value is clearly negligible compared to the 0.1 M
Mn2+ initially presents. A similar reasoning can be applied to the local change of pH, which in
1 M buffered electrolyte cannot significantly vary.
The pH-dependence of the first discharge plateau potential was investigated in miscellaneous aqueous buffers of different pHs (ranging from 2.95 to 7.0) with 0.1 M MnCl2
(Figure 4). Special care was taken to maintain [AH] and [A-] in the same proportions to
14
and buffered electrolytes, the shapes and gravimetric capacities are well conserved (Figure 4A) unlike the average discharge plateau potential (or half-discharge potential) which scales linearly with the pH, leading to a slope of -125 mV/pH unit (Figure 4C). This slope perfectly agrees with Equation 2.
Similar experiments were reproduced in the same buffers but without MnCl2, letting to
explore the higher pH value of 9.1.[65] The resulting discharge curves (Figure 4A) are
systematically slightly up-shifted compared to those previously obtained in the presence of 0.1 M MnCl2, including even a somewhat steeper discharge plateau. This is again consistent
with Equation 2, predicting an increase of the equilibrium potential upon decreasing the Mn2+
activity. Still, the half-discharge potential value exhibits the same dependence of -125 mV/pH unit (Figure 4C), confirming an identical reductive dissolution mechanism, whether there is or not Mn2+ in the electrolyte.
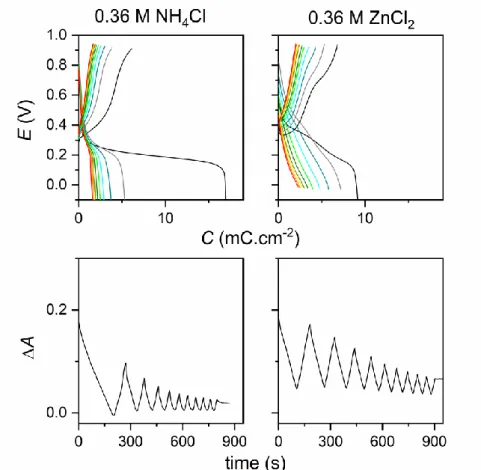
2.3.4. Evidencing local pH changes in unbuffered electrolytes.
To examine the effect of a pH gradient on the MnO2 discharge, we investigated
unbuffered electrolytes containing solely a weak Brønsted acid at a fixed concentration of 0.36 M (Figure 4B). The galvanostatic discharge curve obtained in an unbuffered acetic acid solution (pKa = 4.76, pH adjusted to 2.95) shows an upshift of the discharge plateau by 0.21 V
compared to the acetate buffer at pH 5.0. An identical potential upshift (0.2 V) is also observed between the unbuffered NH4Cl electrolyte (pKa = 9.25, pH adjusted to 5.0) and the
ammonium buffer at pH 9.1. In this latter case, the galvanostatic discharge shows, at the beginning, a large voltage drop before to reach a plateau centered on 0.2 V. These effects are clearly the consequence of a drastic local pH increase, resulting from the combined effect of the strong local consumption of protons required for the dissolution of MnO2 (4 H+ per Mn
reduced, see Equation 1) and of initial electrolyte conditions that are far from being buffered. The potential finally tends to stabilize because the weak acid AH is locally converted to its conjugated base A-, therefore reaching locally a dynamic equilibrium with the continuous flux
15
of AH/A- arriving/leaving by diffusion. Consequently, the local pH and so the discharge
potential rapidly reach a steady state value governed by the pKa of the weak acid and the local
relative concentrations of AH and A-. These results suggest that the MnO2 electrode acts as a
pH electrode capable of continuously sense the local pH change during the charge/discharge steps. Using the linear pH-dependence of the half-discharge potential established in buffered solution (Figure 4C), we can extrapolate the local pH generated at the MnO2 film in
unbuffered electrolytes (represented by the horizontal dotted lines in Figure 4, linking the half-discharge potentials in 4B to the linear plots in 4C). Typically, we infer a local pH of
7.5 for the NH4Cl electrolyte, whereas it is 3.1 for the acetic acid electrolyte. This local
pH between the two electrolytes is in line with their pKa of 4.5.
Finally, the results obtained in buffered and unbuffered electrolytes demonstrate that the pKa of the weak acid directly affects the thermodynamic of the discharging process, but
without significantly impacting the efficiency of the process. It also provides a better understanding of why water, with its high pKa of 14, does not contribute to the reductive
dissolution of MnO2 in the potential window we investigated here.
2.3.5. Effect of multivalent metal ions (Zn2+, Mn2+).
Recently, the best performances of mild aqueous Zn/MnO2 batteries were obtained in
unbuffered electrolytes containing a mixture of 1-2 M ZnSO4 and 0.1-0.3 M MnSO4.10-25
Hence, we were interested in examining the MnO2 film discharge in aqueous electrolytes
containing these multivalent cations. This interest was also motivated by our recent work demonstrating that hydrated multivalent metal cations can act as an effective source of protons to compensate the negative charge generated during the reduction of an insertion metal oxide such as TiO2 (and not, as frequently reported, to compensate the negative charge
by insertion of the multivalent cation into the metal oxide).[38]
The first discharge of a MnO2 film in an aqueous solution of 0.36 M ZnCl2 (adjusted
16
unbuffered NH4Cl or acetic acid electrolytes, show a significant discharge capacity (> 200
mAhg-1), similar to those reported in the literature.[11,31] This significant capacity, much higher than in 1 M KCl, clearly supports a faradaic mechanism where MnO2 is
electrochemically reduced. Many groups attributed this discharging process to Zn-ion insertion in MnO2,[11,17,18,22,31] but without considering that dissolution of multivalent metal
ions in aqueous solutions leads to aquo metal ion complexes sometime characterized by a significant weak Brønsted acidity.[66] Hence, they can act as proton donors, exactly as we have
just shown above with the unbuffered acetic acid or NH4Cl electrolytes. The hexaaquo
complexes [Zn(H2O)6]2+ and [Mn(H2O)6]2+ are characterized by pKa of 9.0 and 10.6,[66]
respectively. The first one is close to the pKa of NH4+ (pKa = 9.25). Therefore, during MnO2
reduction the local pH change due to the consumption of protons supplied by [Zn(H2O)6]2+
should be analogous to that observed in the unbuffered NH4Cl electrolyte, with the
consequence to produce discharge curves in the same potential window. This is effectively what we observe in Figure 4, from which we can estimate a local pH of 7.0 at half-discharge in the ZnCl2 electrolyte, which is close to the pH value of 7.5 determined in NH4Cl. Still, the
gravimetric capacity in ZnCl2 remains much lower than in NH4Cl at the same concentration.
This can be interpreted by the precipitation of zinc hydroxides due to the local pH increase, as previously suggested.[10,33,34,67] The formation of zinc hydroxides over the MnO2 film may
also contribute to the steeper discharge curve in ZnCl2 than in NH4Cl. Still, a large fraction of
MnO2 is dissolved, as attested by the significant and continuous absorbance decrease upon
cycling in ZnCl2 (Figure S4). This observation agrees with previous studies reporting on an
important capacity fading of MnO2 in Zn2+-based aqueous electrolytes (and Mn2+
-free).[10,26,34,35]
The galvanostatic discharge of MnO2 was also performed in 0.36 M MnCl2 (adjusted
17
shapes and gravimetric capacities, the only difference being the downshift by 0.21 V for the Mn2+- versus Zn2+-based electrolyte (Figure 4B). This is again fully consistent with Equation
2 (or its equivalent eq. S3) which predicts a potential shift of 0.2 V from the pKa of 1.6 we
have between the two hexaaquo metal ion complexes.
To definitely rule out the presumed insertion of divalent metal ions in MnO2, the
galvanostatic discharge was also investigated in 0.36 M CaCl2 (adjusted to pH 5.0). Contrary
to Zn2+ and Mn2+, the aquo Ca2+ ion is a very weak acid (pKa 12.7),[66] nearly as weak as
water. As expected, the corresponding discharge curve (Figure 4B) overlay with the one recorded in 1 M KCl, demonstrating an almost purely capacitive behavior and so no faradaic discharge either by charge compensation with Ca2+ insertion or by proton-coupled reductive
dissolution.
Overall, these observations demonstrate that the same mechanism of proton-coupled electron transfer is at work in both Mn2+- and Zn2+-based electrolytes, wherein the corresponding weak
acid hexaaquo metal ion complexes, [M(H2O)6]2+, act as proton donors to assist the reductive
dissolution of MnO2 into Mn2+, according to the following global reaction:
MnO2(s) + 4 [M(H2O)6]2+ + 2 e- Mn2+(aq) + 4 [M(H2O)5OH]+ + 2 H2O (3)
In the specific case of the Mn2+-based electrolyte, it is interesting to note that the weak acid
[Mn(H2O)6]2+ induces its own formation during the conversion of MnO2 into Mn2+.
2.4. Reversible cycling in presence of Mn2+ in buffered aqueous solutions at pH 5
The next question we addressed is the cyclability of a MnO2 electrode in the 1 M
acetate buffer (pH 5.0) containing Mn2+. For such purpose, we carried out a series of
spectroelectrochemical experiments similar to those reported in Figure 2, but with a systematic addition of 0.1 M MnCl2 (Figure 5). The CVs (Figure 5A) show a drastically
18
At the beginning of the first forward reduction scan (started at 0.95 V), an anodic current is generated due to the electrochemical oxidation of Mn2+ that leads to MnO2 deposition over
the film already present on the ITO surface. The film growth is corroborated by the concomitant electrode absorbance increase. As the potential is progressively decreased, two reduction peaks are observed at 0.52 and 0.45 V with a parallel sudden decrease of the electrode absorbance, signing the MnO2 dissolution. In the reverse scan, the current intensity
as well as the absorbance stays very low until the potential reaches the onset oxidation peak of Mn2+ into MnO2, at E > 0.7 V. In the subsequent CV scans, the two reduction peaks remain
present but broader and shifted to more negative potentials, while during the reoxidative scan the oxidation peak of Mn2+ continue to be observed without significant change except of a
slight increase in intensity. The absorbance traces in Figure 5A also evidence the growth of MnO2 on ITO. These results clearly support a reversible process based on the
electrodissolution and electrodeposition of manganese.
The reversible conversion is also well observed in the galvanostatic experiments of Figure 5B. As expected, the first discharge curve leads to the reductive dissolution of 80 % of the as-electrodeposited MnO2 film (see the absorbance trace in Figure 5B). During the
subsequent galvanostatic charge (Qcharge of 25 mC·cm-2), the potential is nearly
instantaneously switched to a maximal value of 0.8 V followed then by a rapid stabilization to a remarkably constant potential value of 0.61 V. This potential fluctuation at the beginning of the charge is reminiscent of the nucleation and growth mechanism occurring at the early stage of MnO2 electrodeposition.[68] The stable potential reached after a few tens of seconds is
close to the equilibrium potential calculated using eq. 3 (represented by the horizontal dotted line in Figure 5B) and also to the one recorded under OCP. This observation suggests that the two-electron transfer reaction required for the electrodeposition of MnO2 is fast, and thus
mainly governed by thermodynamics under the selected experimental conditions. It also implies that the process occurs without significant gradients of [Mn2+] or pH at the electrode
19
interface. This assertion was confirmed by the galvanostatic charges recorded either in the same buffer without MnCl2 or in an unbuffered electrolyte made of only MnCl2, both adjusted
to pH 5 (see Figure S5). In both cases, the charging potential is not stable because of the strong gradients of pH or [Mn2+] that develop at the electrode interface (see discussion in the
SI). These results are particularly interesting because they underline the benefit of using buffered electrolytes to both stabilize the charge and discharge potentials (which is advantageous for the development of stable voltage batteries) and control the voltage hysteresis between the two.
Upon continuously cycling the MnO2 electrode in the 1 M acetate buffer containing
0.1 M Mn2+ (Figure 5B), the discharging capacity rapidly rises up to reach, after a few cycles,
a steady state that remains quite stable without apparent fading over 50 cycles (reaching a coulombic efficiency close to 100 %, see Figure 5C). This steady-state is also corroborated by the highly stable absorbance oscillation between charged and discharged states (Figure 5B). All these results finally demonstrate that a constant quantity of MnO2 is reversibly dissolved
and deposited at each cycle (Figure 5C) over an almost constant fraction of less reactive MnO2.
The shape of the subsequent potentiometric discharges also differs significantly from the first one, showing two plateaus, a first at 0.56 V close to the equilibrium potential, which accounts for 30% of the discharge process, and a second more spread out, at 0.18 V, accounting for the remaining 70%. The switch between a single plateau during the first discharge to two plateaus during the subsequent discharges is reminiscent of other studies (Table S2), but so far not understood.[10,11,29,35] The dynamics of this two plateaus discharge process was further
investigated by performing a GITT experiment at a cycled MnO2 electrode (Figure S6). The
OCP reached at the end of the relaxation time is almost constant over the entire experiment (0.54 ± 0.02 V) and here again close to the equilibrium potential calculated with eq. 3, consistent with a conversion mechanism.
20
At the end of the 10 discharging/charging cycles, the final mass of MnO2 was 25.3
g·cm-2 (determined by ICP), a value which is practically doubled as compared to the initial mass, confirming the accumulation of a poorly electroactive fraction of MnO2 during the first
cycles. On the basis of this final mass, a reversible gravimetric discharge capacity of 274 mAhg-1 is obtained. This is typically in line with the capacities reported for a wide range of MnO2 electrodes in mild aqueous electrolytes (see Table S2),[27] which led several groups to
assume a one-electron reduction of MnO2 into MnIII-oxide species.[11,17,18,21,22] Here, we
clearly show that this modest capacity, close to the half-capacity of MnO2, results rather from
an incomplete utilization of the material itself.
The final mass of MnO2 was also determined (by ICP titration) for a set of electrodes
that were subjected to different galvanostatic cycling procedures (see Table S3 where all the experimental details are gathered). The total MnO2 mass variation (
2 2 2
MnO MnO MnO
f i
m m m ),
reported in Figure 6 linearly correlates with the total charge Qtotal cumulated during each
cycling experiment. From the linear regression fit, an average gravimetric capacity of 540 ± 20 mAhg-1 was determined. Since this value reflects both the overall electrodeposited and electrodissolved fractions of MnO2, it demonstrates that the oxidative and reductive processes
involve the same average number of 1.75 e- per Mn center over the entire range of cycling conditions tested.
Finally, from the data reported in Table S3, we notice that increasing the charging time at a moderate rate leads to an increase of the gravimetric capacities (see for instance samples 3 and 5). This is especially obvious for the electrode we have subjected to a gradual increase of the charging time (Figure 6). After a few cycles, the discharge capacity as well as the absorbance change increase proportionally with the charging time (and thus with Qcharge), with
a CE that also tends towards 100%. In the meantime, the absorbance of the discharged electrode reaches a constant value, indicating the formation of a stable fraction of unreactive
21
MnO2, independent of the charging time. Consequently, the ratio of electroactive versus
poorly electroactive MnO2 is significantly enhanced, and so the gravimetric capacity.
Assuming a 100% CE for the last charging step of 1000 s, a remarkably high gravimetric capacity of 450 mAhg-1 can be estimated based on the final mass of MnO2 (see Table S3,
sample 5), finally demonstrating a very good utilization of the MnO2 film (as high as 84
wt. %). At the high rate of 1.6 Ag-1, this gravimetric capacity outperforms all those previously reported at MnO2 electrodes in mild aqueous electrolytes (Table S2).
3. Conclusion
The overall results presented here shed new light on the reactivity of MnO2 in mild
aqueous media, leading us to propose a revisited interpretation of its charge storage mechanism. The major outcome is the demonstration of a reversible conversion mechanism associated to the faradaic electrodeposition–electrodissolution of the manganese species. This mechanism is conceptually analogous to that reported in strongly acidic[8,9] or basic
electrolytes,[7] the main difference being the nature of the proton donor/proton acceptor couple.
In acidic electrolytes, the proton donor is naturally H3O+, while the proton acceptor is water.
In strongly alkaline media, the proton source is the solvent H2O. In such corrosive electrolytes,
the high concentration of H3O+ or OH- maintains the pH at a relatively stable value, and so the
charge/discharge voltages. As we show here, in mild aqueous electrolytes, the reversible reductive dissolution of MnO2 into Mn2+ can also be achieved, however only in the presence
of a sufficiently high concentration of a weak Brønsted acid. In addition, due to the conversion principle, it is necessary to add a reasonably high concentration of Mn2+ in the
electrolyte to ensure an efficient back electrodeposition of MnO2. The benefit of adding the
conjugate base in the electrolyte is to neutralize the protons released during the recharging process, and thereby to stabilize its potential. We can thus conclude that buffered electrolytes loaded with Mn2+ are best suited to achieve a high gravimetric capacity and stable voltage at
22
MnO2 electrodes. In the present case, the maximal theoretical capacity of MnO2 is limited to
540 mA·h·g-1 because the conversion process involves an effective number of 1.75 e- per Mn. To make the best use of this capacity, it is essential to find experimental conditions that avoid or minimize the accumulation of unreactive MnO2 during cycling. The present results
show that this objective can be partly achieved by optimizing the charging time.
Another important finding of the present study relies on the unsuspected role played by multivalent metal ions such as Zn2+ and Mn2+, commonly present in the aqueous
electrolytes of rechargeable Zn/MnO2 batteries. The weak acidity of their hydrated forms
must be definitely considered as an effective source of protons to assist the conversion of MnO2 into Mn2+. This is in the same vein as what we have previously shown at TiO2
electrodes,[38] and it is a general concept that extends most likely far beyond metal oxides.
Supporting Information
Experimental section, Characterization of the as-electrodeposited MnO2 films;
Thermodynamic analysis of the MnO2/Mn2+ reaction; Figures S1 to S6; Tables S1 to S3.
Acknowledgements
The authors thank Gurvan Le Faucheur (U.F.R. de Chimie, Université de Paris) for ICP analysis, Philippe Decorse and Sarra Gam Derouich (ITODYS, CNRS, Université de Paris) for XPS measurements and SEM imaging, respectively. We also gratefully acknowledge financial support from the National Research Agency (ANR AqReBat project).
23
References
[1] C. M. Julien, A. Mauger, Nanomaterials 2017, 7, 396.
[2] Y. Tang, S. Zheng, Y. Xu, X. Xiao, H. Xue, H. Pang, Energy Storage Mater. 2018, 12, 284.
[3] A. Biswal, B. Chandra Tripathy, K. Sanjay, T. Subbaiah, M. Minakshi, RSC Adv. 2015, 5, 58255.
[4] J. Shin, J. K. Seo, R. Yaylian, A. Huang, Y. S. Meng, Int. Mater. Rev. 2019, 1.
[5] W. J. Wruck, B. Reichman, K. R. Bullock, W. ‐H. Kao, J. Electrochem. Soc. 1991, 138, 3560.
[6] M. Winter, R. J. Brodd, Chem. Rev. 2004, 104, 4245.
[7] G. Yadav, J. W. Gallaway, D. E. Turney, M. Nyce, J. Huang, X. G.Wei, S. Banerjee, Nat. Commun. 2017, 8, 14424.
[8] W. Chen, G. Li, A. Pei, Y. Li, L. Liao, H. Wang, J. Wan, Z. Liang, G. Chen, H. Zhang, J. Wang, Y. Cui, Nat. Energy 2018, 3, 428.
[9] D. Chao, W. Zhou, C. Ye, Q. Zhang, Y. Chen, L. Gu, K. Davey, S. Z. Qiao, Angew. Chemie - Int. Ed. 2019, 7823.
[10] H. Pan, Y. Shao, P. Yan, Y. Cheng, K. S. Han, Z. Nie, C. Wang, J. Yang, X. Li, P. Bhattacharya, K. T. Mueller, J. Liu, Nat. Energy 2016, 1, 16039.
[11] N. Zhang, F. Cheng, J. Liu, L. Wang, X. Long, X. Liu, F. Li, J. Chen, Nat. Commun.
2017, 8, 405.
[12] B. Wu, G. Zhang, M. Yan, T. Xiong, P. He, L. He, X. Xu, L. Mai, Small 2018, 14, 1. [13] T. Xiong, Z. G. Yu, H. Wu, Y. Du, Q. Xie, J. Chen, Y.-W. W. Zhang, S. J. Pennycook,
W. S. V. Lee, J. Xue, Adv. Energy Mater. 2019, 9, 1803815.
[14] G. Fang, C. Zhu, M. Chen, J. Zhou, B. Tang, X. Cao, X. Zheng, A. Pan, S. Liang, Adv. Funct. Mater. 2019, 29, 1808375.
24
Luo, C. Han, L. Mai, Adv. Energy Mater. 2019, 9, 1901469.
[16] D. Wang, L. Wang, G. Liang, H. Li, Z. Liu, Z. Tang, J. Liang, C. Zhi, ACS Nano 2019, 13, 10643.
[17] Q. Zhao, X. Chen, Z. Wang, L. Yang, R. Qin, J. Yang, Y. Song, S. Ding, M. Weng, W. Huang, J. Liu, W. Zhao, G. Qian, K. Yang, Y. Cui, H. Chen, F. Pan, Small 2019, 15, 1904545.
[18] W. Qiu, Y. Li, A. You, Z. Zhang, G. Li, X. Lu, Y. Tong, J. Mater. Chem. A 2017, 5, 14838.
[19] X. Wu, Y. Xiang, Q. Peng, X. Wu, Y. Li, F. Tang, R. Song, Z. Liu, Z. He, X. Wu, J. Mater. Chem. A 2017, 5, 17990.
[20] Y. Zeng, X. Zhang, Y. Meng, M. Yu, J. Yi, Y. Wu, X. Lu, Y. Tong, Adv. Mater. 2017, 29, 1.
[21] Q. Huang, W. Wei, B. Han, L. Xiao, L. Chen, Y. Deng, D. Zhang, S. Zhao, D. G. Ivey, J. Mater. Chem. A 2018, 6, 5733.
[22] J. Huang, X. Dong, Y. Wang, Y. Xia, M. Hou, Y. Liu, Z. Wang, Nat. Commun. 2018, 9, 1.
[23] Y. Fu, Q. Wei, G. Zhang, X. Wang, J. Zhang, Y. Hu, D. Wang, L. Zuin, T. Zhou, Y. Wu, S. Sun, Adv. Energy Mater. 2018, 8, 1801445.
[24] H. Li, Z. Liu, G. Liang, Y. Huang, Y. Huang, M. Zhu, Z. Pei, Q. Xue, Z. Tang, Y. Wang, B. Li, C. Zhi, ACS Nano 2018, 12, 3140.
[25] M. Chamoun, W. R. Brant, C. W. Tai, G. Karlsson, D. Noréus, Energy Storage Mater.
2018, 15, 351.
[26] S. H. Kim, S. M. Oh, J. Power Sources 1998, 72, 150.
[27] G. Fang, J. Zhou, A. Pan, S. Liang, ACS Energy Lett. 2018, 3, 2480. [28] C. Xu, B. Li, H. Du, F. Kang, Angew. Chemie - Int. Ed. 2012, 51, 933.
25 Chem. Mater. 2015, 27, 3609.
[30] K. W. Nam, H. Kim, J. H. Choi, J. W. Choi, Energy Environ. Sci. 2019, 12, 1999. [31] W. Sun, F. Wang, S. Hou, C. Yang, X. Fan, Z. Ma, T. Gao, F. Han, R. Hu, M. Zhu, C.
Wang, J. Am. Chem. Soc. 2017, 139, 9775.
[32] Y. Li, S. Wang, J. R. Salvador, J. Wu, B. Liu, W. Yang, J. Yang, W. Zhang, J. Liu, J. Yang, Chem. Mater. 2019, 31, 62036.
[33] P. Oberholzer, E. Tervoort, A. Bouzid, A. Pasquarello, D. Kundu, ACS Appl. Mater. Interfaces 2019, 11, 674.
[34] B. Lee, H. R. Seo, H. R. Lee, C. S. Yoon, J. H. Kim, K. Y. Chung, B. W. Cho, S. H. Oh, ChemSusChem 2016, 9, 2948.
[35] S. Islam, M. H. Alfaruqi, V. Mathew, J. Song, S. Kim, S. Kim, J. Jo, J. P. Baboo, D. T. Pham, D. Y. Putro, Y. K. Sun, J. Kim, J. Mater. Chem. A 2017, 5, 23299.
[36] MnSO4 and ZnSO4 have similar high solubilities of 4 and 3.6 M, respectively, in pure
water at 25°C, which means that electrolytes containing 1-2 M ZnSO4 + 0.1-0.3 M
MnSO4 (such as those typically used aqueous Zn/MnO2 batteries) are far from
saturation.
[37] Y.-S. Kim, S. Kriegel, K. D. Harris, C. Costentin, B. Limoges, V. Balland, J. Phys. Chem. C 2017, 121, 10325.
[38] Y.-S. Kim, K. D. Harris, B. Limoges, V. Balland, Chem. Sci. 2019, 10, 8752. [39] C. Costentin, J.-M. Saveant, Chem. Sci. 2019, 22, 5656.
[40] P. K. Nayak, S. Devaraj, N. Munichandraiah, Electrochem. Solid-State Lett. 2010, 13, 2010.
[41] S. L. Kuo, N. L. Wu, J. Electrochem. Soc. 2006, 153, 1317.
[42] S. Pang, M. A. Anderson, T. W. Chapman, J. Electrochem. Soc. 2000, 147, 444. [43] W. Wei, X. Cui, W. Chen, D. G. Ivey, Chem. Soc. Rev. 2011, 40, 1697.
26
[45] C. A. Castro Ruiz, D. Bélanger, D. Rochefort, J. Phys. Chem. C 2013, 117, 20397. [46] J. N. Broughton, M. J. Brett, Electrochim. Acta 2005, 50, 4814.
[47] M. J. Young, M. Neuber, A. C. Cavanagh, H. Sun, C. B. Musgrave, S. M. George, J. Electrochem. Soc. 2015, 162, A2753.
[48] W. Yan, J. Y. Kim, W. Xing, K. C. Donavan, T. Ayvazian, R. M. Penner, Chem. Mater.
2012, 24, 2382.
[49] K. W. Nam, M. G. Kim, K. B. Kim, J. Phys. Chem. C 2007, 111, 749. [50] M. Toupin, T. Brousse, D. Bélanger, Chem. Mater. 2002, 14, 3946. [51] H. Y. Lee, J. B. Goodenough, J. Solid State Chem. 1999, 144, 220.
[52] Q. Qu, P. Zhang, B. Wang, Y. Chen, S. Tian, Y. Wu, R. Holze, J. Phys. Chem. C 2009, 113, 14020.
[53] W. Yan, T. Ayvazian, J. Kim, Y. Liu, K. C. Donavan, W. Xing, Y. Yang, J. C. Hemminger, R. M. Penner, ACS Nano 2011, 5, 8275.
[54] C. Costentin, J.-M. Savéant, ACS Appl. Energy Mater. 2019, 2, 4981. [55] G. Boschloo, D. Fitzmaurice, J. Phys. Chem. B 1999, 103, 2228.
[56] G. Garcia, R. Buonsanti, E. L. Runnerstrom, R. J. Mendelsberg, A. Llordes, A. Anders, T. J. Richardson, D. J. Milliron, Nano Lett. 2011, 11, 4415.
[57] G. Boschloo, D. Fitzmaurice, J. Phys. Chem. B 1999, 103, 7860.
[58] B. A. Pinaud, Z. Chen, D. N. Abram, T. F. Jaramillo, J. Phys. Chem. C 2011, 115, 11830.
[59] A. J. Bard, R. Parsons, J. Jordan, Eds. , Standard Potentials in Aqueous Solution, CRC Press, 1985.
[60] D. L. Parkhurst, in Chem. Model. Aqueous Syst. II, American Chemical Society, 1990, pp. 3–30.
[61] D. B. Broughton, R. L. Wentworth, M. E. Laing, J. Am. Chem. Soc. 1947, 69, 744. [62] M. Nakayama, A. Sato, R. Yamaguchi, Electroanalysis 2013, 25, 2283.
27
[63] A. S. Ryabova, A. Bonnefont, P. Zagrebin, T. Poux, R. Paria Sena, J. Hadermann, A. M. Abakumov, G. Kéranguéven, S. Y. Istomin, E. V. Antipov, G. A. Tsirlina, E. R. Savinova, ChemElectroChem 2016, 3, 1667.
[64] C. Amatore, S. Szunerits, L. Thouin, J. S. Warkocz, J. Electroanal. Chem. 2001, 500, 62.
[65] Mn2+ remains soluble at pH 9.1 as long as aMn2+ < 1.2510-3.
[66] S. J. Hawkes, J. Chem. Educ. 1996, 73, 516.
[67] In a 0.36 M Zn2+ solution, precipitation of Zn(OH)2 is expected to occur at pH > 6.0
(taking into account an activity of 0.105 for Zn2+ and a solubility product constant of Ks
= 310-17).
28
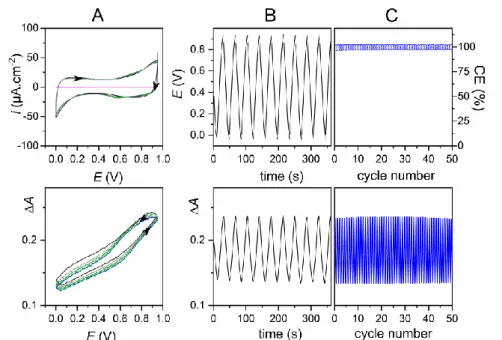
Figure 1. (A) Five successive (top) CVs and (bottom) CVAs (obtained by subtracting the
UV-vis absorbance recorded at 500 nm to that recorded at 700 nm, i.e. A = = A500 - A700)
concomitantly monitored at an as-electrodeposited semi-transparent MnO2 thin-film ITO
electrode ( 2 MnO i
m = 11.4 g·cm-2) in 1 M KCl (adjusted to pH 5). The pink curve is the background CV recorded at a bare ITO electrode. Scan rate: 5 mVs-1. (B) Continuous galvanostatic discharging/charging curves recorded at a MnO2 thin-film ITO electrode (
2 MnO
i m = 10.8 g·cm-2) in 1 M KCl (adjusted to pH 5). The potentiometric (top) and absorptometric (bottom) traces were recorded simultaneously. The charging/discharging rate was 0.15 mAcm-2 (14 Ag-1). (C) (top) Coulombic efficiency recovered from the 50 galvanostatic cycles applied as in B at a MnO2-coated ITO electrode and (bottom) the corresponding
29
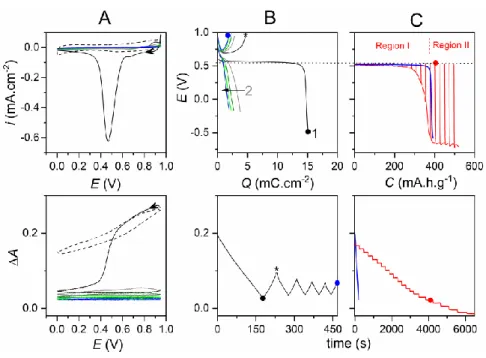
Figure 2. (A) Five successive (top) CVs and (bottom) CVAs concomitantly monitored (scan
rate: 5 mVs-1) at an as-electrodeposited MnO2 thin-film ITO electrode ( MnO2 i
m = 10.7 g·cm-2) in a 1 M acetate aqueous buffer (pH 5.0). For sake of comparison, the first CV and CVA (dashed lines) scanned in an unbuffered 1 M KCl aqueous electrolyte (pH 5.0) are shown. (B) Galvanostatic discharging/charging curves (5 cycles, rate: 0.17 mA·cm-2) concomitantly
recorded by (top) potentiometry and (bottom) absorptometry at a MnO2 thin-film ITO
electrode ( 2 MnO
i
m = 10.3 g·cm-2) in a 1 M acetate buffer (pH 5.0). (C) First galvanostatic discharge curves obtained under (blue) continuous or (red) intermittent titration (rates: 0.08 mA·cm-2) at MnO2 thin-film ITO electrodes (
2 MnO
i
m = 10.8 ± 1.2 g·cm-2) in a 1 M acetate buffer (pH 5.0) containing 0.1 M MnCl2. The potentiometric (top) and absorptometric
(bottom) traces were recorded simultaneously. For the intermittent titration, a discharge pulse of 10 s followed by open circuit potential measurement until dE/dt < 10 Vs-1 was repetitively applied. The horizontal dotted line crossing the top figures B and C corresponds to the theoretical equilibrium potential defined by Equation 2.
30
Figure 3. (Left) SEM images recorded at (A) an as-electrodeposited MnO2 thin-film ITO
electrode, (B) a MnO2 thin-film ITO electrode after a first discharge in a 1 M acetate buffer
(pH 5.0) containing 0.1 M MnCl2, and (C) a bare ITO electrode. (Right) (D) Survey XPS
spectra and (E) high resolution Mn(3s) XPS spectra determined for the electrodes shown in (black) A, (red) B, and (grey) C. The XPS spectra in blue are those obtained for a MnO2
31
Figure 4. First galvanostatic discharges (rate: 0.088 ± 0.005 mA·cm-2) recorded at
as-electrodeposited MnO2 thin-film electrodes (
2 MnO i
m = 11.4 ± 0.7 g·cm-2) in (A) buffered an (B) unbuffered aqueous electrolytes. The color code in A is as follows: 0.9 M chloroacetate buffer (pH 2.95) with (black) or without (grey) 0.1 M MnCl2; 1.0 M acetate buffer (pH 5.0)
with (blue) and without (cyan) 0.1 M MnCl2; 0.45 M HEPES buffer (pH 7.0) with (olive) and
without (green) 0.1 M MnCl2; (prune) 0.66 M ammonium buffer (pH 9.1) without MnCl2. The
color code in B is as follow: (dark cyan) 0.36 M acetic acid and (dashed black) 1 M KCl aqueous electrolytes adjusted both to pH 2.95; (magenta) 0.36 M NH4Cl, (violet) 0.36 M
ZnCl2, (black) 0.36 M MnCl2, (dashed orange) 0.36 M CaCl2 and (dashed red) 1 M KCl
aqueous electrolytes adjusted all to pH 5.0. (C) Half-discharge potential plotted as a function of the pH of buffered electrolytes, and in the () absence or () presence of 0.1 M MnCl2.
The dashed horizontal lines show how to determine the local pH using a transfer to graph C (see text for details). The symbols refer to the half-discharge potential values recovered from refs [11,31] (recalculated vs. Ag/AgCl) obtained in aqueous electrolytes containing a
mixture of 2-3 M Zn2+ and 0.1-0.2 M Mn2+. These values are reported on the graph as a
32
Figure 5. (A) Two consecutive CVs and CVAs concomitantly monitored (scan rate: 5 mVs-1) at a MnO2 thin-film ITO electrode (
2 MnO i
m = 10.4 g·cm-2) in a 1 M acetate buffer (pH 5.0) containing 0.1 M MnCl2. For sake of comparison, the first CV and CVA (dashed lines)
recorded in an unbuffered 1 M KCl aqueous electrolyte (pH 5.0) are shown. (B) Galvanostatic discharging/charging curves (10 cycles, rate: 0.083 mA·cm-2) concomitantly recorded by (top)
potentiometry and (bottom) absorptometry at a MnO2 thin-film ITO electrode (
2 MnO
i
m = 11
g·cm-2) in a 1 M acetate buffer (pH 5.0) containing 0.1 M MnCl2. (C) (top) Coulombic
efficiency recovered from 50 galvanostatic cycles, applied as in B at a MnO2-coated ITO
electrode and (bottom) the corresponding absorptometric trace. The black dots were recovered from the cycles in B.
33
Figure 6. (A) Galvanostatic discharging/charging curves (10 cycles during which the
charging time was incremented from 100 to 1000 s by step of 100 s per each cycle, rate: 0.093 mA·cm-2) concomitantly recorded by (top) potentiometry and (bottom) absorptometry at a
MnO2 ITO electrode (loaded with 11 g·cm-2 MnO2) in a 1 M acetate buffer (pH 5.0) with 0.1
M MnCl2. The code color for the cycle number is as follow: (black) 1, (grey) 2, (dark cyan) 3,
(cyan) 4, (green) 5, (olive) 6, (dark yellow) 7, (yellow) 8, (orange) 9, (red) 10. (B) (top) Coulombic efficiency extracted from the top graph in A as a function of the cycle number,
and (bottom)
2 2 2
MnO MnO MnO
f i
m m m as a function of Qtotal extracted from a set of
galvanostatic cycling experiments (see Table S3). The red line is the linear regression to the experimental data (slope = 0.515 ± 0.021 g·cm-2, r2 = 0.98).
34
Supporting Information
Accessing the two-electron charge storage capacity of MnO
2in
mild aqueous electrolytes
Mickaël Mateos, Nikolina Makivic, Yee-Seul Kim, Benoît Limoges,* Véronique Balland*
I. Experimental Section
II. Characterization of electrodeposited MnO2 thin films
III. Thermodynamic analysis of the MnO2/Mn2+ reaction
IV. Supplementary Figures V. Supplementary Tables VI. References
35
I. Experimental Section
Chemicals. Mn(II) acetate tetrahydrate (99.99%), KNO3 (ReagentPlus, > 99.0%), HNO3
(Suprapur, 65%), acetic acid (Reagent plus, > 99%), sodium acetate, chloroacetic acid, HEPES hydrate (> 99.5%), HEPES sodium salt, MES hydrate (> 99.5%), MES sodium salt, NH4Cl, KOH, HCl (Normapur, 37%), KCl (GR for analysis), NaCl (GR for analysis), LiCl
(GR for analysis), Trichloroethylene, Ethanol absolute (EMSURE), ZnCl2 were purchased
from Sigma-Aldrich/Merck. MnCl2 tetrahydrate (99%) was purchased from Alfa Aesar.
Acetone (Normapur) was purchased from VWR Chemicals. ITO electrodes (8-12 ohms/) were provided by Sigma-Aldrich.
ITO electrodes cleaning. Prior to use, planar ITO electrodes were cleaned by
successively sonicating them in tricholoroethylene, acetone and ethanol for 15 minutes each. After the electrodes were left to dry, a working square planar ITO area of 0.6 ± 0.1 cm2 (N = 20) was delimited using a nail vanish.
Preparation of the MnO2-coated ITO electrodes. MnO2 thin-films on transparent ITO
electrodes were obtained from electrodeposition at a controlled anodic potential in a standard three-electrode cell configuration, using a CHI900 potentiostat (CH Instruments), a SCE reference electrode (+0.244 V vs. NHE), and a Pt-mesh counter electrode. All electrodeposition experiments were performed at ambient temperature (23 ± 2 °C) in quiescent solutions. During preliminary electrochemical testing, some films peeled off the ITO surface. To improve the film adhesion on the ITO substrate, the following procedure was used. A freshly cleaned and delimited ITO electrode was placed in a 10 mL aqueous solution containing 1 mM MnII(CH3CO2)2 and 1 M KNO3 (pH 6.5). It was first scanned by cyclic
voltammetry (CV) at 50 mVs-1 from 0 to 1 V (single cyclic scan), followed by potentiostatic
electrodeposition at 0.9 V (vs. SCE) for a duration ranging from 150 to 900 s (corresponding thus to a deposited charge ranging from 6.7 to 33.2 mCcm-2). Concomitantly with the MnO
2
film growth, the color of the initially transparent electrode gradually changes from light yellow to dark brown.
After electrodeposition, the modified electrodes were soaked for a few minutes in milliQ water and left to dry at room temperature. For a typical electrodeposition time of 600 s, the total charge density Q was 21 ± 1 mCcm-2 (N = 20). For each electrode, the initial amount of
electrodeposited MnO2 ( MnO2
i
m in gcm-2) was estimated from the following equation (see
section II for details):
2
MnO 0.52 i
m Q
Further quantitative characterizations of the as-electrodeposited electrodes by UV-visible absorption spectroscopy, XPS and ICP are reported in section II below.
Aqueous electrolytes composition. Aqueous electrolytes with the following chemical
composition were prepared in milliQ water. Buffered electrolytes (pKa-1 < pH < pKa+1): (i)
0.9 M chloroacetate buffer (pKa = 2.87) at pH 2.95 (prepared from a 1 M chloroacetic acid
solution adjusted to the desired pH with 1 M KOH) along with 0.3 M KCl or 0.1 M MnCl2
(ionic strength I = 0.92 M) (ii) 1 M acetate buffer (pKa = 4.76) at pH 5.0 along with 0.3 M
KCl or 0.1 M MnCl2 (I = 1.05 M) (iii) 0.65 M MES buffer (pKa = 6.16) at pH 6.0 along
with 0.4 M KCl or 0.1 M MnCl2 (I = 0.6 M) (iv) 0.45 M HEPES buffer (pKa = 7.5) at pH
6.9 along with 0.4 M KCl or 0.1 M MnCl2 (I = 0.39 M) (v) 0.66 M ammonium buffer (pKa
=9.23) at pH 9.1 along with 0.4 M KCl (I = 0.76 M). Unbuffered electrolytes (pH < pKa-1): (i)
1 M KCl adjusted to pH 3.0 or 5.0 with 1 M HCl (I = 1 M) (ii) 0.36 M NH4Cl adjusted to
pH 5.0 with 1 M HCl (I = 0.36 M) (iii) 0.36 M ZnCl2 adjusted to pH 5.0 with 1 M HCl (I =