HAL Id: hal-03241442
https://hal.archives-ouvertes.fr/hal-03241442
Submitted on 28 May 2021HAL is a multi-disciplinary open access archive for the deposit and dissemination of sci-entific research documents, whether they are pub-lished or not. The documents may come from teaching and research institutions in France or abroad, or from public or private research centers.
L’archive ouverte pluridisciplinaire HAL, est destinée au dépôt et à la diffusion de documents scientifiques de niveau recherche, publiés ou non, émanant des établissements d’enseignement et de recherche français ou étrangers, des laboratoires publics ou privés.
When is a Cast Iron Eutectic?
Jose Ramón Olaizola, Anna Regordosa, Jon Sertucha, Jose Ramón Olaizola,
Jacques Lacaze
To cite this version:
Jose Ramón Olaizola, Anna Regordosa, Jon Sertucha, Jose Ramón Olaizola, Jacques Lacaze. When is a Cast Iron Eutectic?. International Journal of Metalcasting, Springer Verlag, In press, �10.1007/s40962-021-00587-7�. �hal-03241442�
1 When is a cast iron eutectic?
Anna Regordosa1, Jon Sertucha1, Jose Ramón Olaizola1, Jacques Lacaze2
1 - Azterlan, Basque Research Technological Alliance, Durango (Bizkaia), Spain 2 - CIRIMAT, Université de Toulouse, Toulouse, France
Corresponding author: J. Lacaze, [email protected]
Keywords: eutectic cast irons, hypereutectic cast irons, primary graphite, eutectic reaction, thermal analysis
Abstract
Literature often mentions that cast irons that appear eutectic by thermal analysis are
hypereutectic if one refers to the equilibrium phase diagram. This is a source of ambiguity and confusion. The analysis of experimental results on hypereutectic cast irons has previously shown that taking into account the solidification path during the primary precipitation of graphite makes it possible to differentiate slightly hypereutectic cast irons from very hypereutectic cast irons. This approach is applied here to a cast iron which appears eutectic when inoculated and hypoeutectic when not. Thus, it is confirmed that graphite growth only becomes effective when a minimal undercooling is reached, independently of inoculation. However, only an alloy with a carbon equivalent at the boundary between mildly and strongly hypereutectic alloys and which is inoculated can appear eutectic by thermal analysis.
2 Introduction
Whereas fully pearlitic lamellar graphite cast irons (LGI) are usually hypo-eutectic to improve their mechanical properties [1, 2], spheroidal graphite cast irons (SGI) can have pearlitic, ferritic and mixed microstructures and are commonly eutectic alloys (heavy sections) or slightly hyper-eutectic ones (small-to-medium sections) to minimize porosity [3] and eutectic carbides [4].
The term "eutectic" first refers to equilibrium phase diagrams and it is common to locate cast irons in the Fe-C section of the relevant equilibrium phase diagram when dealing with their solidification. However, the precipitation of austenite and graphite and their eutectic depends on nucleation and growth kinetics of these phases which can affect the solidification process. A practical rule states that an alloy is said to be eutectic if the cooling curve by thermal analysis shows a single arrest corresponding to the eutectic reaction [5]. However, it has long been pointed out that such a rule can be confusing in the case of mildly hypereutectic irons [6, 7].
By reanalysing a number of thermal records, it was shown that the solidification of mildly hypereutectic alloys can be better understood by referring to the appropriate equilibrium phase diagram [8]. This previous work has focused on alloys with different carbon equivalent (CE) values, while the present report analyses the results obtained with a given melt during production.
Experimental details
The experiments were carried out during production in a foundry in the Basque Country, Spain. The melt was prepared for casting SGI parts with the nodularization treatment carried out using the sandwich method in a 2000 kg ladle. For this purpose, a commercial FeSiMg alloy (5.5 wt.% Mg, 2.28 wt.% rare earths, 43.4 wt.% Si, 2.10 wt.% Ca, 0.32 wt.% Al, balance Fe) was added to the reaction chamber of the ladle at an amount of 1% of the total weight of the treated melt, and was then properly covered with steel scrap. The metal was sequentially transferred to the pouring unit according to production requirements and then held in a pressure pour furnace.
Two thermal cups and a medal sample were cast at the end of each ladle, one of the cups having no inoculant while the other one contained a commercial inoculant (73-78 wt.% Si,
3 2.0-2.5 wt.% Ca, 1.0-1.5 wt.% Al, 1.3-1.8 wt.% Zr, balance Fe) at an amount of 0.15% of the weight of metal poured in the cup. The samples are referenced with the time of casting, from 9:42 to 12:05. There was a one hour break during the production process which appears between 10:40 and 11:42 in Table 1 listing the casting series.
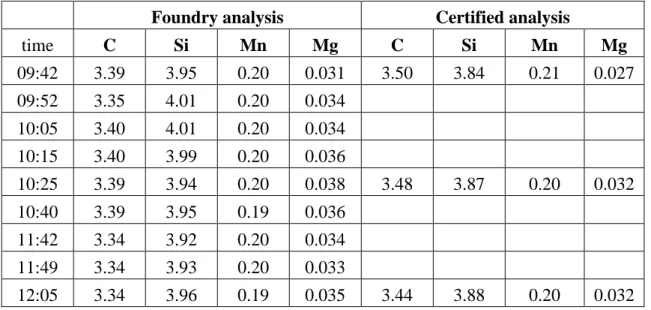
Table 1 – Reference and composition of the samples (wt.%)
Foundry analysis Certified analysis
time C Si Mn Mg C Si Mn Mg 09:42 3.39 3.95 0.20 0.031 3.50 3.84 0.21 0.027 09:52 3.35 4.01 0.20 0.034 10:05 3.40 4.01 0.20 0.034 10:15 3.40 3.99 0.20 0.036 10:25 3.39 3.94 0.20 0.038 3.48 3.87 0.20 0.032 10:40 3.39 3.95 0.19 0.036 11:42 3.34 3.92 0.20 0.034 11:49 3.34 3.93 0.20 0.033 12:05 3.34 3.96 0.19 0.035 3.44 3.88 0.20 0.032
During the experiment, the composition of each medal was analysed in the foundry and was then checked by a certified laboratory for the first, middle and last medal. The alloy contained some Mn, low levels of Cr, Cu and Ni, while all other elements were in trace amounts. Table 1 lists the C, Si, Mn and Mg contents measured in the foundry and in the certified laboratory. Note that these compositions do not take into account the 0.1 wt.% of silicon added by inoculation. In table 1, it can be seen that the certified analyses are 0.1 wt.% higher in carbon content and about 0.09 wt.% lower in silicon content than the foundry values. It was
considered interesting to verify the CE value for this cast iron and this was done using the following formula described previously [9] which, however, was established for silicon contents below 3.0 wt.%:
CE99 = wC + 0.28·wSi + 0.007·wMn + 0.092·wCu + 0.054·wNi + 0.303·wP (1) where wi is the content in element i of the alloy (wt.%).
The average carbon equivalent is therefore 4.48 wt.% and 4.56 wt.% for foundry and certified analysis, respectively. In both cases, the composition is thus expected to be significantly hypereutectic. To avoid any bias due to the use of CE out of the validity range of equation (1), the results will be presented in a Fe-C isopleth section calculated using a thermodynamic
4 software and an appropriate thermodynamic database, see below. The thermal curves were recorded using a data-logger and were later analysed as described in the following section dealing with results.
Results
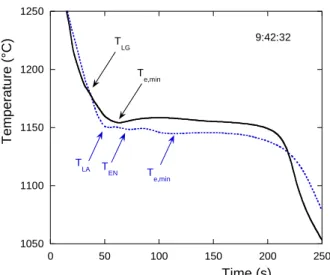
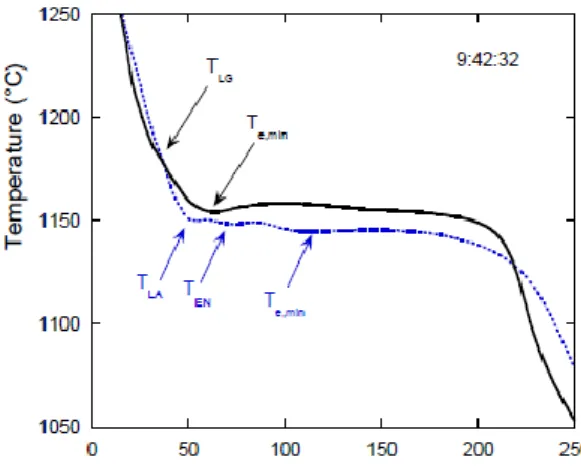
Figs. 1, 2 and 3 compare the thermal records of the non-inoculated (dotted curves) and
inoculated (solid curves) samples cast with the first ladle (9:42), the last ladle before the break (10:40) and the first ladle after the break (11:42). The cooling curves of all the inoculated samples essentially show one single eutectic plateau which can be characterized by the minimum temperature before recalescence, Te,min, and the maximum temperature along the plateau, Te,max. However, some of the curves showed a slope change (Fig. 1) and others showed a marked arrest (Fig. 3) before the eutectic plateau which was located at a
significantly higher temperature than Te,min. As mentioned previously [8], and in accordance with the description of cooling curves by Chaudhari et al. [6, 7], this arrest cannot be confused with the arrest associated with austenite. Consequently, this arrest is denoted TLG, thus
referring to the primary precipitation of graphite. The data for the inoculated samples are listed in Table 2 where the Tpeak values corresponding to the maximum recorded temperature have also been added. All Tpeak values are within ±10°C, which indicates a good
reproducibility of the experimental procedure and thus ensures that similar cooling conditions were obtained for all castings. This is also demonstrated by the time for complete
solidification, as illustrated by the curves in Fig. 3.
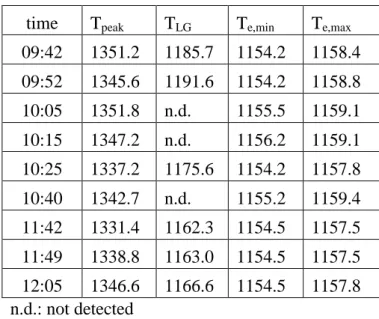
Table 2 – Characteristic temperatures (°C) of the inoculated samples time Tpeak TLG Te,min Te,max
09:42 1351.2 1185.7 1154.2 1158.4 09:52 1345.6 1191.6 1154.2 1158.8 10:05 1351.8 n.d. 1155.5 1159.1 10:15 1347.2 n.d. 1156.2 1159.1 10:25 1337.2 1175.6 1154.2 1157.8 10:40 1342.7 n.d. 1155.2 1159.4 11:42 1331.4 1162.3 1154.5 1157.5 11:49 1338.8 1163.0 1154.5 1157.5 12:05 1346.6 1166.6 1154.5 1157.8 n.d.: not detected
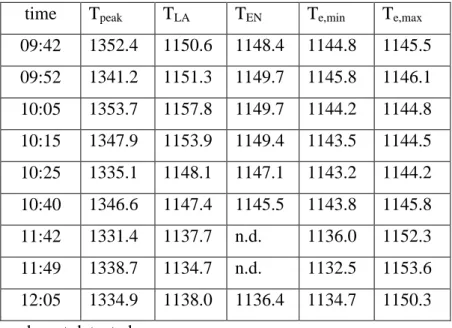
5 For non-inoculated samples cast before the break, all records showed three arrests marked on Figs. 1 and 2, namely a first arrest associated with formation of austenite, TLA, soon followed by a similar arrest sometimes slightly recalescent and thought to be due to the initiation of the eutectic reaction, TEN, and finally a eutectic plateau characterized again with Te,min and Te,max. The temperatures TLA and TEN were determined using the cooling rate curves, dT/dt, either as an evident slope change or as a local maximum of the cooling rate in case of recalescence. After the break, the cooling curve in Fig. 3 shows a long minimum followed by a large recalescence. In the last two records (11:49 and 12:05), the lengthy minimum has evolved in one prolonged arrest followed by a temperature drop to Te,min and then the same kind of recalescence as in Fig. 3. These last three records were characterized by TLA, Te,min and Te,max, and TEN also for the 12:05 record. Data for non-inoculated samples are listed in Table 3, where are also given the Tpeak values.
Table 3 - Characteristic temperatures (°C) of the non-inoculated samples time Tpeak TLA TEN Te,min Te,max
09:42 1352.4 1150.6 1148.4 1144.8 1145.5 09:52 1341.2 1151.3 1149.7 1145.8 1146.1 10:05 1353.7 1157.8 1149.7 1144.2 1144.8 10:15 1347.9 1153.9 1149.4 1143.5 1144.5 10:25 1335.1 1148.1 1147.1 1143.2 1144.2 10:40 1346.6 1147.4 1145.5 1143.8 1145.8 11:42 1331.4 1137.7 n.d. 1136.0 1152.3 11:49 1338.7 1134.7 n.d. 1132.5 1153.6 12:05 1334.9 1138.0 1136.4 1134.7 1150.3 n.d.: not detected
The effect of the break is clearly seen with the change in the records of the non-inoculated samples while no change appears for the inoculated ones. In usual foundry terms, the quality of the melt is said to have decreased during the long holding. A possible phenomenon to explain this is that particles acting as graphite nuclei, such as oxides, sulphides or nitrides resulting from melt processing or compounds resulting from the spheroidization treatment, may have coalesced and settled in the press-pour unit during the holding.
6 Fig. 1 Thermal records of the non-inoculated (dotted curve) and inoculated (solid curve) samples cast at 9:42. The characteristic temperatures are indicated.
Fig. 2 Thermal records of the non-inoculated (dotted curve) and inoculated (solid curve) samples cast at 10:40. The characteristic temperatures are indicated.
Fig. 3 Thermal records of the non-inoculated (dotted curve) and inoculated (solid curve) samples cast at 11:42. The characteristic temperatures are indicated.
1050 1100 1150 1200 1250 0 50 100 150 200 250 T empera tu re (° C) 9:42:32 Time (s) T LG T e,min T e,min T EN T LA 1050 1100 1150 1200 1250 0 50 100 150 200 250 T empera tu re (° C) 10:40:07 Time (s) T e,min T e,min T EN T LA 1050 1100 1150 1200 1250 0 50 100 150 200 250 T empera tu re (° C) 11:42:07 Time (s) T e,min T e,min T LG T LA
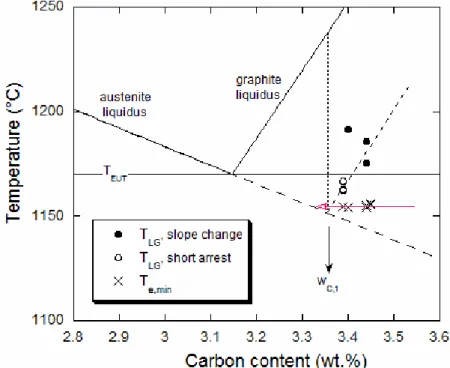
7 The characteristic temperatures of the inoculated samples are shown in Fig. 4 on the Fe-C isopleth section calculated with the 1998 SSOL solution database of the scientific group thermodata Europe (SGTE) [10] which contains the assessment of the Fe-C-Si system carried out to be very accurate in the range of composition of cast irons [11]. The calculation was carried out using the Thermocalc software [12] for 3.87 wt.% Si, 0.20 wt.% Mn and also taking into account other low-level alloying elements, although this has little effect on the isopleth section. The same isopleth section was used for inoculated and non-inoculated alloys, i.e. without taking into account the 0.1 wt.% of Si added by the inoculation which results in a negligible increase of 0.4°C in the eutectic temperature. Similarly, the effect of 0.025 wt.% of free Mg dissolved in the melt was evaluated with the TCFE8 databank and changes the liquidus temperatures of the austenite and graphite of quasi-eutectic Fe-C-Si alloys by less than 0.5 °C, which is also considered negligible.
The carbon content which was considered for Fig. 4 is that measured in the foundry plus 0.05 wt.%, such that the value used differs by ±0.05wt.% from both the foundry and the certified values. This interval of ±0.05wt.% corresponds to the confidence interval of carbon analyses. Of the 6 primary arrests that were recorded, 5 are well aligned along the dashed line which appears almost parallel to the graphite liquidus and crosses the metastable extrapolation of the austenite liquidus at wC,1. This suggests that, for inoculated alloys, the same undercooling of about 85°C relative to the graphite liquidus (see the dotted vertical line) is necessary for the primary growth of graphite to become sufficiently large to cause a thermal effect. It should be noted that this value is intermediate between the previously evaluated values of about 100°C for SGI with 0.042-0.067% by weight of Mg and about 60°C for LGI [8]. As the current alloy contains 0.03-0.04 wt% Mg, it is quite tempting to see here a clear effect of the magnesium content: the higher the Mg content, the slower the graphite growth kinetics and the higher the undercooling required for graphite growth.
Fig. 4 also shows that all 9 inoculated samples showed a Te,min temperature at 1155±1°C, regardless of their nominal carbon content. It is finally noticed that this temperature
corresponds to a carbon content along the austenite liquidus that is slightly lower than wC,1, see the red arrow pointing to the left. These observations have been rationalized previously by calculating the solidification path during primary precipitation of graphite [8]. Provided that the nominal carbon content of the alloy is greater than wC,1, primary precipitation of graphite
8 takes place at an undercooling relative to the graphite liquidus which is almost constant, evaluated here to 85°C. This means that the solidification path practically follows the dashed line once this undercooling is reached. Finally, when the solidification path reaches the austenite liquidus at a temperature close to that corresponding to the composition wC,1, austenite appears and the bulk eutectic reaction proceeds immediately because there were sufficient graphite particles for these inoculated samples.
Fig. 4 Isopleth Fe-C section at 3.87 wt.% Si and 0.20 wt.% Mn. The interrupted line represents the metastable extrapolation of the austenite liquidus. The characteristic temperatures for the inoculated samples are plotted with symbols indicated in the insert.
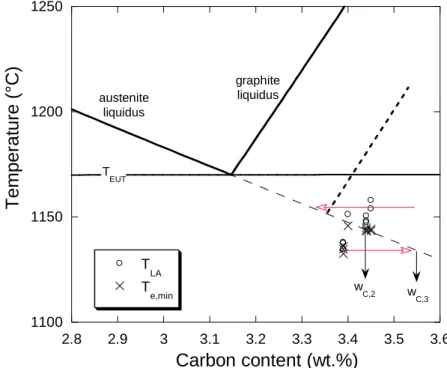
The TLA and Te,min temperatures for the non-inoculated samples are shown in Fig. 5. The TEN temperatures were not reported as they are between TLA and Te,min which are very close to each other. The dashed line and the red arrow pointing to the left are exactly the same as in Fig. 4. There is a clear difference between the values before and after the break, the latter indicating much lower TLA and Te,min temperatures. The TLA temperatures of the samples prior to the break are more scattered than for the inoculated alloys but on average they point to almost the same composition along the austenite liquidus (red arrow to the left) as already noticed [8]. This suggests that there were sufficient graphite particles for the primary solidification path to follow the same locus as for inoculated alloys. However, their number was too small for bulk eutectic solidification to take place as soon as austenite appeared, and
9 further undercooling was required which shifted the liquid composition to wC,2, see Fig. 5. Finally, for the samples cast after the break, it is seen that TLA appears with an undercooling of 15°C on average compared to the extrapolation of the austenite liquidus. Growth of austenite is then very rapid and Te,min is only slightly lower than TLA, but corresponds to a liquid composition significantly shifted towards a higher carbon content at wC,3 (red arrow pointing to the right).
Fig. 5 Isopleth Fe-C section as in Fig. 4. The characteristic temperatures for the
non-inoculated samples are plotted with symbols indicated in the insert. The dashed bold line and the red arrow pointing to the left are the same as in Fig. 4.
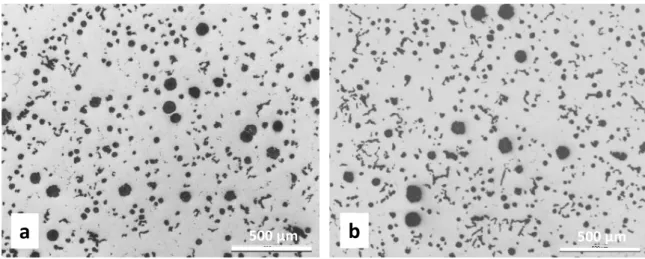
The microstructure of the TA cups has been checked and is illustrated in Fig. 6 for both inoculated (a) and non-inoculated (b) first samples (9:42). It can be seen that the graphite is mainly spherical but with some degenerated precipitates associated with the last to solidify zones. Quantitative analysis showed the fraction of degenerated graphite to be 17% by area (19% by count) for the inoculated sample and 21% by area (29% by count) for the
non-inoculated sample. The most important observation for the present study was the confirmation that large primary spheroids did indeed precipitate in both types of samples.
1100 1150 1200 1250 2.8 2.9 3 3.1 3.2 3.3 3.4 3.5 3.6 T LA T e,min Temp e ra tu re (° C ) Carbon content (wt.%) T EUT austenite liquidus graphite liquidus w C,2 w C,3
10
Fig. 6 Light optical micrograph of the first sample when inoculated (a) or not inoculated (b).
Discussion
We can summarize the above results and discuss them to predict what should be the
composition of an alloy showing only a eutectic plateau during solidification in a TA cup. Fig. 7 reproduces the same isopleth Fe-C section as before. Inoculated alloys with a carbon content higher than wC,1 will undergo primary precipitation of graphite corresponding to a primary solidification path following the dashed arrow until reaching the austenite liquidus. When austenite appears the bulk eutectic starts instantly. The possibility of primary precipitation of graphite increases as the alloy's carbon content rises above wC,1. Conversely, for an inoculated alloy with a carbon content of wC,1, primary deposition of graphite will be such that the
undercooling required for effective growth of the spheroids will be reached exactly when austenite can appear. This alloy will exhibit eutectic behaviour on the basis of the TA-cup record.
If the alloys with carbon content higher than wC,1 are not inoculated but that graphite nuclei are present, we have seen that the conditions for bulk eutectic solidification are satisfied when the carbon content of the liquid is increased to wC,2, see Fig. 5. However, the primary
precipitation of graphite leads the solidification path to cross the austenite liquidus at a carbon content close to wC,1 with precipitation of pre-eutectic austenite. Such alloys do not show a eutectic behaviour upon solidification in a TA cup.
It is certainly worth giving some estimate of the confidence interval for the undercoolings discussed here. According to the manufacturers of the thermal cups and connecting wires, the total possible error of temperature reading is 2°C at 1000°C and may be estimated as 3°C at
500 µm
11 1200°C. Accepting that thermodynamic assessments give liquidus values at ±10°C, the
uncertainty on the undercoolings with respect to the graphite liquidus would be ±13°C, far below the discussed values. As noticed above, the assessment of the Fe-C-Si phase diagram was intended to reproduce accurately the eutectic trough so that the uncertainty on the calculated eutectic temperature is estimated to be at most ±2°C, i.e. the accuracy of the laboratory experiments carried out to determine the eutectic temperature as function of the silicon content. Accounting for the temperature reading, the uncertainty on the eutectic undercooling mentioned in relation with Figures 4 and 5 should thus be lower than ±5°C. Please note that the eutectic undercooling is more than 4 times smaller than the undercooling with respect to the graphite liquidus.
The shaded area to the left of wC,1 in Fig. 7 defines mildly hypereutectic inoculated alloys. They are characterized by the fact that primary graphite spheroids will nucleate during cooling under the graphite liquidus, but the undercooling necessary for their effective growth will not be attained before the austenite liquidus is reached. Once it has appeared, growth of austenite will then rapidly drive the liquid composition to wC,1 where bulk eutectic takes place. This schematic suggests that all mildly hypereutectic inoculated alloys exhibit a eutectic reaction starting at the same temperature. This finding was in fact one of the outputs of the previous analysis of thermal records [8]. It was however noticed that the eutectic temperature of mildly hypereutectic alloys is slightly lower than that of strongly hypereutectic alloys, hence the positioning of the red arrow pointing to the right in Fig. 7.
We have seen that the primary precipitation of graphite depends on the Mg content of the alloy, and apparently to a lesser extent on the inoculation rate. It certainly also depends on the cooling rate: a slower cooling rate would decrease wC,1, while a higher cooling rate would increase it. Thus, an alloy that seems eutectic when solidified in a thermal cup will certainly not be eutectic everywhere in a real casting with different cross-section sizes. In other words, an inoculated SGI may present a eutectic microstructure in some places in a complex casting provided it is highly hypereutectic, but it will hardly present it everywhere.
12 Fig. 7 Isopleth Fe-C section as in Figs. 4 and 5. The dashed bold arrow is the same as the dashed bold line in Figs. 4 and 5. The boundary between mildly and highly hypereutectic alloys defines the composition wC,1 of inoculated alloys that will show a eutectic behaviour upon solidification in a TA cup.
Conclusion
Focusing on primary precipitation of graphite in hypereutectic SGI, it was explained why alloys must be hypereutectic in nature (with reference to the appropriate equilibrium phase diagram) to exhibit eutectic behaviour on thermal analysis records. Furthermore, the present experiments show that this applies to inoculated alloys whereas non-inoculated ones do not exhibit eutectic behaviour. There is therefore a critical value of carbon equivalent, which depends on the cooling conditions, below which alloys are said to be slightly hypereutectic, while above which alloys are strongly hypereutectic. These results are in line with the finding of the previous analysis [8] which showed that eutectic growth can only take place when a high enough undercooling with respect to the graphite liquidus has been reached. It is found here that it is about 85°C, whereas it was previously estimated to be about 100°C for alloys with higher magnesium content. Owing to the change in cooling rates, even an inoculated alloy will not everywhere have a purely eutectic microstructure in complex castings.
1100 1150 1200 1250 2.8 2.9 3 3.1 3.2 3.3 3.4 3.5 3.6 Temp e ra tu re (° C ) Carbon content (wt.%) T EUT austenite liquidus graphite liquidus w C,1 mildly hypereutectic highly hypereutectic
13 Acknowledgments
The authors are pleased to thank Manuel J. Castro-Roman (CINVESTAV-Sallo, Mexico) for his advices in writing this article.
References
[1] L. Collini, G. Nicoletto, R. Konečá, Microstructure and mechanical properties of pearlitic gray cast iron. Mater. Sci. Eng. A 488, 529-539 (2008). DOI: 10.1016/j.msea.2007.11.070 [2] V. Fourlakidis, L.V. Diaconu and A. Diószegi, Effects of carbon content on the ultimate tensile strength in gray cast iron, Mater. Sci. Forum 649, 511-516 (2010). DOI:
10.4028/www.scientific.net/MSF.649.511
[3] A. Regordosa and N. Llorca-Isern, Microscopic characterization of different shrinkage defects in ductile irons and their relation with composition and inoculation process, Int. J. Met. 11, 778-789 (2017). DOI: 10.1007/s40962-016-0120-9
[4] P. David, J. Massone, R. Boeri and J. Sikora, Mechanical properties of thin wall ductile iron-influence of carbon equivalent and graphite distribution, ISIJ Int. 44, 1180-1187 (2004). DOI: https://doi.org/10.2355/isijinternational.44.1180
[5] S. Dawson and P. Popelar, Thermal analysis and process control for compacted graphite iron and ductile iron, Proceedings of the Keith Millis symposium, AFS, 59-66 (2013). [6] M.D. Chaudhari, R.W. Heine and C.R. Loper, Potential applications of cooling curves in ductile iron process control, AFS Trans. 82, 379-386 (1974).
[7] M.D. Chaudhari, R.W. Heine and C.R. Loper, Principles involved in the use of cooling curves in ductile iron process control, AFS Cast Metals Res. J. 11, 52-60 (1975).
[8] M. J. Castro-Román, J. Lacaze, A. Regordosa, J. Sertucha, R. del Campo-Castro,
Revisiting Thermal Analysis of Hypereutectic Spheroidal Graphite Cast Irons, Metall. Mater. Trans. A 51A, 6373-6386 (2020). DOI: 10.1007/s11661-020-06005-7
[9] A. Regordosa, U. de la Torre, J. Sertucha, J. Lacaze, Quantitative analysis of the effect of inoculation and magnesium content on compacted graphite irons – Experimental approach, J. Mater. Process. Technol. 9, 11332-11343 (2020). DOI:
https://doi.org/10.1016/j.jmrt.2020.08.008
[10] https://www.sgte.net/en/sgte-solution-database-sgsol
[11] J. Lacaze, B. Sundman, An assessment of the Fe-C-Si system, Metallurgical Transactions 22A, 2211-2223 (1991)
14 Comments on A. Regordosa, J. Sertucha1, J. Ramón Olaizola, J. Lacaze article
“When is a cast iron eutectic?” Simon N. Lekakh
Missouri University of Science and Technology
The paper by A. Regordosa et al. “When is a cast iron eutectic?” [1] provides some interesting study related to application of industrial thermal analysis for determination of the type of primary
solidification in cast iron with spheroidal graphite (SGI). The related question “When is a cast iron eutectic?” is not rhetoric and definitely very important for both solidification theory and industrial practice. In particular, the hypoeutectic solidification mode with forming an austenite dendrite network could promote micro-shrinkage formation, while the precipitated primary graphite nodules in
hypereutectic SGI could float in the melt of heavy section castings and create structural irregularity. However, the terminology used in this article’s methodology is derived solely on industrial thermal analysis and cannot solve this puzzle without a supporting microstructural analysis or utilization of other direct observation methods. For example, in the article [1], changing slope on inoculated SGI solidified in sand cap was identified as a primary graphite liquidus (TLG) while thermal arrest on not
inoculated SGI was identified as a primary austenite liquidus (TAL) (Fig. 1). Based on such data
analysis, the conclusions about switching from hypo-eutectic to hypereutectic mode by SGI inoculation were made. However, this important statement should have been supported by detailed structure analysis.
Fig. 1. Thermal records of the non-inoculated (dotted curve) and inoculated (solid curve) with indication of the characteristic temperatures are indicated. (Fig. 1 from [1]).
To better understand these issues, it will be useful to provide some basic context. According to the classical definition, eutectic morphologies are characterized by simultaneous growth of two or more phases in direct contact with the melt [2, 3]. The “in direct contact with the melt” is a key important attribute for characterization of what is defined as ‘eutectic transformation’. Considering that this transformation product is composed of more than one phase, eutectics can exhibit a wide variety of geometrical arrangements, including: (i) regular eutectic developed by non-faceted metallic phases with low fusion entropy (Fig. 2a) or (ii) irregular eutectic when one of the phases has high fusion entropy and precipitates as faceted crystals, for example, Fe-C eutectic in cast iron with flake graphite or Al-Si eutectic with Si fibers (Fig. 2b). In all these cases, both phases solidified in direct contact with the liquid phase. If austenite in cast iron or α-Al dendrites in Al-Si alloy precipitated first, this mode will be classified as hypoeutectic, and in the case of direct precipitation of graphite or Si phases from the melt, it will be hypereutectic solidification. The effect of a third element in solidified solid
solution, for example Si or Mn in austenite of Fe-C-Si cast iron, could be considered and described by using eutectic equivalent quantity (CEq). Based on such equilibrium consideration, the answer “When is cast iron eutectic” could be very simple.
15 Fig. 2. Schematic of eutectic types: (a) regular, (b) irregular, and (c) divorced.
However, due to solute redistribution in the liquid in front of the growing solid phases and interface curvature, growth of eutectics proceeds with some undercooling with respect to equilibrium. This undercooling depends on the solidification conditions (cooling rate), number of heterogeneous nuclei, element mobility in the melt and properties of the eutectic phases [2]. In such conditions, a single equilibrium eutectic point in binary alloy transformed into the undercooling domain, called the
coupled zone, between extension of both liquidus below equilibrium eutectic temperature. In principle, the coupled zone of regular eutectics is symmetrical and could be defined from equilibrium
thermodynamics, considering the diffusion and capillarity effects [2]. The amplitude of the
concentration variation in the coupled zone is proportional to the undercooling. For irregular eutectics however, because the coupled zone formed in undercooled melt is skewed in direction of the faceted phase (Si or graphite), the composition for an alloy to grow in a fully eutectic way shifts further and further away from the equilibrium eutectic composition when solidified at a higher and higher cooling rate. It practically means that irregular type eutectic in a solidifying casting will be formed in a slightly hypereutectic composition CEqactual relative to equilibrium composition CEqeq, and CEqactual will
depends on the cooling rate.
Moreover, this definition of eutectic cannot be strictly applied for Mg-treated SGI, because there is no actual side-by-side precipitation or coupled growth of two phases (austenite and graphite) in contact with the melt (Fig. 2c). Close view on the local solidification sequence indicates separation of nucleation and growth of faceted graphite nodules and non-faceted austenite dendrites directly from the melt. The differences in the growth rate and atom mobility facilitate enveloping of the nodules by austenite and switching of different solidification modes during entire solidification. Such behavior has been called divorced growth which could be described as a combination of graphite/melt,
austenite/melt, and graphite/austenite growth modes which could occur sequentially or simultaneously in different local micro-volumes of the solidifying castings. In addition, formation of new active nuclei during solidification, e.g. because of segregation of elements, could promote continuous nuclei
formation which result in several nucleation waves [4]. This means that one unified solidification pattern cannot be specified for SGI. So, what could be a definition of hypo-eutectic and hyper-eutectic structure in this case. It is apparent that SGI solidification has a diffused boundary between these solidification modes and the value of the actual carbon equivalent CEqactual to get an eutectic structure
will depend on the equilibrium eutectic carbon equivalent for the basic chemistry (CEqeq = 4.3 wt.%
1
),
Mg concentration which influences on graphite growth (∆CEqMg = f(Mg)), cooling rate V (∆CEqv =
f(V)), and an effective heterogeneous nuclei number (n), which could be controlled by inoculation
(∆CEqn = f (n)):
CEqactual = CEqeq + ∆CEqv + ∆CEqn +∆CEqMg (1)
Because there is a possibility of overlap the several solidification modes in different casting
microvolumes, an agreement needs to be established in metal casting community to clarify the extent
16 of composition (CEqactual +/- ɛ) when slightly hypo- or hypereutectic structure could be considered as
eutectic.
Let us discuss experimental evidence. Because eutectoid reaction in low alloyed cast irons
significantly masks the primary solidification structure, several experimental methods were suggested to reveal primary austenite dendrites and solidification modes. Boeri and coauthors [5] applied the DAAS (direct austempering after solidification) technique and color metallography to reveal the solidification grains in SGI and CGI based on the micro-segregation pattern. This pattern indicated a combination of primary graphite and primary austenite precipitated simultaneously in hypereutectic CGI with 3.53%C and 3.15%Si (Fig. 3). The hypereutectic mode, when graphite nodules grow in direct contact with the melt away from austenite boundary, could be found locally. This hypereutectic mode coexisted with the local hypoeutectic mode when primary austenite dendrites were formed from the melt, as well as with a specific solidification mode when spherical and compacted graphite particles were developed by carbon diffusion from the melt through austenite shells. These
experimental observations were used by the authors [5] to depict the change of the liquid composition during the mushy zone development in hypereutectic SGI (Fig. 3b). It was assumed that there was an initial step of hypereutectic type transformation when primary graphite nodules grow in the melt, followed by independent formation of primary austenite from the melt (looks like hypoeutectic mode), and finally it could be concomitant growth of austenite and graphite with possible switching graphite or austenite contact with the melt (the hatched area in Fig. 3b). It could be noted that there is also minor evidence of a “true” eutectic solidification when graphite nodules only partially surrounded by austenite with existence of a triple graphite/austenite/melt contact line, but this mode also could be related to formation of degenerated graphite shape. The description made in [1] is in accordance with Fig. 2b but the analyzed results showed that the undercooling of the primary solidification path, ∆TGr,
must be much higher than the possible undercooling for austenite formation, ∆Tγ.
Fig. 3. DAAS obtained microstructure of hypereutectic CGI (a) and plot of the C concentration of the melt as solidification of hypereutectic CGI proceeds (b) [5].
Practically speaking the boundaries between dominant solidification modes could be defined based on casting structure analysis. For example, a hypoeutectic mode will develop an austenite interconnected network and a hypereutectic mode develops a mixture of large primary graphite nodules with a set of smaller nodules formed during eutectic solidification. The quantitative determination of these
parameters requires application of special methods in addition to single thermocouple thermal analysis which was used in the article [1]. For example, two thermocouple method (one at the center and
17 second near the wall with associated Fourier analysis) together with EBSD were used to identify dendrite coherency in hypoeutectic SGI (Fig. 4) [6].
Fig. 4. Determination of dendrite coherency in hypoeutectic SGI using two thermocouple method [6].
To identify the structures of a SGI during early solidification stages, JingJing Quing et al. [7] used the method of sequential interrupted solidification by rapid quenching of slowly solidified specimen in tiny quartz sampler equipped with a thermocouple. This study supported a divorced eutectic solidification mode, without coupled growth of graphite and austenite at the solid/melt front. The spheroidal graphite particles were isolated from the melt by an austenite shell after early solidification stages (Fig. 5).
18 Fig. 5. As-polished microstructures (a, c, e, g) and etched microstructures (b, d, f, h) of specimens
quenched at (a-b) 5 s, (c-d) 11 s, (e-f) 26 s, (g-h) 40 s after solidification started (Fig. 5 from [7]).
The capabilities of different methods of direct 2D and 3D analysis of SGI microstructure including quantitative metallography, automated SEM/EDX analysis, µCT scanning, and indirect thermal analysis were compared in the article [8] in terms of their capability to characterize solidification pattern and forecast related micro-shrinkage formed in SGI casting. 2D and 3D morphological characteristics of graphite nodules and space distribution were determined by using µCT scanning (Fig. 6). It was shown that large nodules were ordered in the space while small nodules were organized in clustered clouds. It was suggested to link the 3D space distribution fabric of graphite nodules and bi-modal diameter distribution to the casting solidification pattern.
19 Fig. 6. Groups of small graphite nodules (red) clustered between ordered large nodules (blue) (a) and
clustered medium diameter nodules (green) (b) [8].
Advanced time-resolved and in-situ observations using synchrotron radiation X-rays has
revolutionized our knowledge about the solidification mechanism in SGI. These methods provided direct observation of solidification in small SGI specimens solidified at controlled cooling rate. K. Yamane with coauthors [9] examined the solidification and the melting behavior of two hypereutectic cast iron specimens containing 0.002% Mg (3.69% C, 2.71% Si) and 0.05 % Mg (3.73% C, 2.57% Si). In the 0.002% Mg specimen, primary graphite precipitation was followed with some time delay by austenite dendrites which first grew independently. In contrast, in the 0.05% Mg SGI, the graphite particles and the austenite phase were nucleated and grew nearly at the same time, so that this alloy showed eutectic or slightly hypereutectic solidification mode. In both cases, eutectic solidification was associated with a second wave of graphite nucleation. It was found that Mg effect on eutectic
composition (∆CEqMg in Eq.1) as being opposite and 18 times stronger than the Si effect on CEqeq.
The nucleation and growth of nodules were also systematically evaluated applying 4D (3D + time) high temperature in-situ synchrotron X-ray tomography by M. Azeem and coauthors [10]. It was mentioned that this investigation resolves the long-standing debate on the locational preference of nucleation of graphite nodules in the Fe-C alloys during solidification. It was hypothesized and verified on a hypoeutectic SGI, that graphite nucleated between dendrite arms during solidification remain anchored and grow in place. Initially, they are spherical and then the degenerate morphologies develop via a burst growth stage, forming polyp-like features.
These new methods were used for direct observation of solidification processes and these results could be compared in future with data obtained from industrial thermal analysis used in this commented paper [1]. Each method had strong and weak points. Synchrotron CT can be used for the direct observation of tiny specimens where solidification pattern could be different from the real casting, while the single thermocouple method used in this paper [1] provides only indirect information about latent heat liberation which was obtained from cooling curves. Therefore, industrial thermal analysis could be used as a supplemental method. In addition, industrial thermal analysis has several
uncertainties, which needed to be considered. Interpretation of cooling curves obtained from industrial hypereutectic SGI thermal analysis is not straightforward because the limiting thermal effect from primary solidified phases leads to difficulties with identification of hypereutectic liquidus in SGI. In addition, the developed thermal gradient in the industrial TA cup could create deflection of cooling curve which is not actually related to solidification at the center of probe [11]. As was shown in the article [11], a possible distortion of single thermocouple cooling curve relates to the Biot number, which is a non-dimensional ratio of external heat transfer (h is a coefficient of convective heat transfer) and internal heat conduction (k) for characteristic wall thickness (l): Bi=hl/k. Several recommendations were investigated in [11] to improve this method, including lowering a Bi-number by applying preheated ceramic cup (decreasing h). Fig. 7 illustrates better matching of the equilibrium
20 to the experimental solid fraction in solidified HY130 steel vs temperature obtained from a single thermocouple ceramic preheated cup with external insulation. Application of such methods could improve prediction of solidification mode in SGI.
Fig. 7. Solid fraction obtained from single thermocouple method using pre-heated ceramic and sand cups in comparrison with equlibrium for HY130 steel [11].
To conclude, the question “When is a cast iron eutectic?” suggested for discussion in article [1] is very important for industrial practice because directly related to casting quality. However, the complicated nature of SGI solidification cannot be defined only from the approach used in the article [1] via the application of the industrial single thermocouple thermal analysis without the additional support of a detailed microstructure analysis and the other more advanced methods. At the same time, the provided thermal analysis data could help industrial personal to identify SGI casting quality problems. From this practical standpoint the article [1] could be strongly recommended to the metal casting
community. More research is required to develop and enhance mechanistic analytical models for determination of eutectic composition, for example applying suggested Eq. 1, and resulting microstructures that are driven on the actual casting conditions.
References
1. A. Regordosa, J. Sertucha1, J.R. Olaizola, J. Lacaze article “When is a cast iron eutectic?” 2. W. Kurz, D. Fisher, Fundamentals of Solidification, Trans Tech Pub. 1986, 97.
3. J. Dantzig, M. Rappaz, Solidification, EPFL Press, 2009, 346.
4. S. Lekakh, Engineering Nucleation Kinetics of Graphite Nodules in Inoculated Cast Iron for Reducing Porosity, Metallurgical and Materials Transactions B, Vol. 50B, 2019, 890. 5. R. Boeri et al. Solidification, Macrostructure and Shrinkage Formation of Ductile and
Compacted Irons, Inter. J. Metalcast 14, 2020,1172.
6. J. Hernando, J. Elfsberg, A. Dahle , A. Diószegi, Evolution of primary austenite during coarsening and impact on eutectic microstructure in Fe–C–Si alloys, Materialia 7, 2019, 100391.
21 7. JingJing Quing, V. Richards, D. Van Aken, Examination of Spheroidal Graphite Growth and
Austenite Solidification in Ductile Iron, Mater. Metal. Trans. A ,Vol. 47A, 2016, 6197. 8. S. Lekakh et al., Micro-CT Quantitative Evaluation of Graphite Nodules in SGI, Inter
Metalcast 14, 2020, 318.
9. K. Yamane et al., Influence of Mg on Solidification of Hypereutectic Cast Iron: X-ray Radiography Study, Mater. Metal. Trans. A, Vol. 46A, 2015, 4937.
10. M. Azeem et al., Synchrotron quantification of graphite nodule evolution during the solidification of cast iron, Acta Materialia, Vol. 155, 2018, 393.
11. S. Lekakh, V. Richards, Determining Solidification Parameters of Alloy Steels, Transactions of the American Foundry Society, 2011, paper 11-042.
22 Authors' reply
The question raised by this discussion, "when is a cast iron microstructure eutectic", is
certainly important for all types of cast iron and in particular for spheroidal graphite cast iron. We fully agree that we have considered only one aspect of the problem, considering that if the thermal analysis does not show a single stop, i.e. it shows a primary arrest before the eutectic plateau, then there is no chance for the microstructure to be eutectic. Thus, the discussion broadens the scope of our contribution.
It is also agreed that the analysis of industrial thermal records is not an easy task when primary precipitation gives rise to low thermal effects as is the case for graphite in cast iron. However, the primary precipitation of graphite and the formation of eutectic entities in cast irons is by nucleation and growth in the liquid, i.e. by a so-called endogenous process leading to equiaxed growth. In such a case, the temperature of the thermal arrest, when observed, is independent of the variation in the cooling rate associated with the modification of the thermal gradient due to the solidification front starting from the wall of the cup.
The most important result of our present study and the previous analysis of other results [1], including data from the literature, is that the growth of primary graphite shows a large undercooling compared to the graphite liquidus. In addition, it has been shown that the eutectic reaction does not start until this undercooling has been reached. For the results analysed [1], this undercooling amounts to 60°C for flake graphite and increases for spheroidal graphite, which is interpreted as an effect of the amount of magnesium on the kinetics of graphite growth since the effect of magnesium on the phase diagram is negligible. Note that this undercooling converts to a much lower value when referring to the stable eutectic temperature, as usually done in the eutectic growth analysis. Finally, the cooling rate and inoculation should also have an effect on the undercooling required for graphite growth and should be investigated further.
[1] M. J. Castro-Román, J. Lacaze, A. Regordosa, J. Sertucha, R. del Campo-Castro,
Revisiting Thermal Analysis of Hypereutectic Spheroidal Graphite Cast Irons, Metall. Mater. Trans. A 51A, 6373-6386 (2020). DOI: 10.1007/s11661-020-06005-7
![Fig. 3. DAAS obtained microstructure of hypereutectic CGI (a) and plot of the C concentration of the melt as solidification of hypereutectic CGI proceeds (b) [5]](https://thumb-eu.123doks.com/thumbv2/123doknet/14432182.515371/17.892.148.742.604.956/daas-obtained-microstructure-hypereutectic-concentration-solidification-hypereutectic-proceeds.webp)
![Fig. 4. Determination of dendrite coherency in hypoeutectic SGI using two thermocouple method [6]](https://thumb-eu.123doks.com/thumbv2/123doknet/14432182.515371/18.892.281.618.159.464/fig-determination-dendrite-coherency-hypoeutectic-using-thermocouple-method.webp)
