HAL Id: hal-01662999
https://hal.laas.fr/hal-01662999
Submitted on 13 Dec 2017HAL is a multi-disciplinary open access
archive for the deposit and dissemination of sci-entific research documents, whether they are pub-lished or not. The documents may come from teaching and research institutions in France or abroad, or from public or private research centers.
L’archive ouverte pluridisciplinaire HAL, est destinée au dépôt et à la diffusion de documents scientifiques de niveau recherche, publiés ou non, émanant des établissements d’enseignement et de recherche français ou étrangers, des laboratoires publics ou privés.
Selective muscle contraction during plantarflexion is
incompatible with maximal voluntary torque assessment
Nicolas Turpin, Antony Costes, David Villeger, Bruno Watier
To cite this version:
Nicolas Turpin, Antony Costes, David Villeger, Bruno Watier. Selective muscle contraction dur-ing plantarflexion is incompatible with maximal voluntary torque assessment. European Journal of Applied Physiology, Springer Verlag, 2014, 114 (8), pp.1667-1677. �10.1007/s00421-014-2900-3�. �hal-01662999�
1
Selective Muscle Contraction during Plantarflexion is
1
Incompatible with Maximal Voluntary Torque Assessment
2 3
Nicolas A. Turpin, Antony Costes, David Villeger and Bruno Watier 4 5 6 7 8 9
N. A. T urpin · A. Costes · D. Villeger · B. Watier 10
UPS, PRISSMH, University of T oulouse, 118 route de Narbonne, 31062 T oulouse Cedex 9, France 11
12
B. Watier 13
CNRS LAAS, 7 Avenue du colonel Roche, 31077 Toulouse, France 14
15
B. Watier (*) 16
PRISSMH‑EA 4561‑F2SMH, Pôle Sport, 118 route de Narbonne, 31062 T oulouse Cedex 9, Francee-mail: 17
bruno.watier@univ‑tlse3.fr 18
2
Abstract 19
Objective. Large variations in maximal voluntary torque are reported in the literature during 20
isometric plantarflexion contractions. We propose that these differences, which could reach 21
40% across similar studies, could be explained by differences in the instructions provided, and 22
notably by instructions as to favoring or not multi-joint contractions. 23
Method. Sixteen participants were placed on an isokinetic ergometer in 3 different positions, 24
supine, prone and seated, with the ankle in the neutral position, and instructed to create maximal 25
force on the footplate by conforming with instructions that favored either isolated (ISOL) or 26
multi-joint (ALL) isometric contractions. Torque, foot kinematics and the electromyographic 27
activity of seven muscles of the lower limb have been recorded. 28
Results. Joint torques were greater in ALL compared to ISOL (p<.05) with gains of 43.5 [25.4 29
170.6]%, 42.5 [1.4 194.6]% and 15.3 [9.3 71.9]% in the supine, prone and seated position, 30
respectively (values are given as median [range]). The results suggested that forces created by 31
muscles that do not span over the ankle joint significantly influenced the measured joint torque, 32
notably in the seated position. Nevertheless, the observed gains in torque were associated with 33
greater plantarflexor muscles activation, showing that the ISOL condition may have induced a 34
form of inhibition of these muscles. 35
Conclusions. The results of this study suggest that using isolated contractions, hence 36
constrained testing protocols, cannot provide optimal conditions for MVC testing, notably for 37
plantarflexor muscles, which seem to be extremely sensitive to such constrained conditions. 38
Keywords. EMG, maximal voluntary contraction; plantarflexion; multi-joint contraction; 39
concurrent activation 40
3
list of abbreviations
ALL: multi-joint contractions condition ANOVA: analysis of variance
CR: center of rotation
EMG: electromyographic signal
EMGmax: maximal electromyographic (EMG) value obtained over all conditions GM: gastrocnemius medialis
Gmax: gluteus maximus
ISOL: isolated contractions condition MVC: Maximal voluntary contraction RF: rectus femoris
SCoRE: Symmetrical Centre of Rotation Estimation method SCS: segment coordinate system
SD: standard deviation Sol: soleus
ST: semi tendinosus TA: tibialis anterior VL: vastus lateralis
4
Introduction
41Maximal voluntary contraction (MVC) torque is an important measure to evaluate 42
mechanical properties of the muscle and their progress with physical training (Klass et al. 2008; 43
Van Cutsem et al. 1998) or in rehabilitation, to assess the evolution of musculoskeletal diseases 44
and to quantify the beneficial effects of different therapeutic strategies (Moraux et al. 2013; 45
McNeil et al. 2007). MVC at the ankle joint is especially critical to consider due to the important 46
role of the plantarflexor and dorsiflexor muscles in maintaining balance and avoiding fall 47
(Horak et al. 1989). Still, MVCs evaluation requires several precautions to be taken, because 48
mechanical and neural factors could greatly influence torque output. Therefore, the present 49
study will focus on isometric plantarflexion MVCs. 50
Regarding mechanical factors, even though ergometers have proven to be reliable 51
instrument per se (Drouin et al. 2004), many biases are known to affect measurements, such as, 52
(i) gravitational effects, (ii) inertial effects, (iii) compliance of the ergometer moment arm or 53
deformation of the footplate and fasteners compliance, or (iv) misalignments between the axis 54
of rotation of the ergometer relative to that of the joint (Arampatzis et al. 2007; Herzog 1988; 55
Deslandes et al. 2008), that, moreover, represents only an approximation of the actual functional 56
axis of rotation of the joints (Ramos and Knapik 1978; Hicks 1953). In the isometric case, 57
gravitational effects are easily eliminated and the inertial effects are supposed to be negligible 58
(Deslandes et al. 2008). Compliance involves movement of the segment relative to the moment 59
arm of the ergometer, and implies that muscles MVCs cannot be evaluated at the exact intended 60
position. Adjustments can nevertheless be easily performed to correct positional changes 61
observed when the muscles go from the passive to the active state (De Ruiter et al. 2008). 62
Misalignment, on the other hand, is particularly critical for the evaluation of plantarflexion as 63
compared to other group of muscles. 64
5
With some simplifications, torque at the ankle can be written (Arampatzis et al. 2007) as: 65 ankle ankle dynamometer dynamometer r r (equation #1) 66
with the torque at either the ankle or the dynamometer axis, and rthe moment arm of the 67
reaction force to either the ankle or the dynamometer. This relation could be rewritten as: 68
1 ;
ankle dynamometer ankle dynamometer dynamometer r r r r r (equation #2) 69
highlighting that, for a given misalignment r (order of magnitude = 1cm), the bias is lower 70
for knee extension testing (with largerdynamometerrelative to r; rdynamometer 30-40cm,
71
(Arampatzis et al. 2004; Deslandes et al. 2008) than for plantarflexion testing (rdynamometer
72
17cm, assuming that the forces on the footplate act at the level of the metatarsophalangeal joint 73
of the big toe, Van Cutsem et al. 1998). In addition, with misalignment, a moment arm is created 74
between the ankle joint and the axis of rotation of the ergometer, and the reactions forces at the 75
level of the ankle joint can thus create a torque on the footplate without any torque on the foot. 76
Moreover, these forces can be easily manipulated by the participant using forces created by 77
muscles not crossing the ankle joint (e.g., knee or hip extensors), and these accessory muscles 78
can then have a mechanical influence on the measured joint torque. 79
At least two neural factors should be considered in this juncture: motivation and 80
concurrent activation potentiation (Ebben et al. 2008a; Ebben et al. 2010), also referred to as 81
remote voluntary contraction (Cherry et al. 2010; Ebben et al. 2008b). Motivation is a well- 82
known confound variable influencing performance which can be controlled following several 83
recommendations (see Gandevia (2001) notably for a review). Concurrent activation 84
potentiation is much less considered and captures the fact that contraction of accessory muscles 85
6
(remote contraction) may increase the maximal activation level of primary movers (Ebben et 86
al. 2008b). This phenomenon is commonly attributed to motor irradiation and/or to an increase 87
in spinal excitability (Ebben 2006). Jaw clenching, Valsalva maneuver and hand gripping have 88
been particularly investigated (see Ebben et al. (2008b) for a review), but muscles from adjacent 89
sites also proves to interact with the primary movers (Barry et al. 2008; Devanne et al. 2002; 90
Kouchtir-Devanne et al. 2012). It is therefore likely that muscles that do not span over the ankle 91
joint have also a neural influence on plantarflexor activity and hence on plantarflexion torque. 92
Since accessory muscles may come into play at both the neural and the mechanical level, 93
the aim of this study was to test the maximal torque produced in plantarflexion using two 94
modalities of instructions aimed at manipulating the degree of involvement of muscles not 95
crossing the ankle joint. Furthermore, the various positioning used in the literature, notably the 96
seated (Moraux et al. 2013; Simoneau et al. 2009), prone (Cresswell et al. 1995; Maganaris 97
2003) and supine positions (Danneskiold‐Samsøe et al. 2009; Simoneau et al. 2007) are likely 98
to favour specific patterns of muscle activity, and thus to influence the results in a different 99
way. Therefore, in this study these three positions have been tested. Offset of the rotation axes, 100
ankle angle deviations and muscle activity have been recorded in order to set apart the neural 101
and mechanical influences of the accessory muscles. 102
7
Materials and methods
103Participants 104
16 healthy males participated to the study (mass=76.8 ± 8.5 kg, range =[68-92]; 105
height=1.77 ± 0.07 m, range=[1.62-1.87]; age=26.9 ± 6.4 years, range=[20-41]). All of them 106
were informed of the experimental procedures prior to giving their written consent to 107
participate. The experimental design of the study was approved by the local ethical committee 108
and the experiments were conducted in accordance with the Declaration of Helsinki (last 109
modified in 2004). 110
General procedure 111
Ankle torque measurements were performed using an isokinetic dynamometer (Biodex 112
III, Shirley Corporation, NY, USA). The right leg was evaluated in all participants. Participants 113
were equipped of the reflective markers used for kinematic analysis and of the recording 114
electromyographic (EMG) surface electrodes at their arrival at the laboratory (see details in 115
sections Kinematics and Electromyographic acquisition). We first estimated the position of the 116
real center of rotation of the ankle by moving passively the ankle on the dynamometer footplate 117
in a procedure described in section Estimation of the ankle rotation axis and center of rotation. 118
Afterward, participants performed a warm up lasting 5 minutes which consisted of submaximal 119
isometric plantarflexor contractions while seated on the ergometer. Participants were then 120
successively placed in the PRONE, SUPINE or SEATED position in a random order to assess 121
their isometric MVCs. For each of these positions two modalities of instruction were randomly 122
given to the participants. These constitute a total of 3x2=6 randomized conditions and for each 123
of them 3 tries were given to the participant, resulting in a total of 18 MVCs. 124
Kinematics 125
8
A motion analysis system (Vicon Motion System, Lake Forest, CA) equipped with 11 126
infrared cameras recorded the 3-dimensional position of 11 reflexive markers stuck on the 127
participant and on the dynamometer. Markers were positioned on the right side of the body at 128
the level of the external and internal maleolli, calcaneous (posterior point of the heel),1st and 129
5th Metatarsal Head, fibula’s head and tibiale’s tuberosity. 4 reflexives markers were placed on 130
the dynamometer such that the mid distance between two of the markers corresponds to the 131
position of the dynamometer axis of rotation and that the two others, placed in a more backward 132
position, allowed to recover the direction of this axis. Kinematic data were recorded at a 133
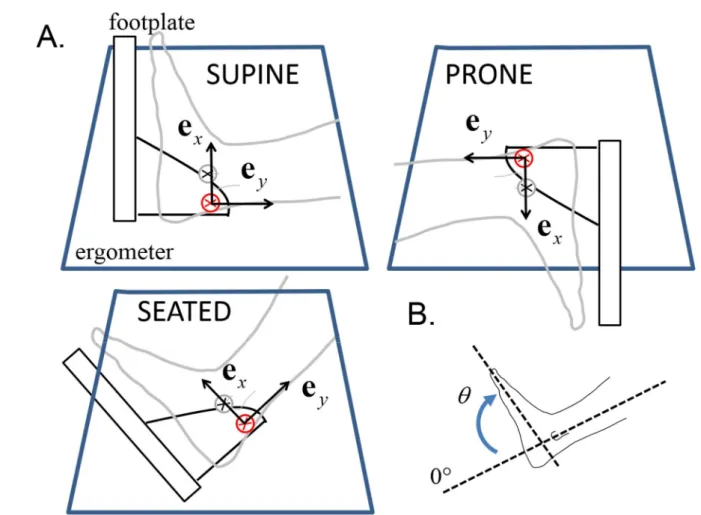
sampling frequency of 200 Hz. Ankle angle represents the angle between the vector going from 134
the calcaneous to the midpoint between 1st and 5th Metatarsal Head, and the vector going from 135
the midpoint between fibula’s head and tibiale’s tuberosity to the midpoint between the two 136
maleolli (see Figure 1). 137
Electromyographic acquisition 138
Surface EMG was recorded from 7 muscles located on the right side of the body, namely, 139
tibialis anterior (TA), soleus (Sol), gastrocnemius medialis (GM), vastus lateralis (VL), rectus 140
femoris (RF), semi tendinosus (ST) and gluteus maximus (Gmax). Prior to electrode application, 141
the skin was shaved and cleaned with alcohol to minimize impedance. Pairs of Ag-AgCl disk 142
electrodes of 8mm diameter with inter electrode-distances of 2cm were placed longitudinally 143
with respect to the underlying muscle fibers arrangement according to the recommendations of 144
Surface EMG for Non-Invasive Assessment of Muscles (SENIAM) (Hermens et al. 2000). The 145
references electrode was placed at the level of the great trochanter. EMG signals were amplified 146
(× 1000), digitized (6-400 Hz bandwidth) at a sampling rate of 1kHz (Biopac System Inc. 147
Goleta, USA), recorded and synchronized using the motion analysis system. 148
9
Conditions of MVC testing and recording 149
The ankle joint torque was acquired with the isokinetic dynamometer and digitally 150
synchronized at a sample rate of 1 kHz using the motion analysis system. During MVCs, 151
participants were positioned on the ergometer and securely stabilized by using two crossover 152
shoulder harnesses and a belt across the abdomen. The right foot was strapped securely to the 153
footplate with the ankle fixed at an angle of 90° i.e., at the neutral position with the sole of the 154
foot perpendicular to the shank, and held in place by a heel block. The axis of the dynamometer 155
was aligned with the anatomical ankle flexion-extension axis, estimated as the line passing 156
through the tips of the maleolli (Wu et al. 2002; Lundberg et al. 1989). A clear start and stop 157
signals were given. Each voluntary contraction lasted approximately 3-4 s and 1 minute of rest 158
were given between each contraction (Todd et al. 2004). Participants received no feedback of 159
their performances during the tests. 160
Positions 161
Three positions were tested, PRONE, SUPINE and SEATED. For PRONE and SUPINE 162
positions the participants were lying on the dynamometer chair with the hip and the knee fixed 163
at an angle of 0° (=full extension for both). In these positions the thigh was stabilized using a 164
belt. For the SEATED position, the chair was lifted up at an angle of 90° from the horizontal 165
and the knee and hip joints were both placed at an angle of 90°. 166
Instructions 167
For each position, MVCs were performed with two different modalities of instructions 168
named ISOL and ALL. In the isolation condition (ISOL), participants were required to produce 169
a force by rotating the footplate as hard as possible and to handle the shoulder harnesses. In this 170
condition, they were invited to use only their calf muscles. In a second condition (ALL), the 171
10
participants were invited to grip the ergometer handle and to use all the possible means to create 172
forces against the footplate. 173
Estimation of the ankle joint rotation center 174
The ankle joint rotation center was estimated using the Symmetrical Centre of Rotation 175
Estimation (SCoRE) method (Ehrig et al. 2006). Briefly, the position of the center of rotation 176
(CR) between two segments is determined by assuming a constant contact point between each 177
and use the relation 178
1 1 2 2
CR o R u o R v (equation #3) 179
where and are arbitrary points on segments #1 (the foot) and #2 (the leg), and 180
are the rotation matrix transforming the segment coordinate system (SCS) to the global 181
coordinate system and and are the vector linking respectively and to CR in the foot 182
and leg coordinate system respectively. The SCSs were defined according to Wu et al. (2002). 183
For the estimation of the CR position, participants were seated on the ergometer chair with 184
solely their right foot strapped on the footplate connected to the moment arm of the 185
dynamometer and the ankle joint was moved passively at full but comfortable range of motion 186
for about 10 flexion-extension cycles in order to localize an accurate joint center. The values of 187
and were then used to estimate the position of the CR relative to the SCSs (foot and leg) 188
in all experimental conditions. 189
Data analysis 190
EMG signals were filtered with a bandpass filter (4th order Butterworth) between 20 and 191
400 Hz. Linear envelopes for each muscle were obtained by low-pass filtering the fully rectified 192
raw EMG signals with a 9 Hz low-pass filter (2nd order Butterworth, zero lag, (Shiavi et al. 193
1998). For each condition, the averaged value between -150 ms and 150 ms around the peak 194
1
o o2 R1 R2
u v o1 o2
11
torque event was extracted (Figure 2) and then normalized by the maximal value obtained over 195
all conditions (=EMGmax). These calculations were performed for each muscle and each 196
participant independently. 197
Joint torque and kinematic data were filtered by a 15 Hz low pass filter (2nd order 198
Butterworth filter (Winter 1990)). Joint torque was corrected for gravity by subtracting the 199
baseline, and for each condition the maximal value reached over the three tries given to the 200
participant was extracted for analysis (Figure 2). 201
Statistics 202
Normality of the data has been checked using Shapiro-Wilk's tests. For normally 203
distributed data two-way repeated measure ANOVAs (instruction=ALL and ISOL × 204
position=SUPINE, PRONE and SEATED) were performed after checking for violations of 205
sphericity using Mauchly’s test. Post-hoc analyses were then performed using Bonferroni 206
method (Maxwell 1980). For non-normal distribution non parametric Friedman ANOVAs (one-207
way repeated measures ANOVA on ranks) was chosen. Wilcoxon rank sum tests associated 208
with Bonferroni-Dunn corrections were used when the null hypothesis was rejected. 209
The different biases mentioned in the introduction were rallied in kinematic deviations. 210
They include i) the ankle angle changes (in degrees) during the test due to the compliance of 211
the ergometer moment arm, deformation of the footplate and fasteners compliance; ii) the 212
alignment errors (in mm) between the axis of the dynamometer and the functional ankle joint 213
centre of rotation in horizontal and vertical axis during the rest and the MVC. Kinematic 214
deviations were compared to the reference using one-sample Student’s t-tests (reference 215
value=0). A description of the axes is given in Figure 1. 216
12
We assessed the relationships between torque and other variables (i.e., kinematic 217
deviations and EMG activity) using Pearson's correlation coefficient (r). For these analyses, 218
values of each variable and for each participant were converted to z-scores, calculated by 219
subtracting the average (over all conditions) and dividing the result by the SD. Because 220
correlation analysis is very sensitive to the presence of outliers in the data (Chatterjee and Hadi 221
1986), normality of each variable was checked and values of |z-score|>2.58 (corresponding to 222
the 99th percentile of the distribution) were discarded from the analysis (Burke 2001). All 223
available data were used (3 tries x 3 positions x 2 instructions x 16 subjects). 224
All statistical analyses were performed with the Statistica® software (Statistica®V6, 225
Statsoft, Maison-Alfort, France). Values are reported as mean ± SD for normally distributed 226
data and as median [range] instead. A p-value below .05 was considered statistically significant. 227
13
Results
228Torque 229
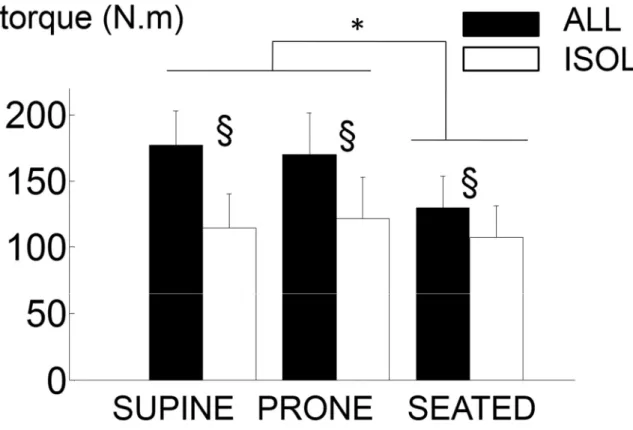
The results showed that MVCs were significantly affected by the positions (F(2,30)=13.2, 230
p<.001, ηp²=.60) and the instructions provided (F(1,15)=54.7, p<.001, ηp²=.80; Figure 3). Post-231
hoc analyses showed that MVCs were significantly greater in the SUPINE and PRONE 232
positions compared to the SEATED position (pooled data: SUPINE=146.0 ± 40.5 N.m and 233
PRONE=145.7 ± 38.9 N.m vs. SEATED=118.5 ± 31.2 N.m, p<.001). Torque was greater in the 234
ALL condition compared to the ISOL condition for each position (p<.001), corresponding to 235
gains of 43.5 [25.4 170.6]%, 42.5 [1.4 194.6]% and 15.3 [9.3 71.9]% for the SUPINE, PRONE 236
and SEATED position respectively. Gains were significantly lower in SEATED compared to 237
SUPINE (Z=3.15, p<.001) and PRONE (Z=2.43, p=.015) but were similar between SUPINE 238
and PRONE (Z=1.55, p=.121). 239
Muscle activation 240
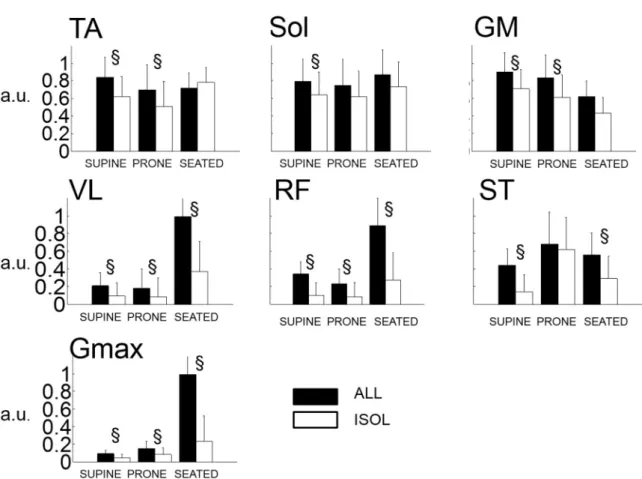
EMG variables were not normally distributed. The activity level of TA was greater in ALL 241
compared to ISOL (pooled data: ALL=89.6 [6.5 100]% vs. ISOL=65.3 [2.7 100]%, Z=3.21, 242
p=.001) but this effect was present in the SUPINE and PRONE positions only (Z=3.31, p<.001, 243
and Z=2.53, p=.011 respectively). Analysis revealed no main effect of the position on the 244
activity of TA (χ²= 4.75, p=.093; Figure 4). 245
Overall positions, Sol activity was greater in ALL compared to ISOL (ALL=85.7 [6.0 100]%) 246
vs. ISOL=66.1 [0.7 100]%, Z=2.84, p=.004) but post-hoc analysis revealed significant 247
differences in the SUPINE position only (Z=2.43, p=.015). There was no main effect of the 248
position on the activity of SOL (χ²= 2.25, p=.325). 249
14
Activity of GM was greater in ALL compared to ISOL (i.e., pooled data: ALL=88.1 [15.8 250
100]% vs. ISOL=61.5 [1.9 98.2]%; Z=4.24, p<.001). These differences held for the SUPINE 251
and PRONE positions (Z=2.84, p=.004 and Z=2.74, p=.006 respectively) but no differences 252
were found in the SEATED position (Z=1.76, p=.08). Analysis revealed a main effect of the 253
position (χ²=17.69, p<.001)i.e., GM was significantly less activated in the SEATED position 254
(=49.9 [15.3 100]%,) compared to the PRONE (=79.4 [1.9 100]%., Z=3.78, p<.001) and 255
SUPINE (=0.83 [0.09 1]%, Z=3.72, p<.001) positions. 256
ST was maximally activated in the PRONE position in 10 out of 16 participants. The activity 257
of ST was significantly higher in ALL compared to ISOL in SUPINE (Z=3.46, p<.001) and 258
SEATED (Z=3.00, p=.003), but no differences were found in the PRONE position (Z=0.67, 259
p=.502).A main effect of the position was found (χ²=6.94 p =.03116) i.e., there was higher ST 260
activity in the PRONE position but differences were significant only when compared to the 261
SUPINE's (i.e., pooled data=74.6 [3.6 100]% vs. 8.0 [0.8 100]%,Z=3.22, p=.001). 262
VL, RF and Gmax activities possess the same patterns among the experimental conditions and 263
were maximally activated in the SEATED position in most participants i.e., in 15, 13 and 15 264
out-of 16 participants respectively (Figure 4). Friedman ANOVA confirmed the effect of 265
position on VL, RF and Gmax (VL: χ²= 31.75, p<.001; RF: χ²= 17.44, p<.001; Gmax: χ²= 38.31, 266
p<.001). These muscles were significantly more activated in the SEATED compared to the 267
SUPINE and PRONE positions (merged values in SEATED position: VL=97.1 [1.4 100]%, 268
RF=62.5 [0.6 100]% and Gmax=90.7 [1.3 100]%) vs. SUPINE + PRONE: VL=6.2 [0.3 90.5]%, 269
RF=6.8 [0.3 100]% and Gmax=5.1 [0.4 54.9]%, Wilcoxon Z-values ranged from 3.23 to 4.75, 270
p<.001). Analyses indicated that the activity of VL, RF and Gmax were greater in the ALL 271
compared to the ISOL condition in the 3 positions tested (Wilcoxon Z-values and p-values 272
ranged from Z=2.84, p=.004 to Z=3.51, p<.001; Figure 4). 273
15
Kinematic deviations 274
Kinematic results and statistics are summarized in Table 1. During MVCs the ankle joint angle 275
varied of -9.73 ± 4.15° in average i.e., from 91.0 ± 5.2° to 81.3 ± 4.9° overall conditions. From 276
rest to MVC and overall conditions, the CR varied on e of ΔX=+14.8 ± 8.0mm (i.e., from x 277
Xrest=9.7 ± 22.1mm to XMVC=24.7 ± 24.6mm) and of ΔY=-0.71 ± 9.6mm on ey (i.e., from 278
Yrest=3.9 ± 13.1mm to YMVC=3.0 ± 15.0mm). 279
Correlations 280
All the results on correlation analyses are summarized in Table 2 and indicated that torque was 281
significantly correlated with the activity of the plantar flexors in each position. VL, RF, ST and 282
kinematic variables (ΔY and the variation in joint angle, Δθ) were found to be significantly 283
related to torque depending on the position and on the instruction (see Table 2). 284
16
Discussion
285The aim of this study was to point out the differences in torque output during maximal voluntary 286
contraction (MVC) in isometric plantarflexion when activating either isolated or global muscle 287
(conditions named ISOL and ALL respectively). The ALL condition was associated with higher 288
EMG activities in most of the recorded muscles, notably in plantarflexor muscles, and was 289
associated with higher joint torque compared to ISOL. 290
Very large differences were observed between ALL and ISOL, with gains on joint torque 291
of about 40% in average (Figure 3). Lower torque in seated position could be attributable to 292
muscle mechanics, i.e., force-length relationships (Maganaris 2003), and to impairments in 293
motor units recruitment, as already reported for this particular joint angle configuration (i.e., 294
knee and ankle joint angles set at 90°of flexion) (Cresswell et al. 1995; Kennedy and Cresswell 295
2001). In mine with our findings, a previous study showed that plantarflexion torque could be 296
significantly enhanced (~+26%) in multi-joint compared to isolated plantar flexion (Hahn et al. 297
2011). However, this study remained inconclusive regarding the differences in EMG activity 298
resulting from these two conditions and used different methodologies to assess joint torque in 299
the multi-joint and isolated contractions, i.e., they used inverse dynamic calculations and 300
ergometer measurements, that proved to provide different results (Herzog 1988; Kaufman et al. 301
1995; Arampatzis et al. 2004). Sasaki et al.(1998) observed an increase in plantarflexion torque 302
linked to jaw clenching, but the conclusions relied on integrated electromyographic activity per 303
unit of time rather than EMG level, and did not check for the influence of mechanical factors, 304
as they focused on jaw clenching only. 305
Interestingly, the value of 40% found in the present study fits well to differences with that 306
observed in similar studies examining ankle MVC, that is, values ranging from 134 up to 186 307
17
N.m, despite similar populations and protocols (Danneskiold‐Samsøe et al. 2009; Cresswell et 308
al. 1995; Maganaris 2003). More precisely, considering isometric plantarflexion MVCs in the 309
supine and prone positions, and a population of young male adults, literature reports MVC 310
values ranging from ~134 N.m [e.g. 142 ± 42 , N=10 (Danneskiold‐Samsøe et al. 2009) or 134 311
± 23 N.m , N=10 (Cresswell et al. 1995)] up to ~186 N.m [e.g. 172 ± 15 , N=8 (Maganaris 312
2003) or 186 ± 28 N.m (N=9) (Hahn et al. 2011)]. These differences may pertain to differences 313
in the participants’ fitness (i.e., more or less trained participants), but the results suggest that an 314
explanation also bears on the nature of the instructions (ALL vs. ISOL). 315
Mechanical factors 316
Misalignment has been shown to induce bias of ~10% in the estimation of joint torque 317
(Arampatzis et al. 2007; Deslandes et al. 2008), but this factor is not expected to create large 318
differences among studies, as the positioning of the foot is expected to be carefully executed 319
Given the equation #1, positive deviations of CR in the x-direction, that decreases ankle dynamometer
r
r ,
320
decreases the effectiveness of the ankle torque. The misalignments observed in this study on 321
the X-axis are positive and then, they are not likely to explain the gains in torque. Nevertheless, 322
misalignments may allow the auxiliary muscles, through joint reaction forces transmission, to 323
influence the ankle torque. 324
One can first observe that positioning have an effect on the activity of knee extensors, knee 325
flexors and hip extensors muscles (Figure 4). For example, the seated position was associated 326
with higher level of activity for VL, RF and Gmax and the prone position was associated with 327
higher ST activity (Figure 4) but the correlation values between these muscles and the torque 328
produced remained modest (Table 2), suggesting that the mechanical influence of these muscles 329
is small. Furthermore, despite the fact that differences were observed in ST activity between 330
18
PRONE and SUPINE, no differences were found in torque between these two positions. 331
Additionally, the large increase in Gmax, VL and RF activity (Figure 4) did not preclude to the 332
force deficit associated with the seated position (Figure 3). As a consequence, no major 333
mechanical influence of these muscles is expected on the produced torque. Notwithstanding, at 334
least two observations forbid ruling out the influence of such forces. Firstly, despite significant 335
and positive correlations of the activity of Sol and GM with torque in the seated position (Table 336
2), the increase in torque was not associated with significant increases in the activity of these 337
muscles i.e., SOL (p=.255) and GM (p=.079). And in this particular position, VL, RF and ST 338
were also correlated with torque (Table 2). These observations strongly suggest that the forces 339
created by muscles that do not span over the ankle joint significantly influenced the measured 340
joint torque, at least in the seated position. Secondly, provided that torque is mainly related to 341
plantarflexor activity, as the relation between EMG and torque tends to be convex toward 342
tension at high force levels (Perry and Bekey 1981; Lawrence and De Luca 1983), a given 343
increase in torque in this portion of the curve should have been associated with a larger increase 344
in EMG and not with a similar one (Figure 3 and Figure 4). Suggesting that even in the supine 345
and prone positions, plantarflexors are not the sole contributors of the increase in torque. 346
Neural factors 347
What can explain the higher muscle activity level in ALL compared to ISOL observed in this 348
study? First, motivation is not likely to explain the differences observed between ALL and 349
ISOL. Although motivation has not been explicitly assessed in this study, differences in 350
motivation are not expected, because the tests were randomized. Additionally, we found high 351
reliability between the 3 trials within all the conditions tested, with an average correlation 352
coefficient of .95 (range=[.90 .98]; model corresponding to case #1 in McGraw et al. (1996)) 353
and an average coefficient of variation of 5.8% (range=[3.2 8.2]). These reliability values are 354
19
highly consistent with previous reports testing MVCs in plantarflexion (Webber and Porter 355
2010; Todd et al. 2004; Sleivert and Wenger 1994) and can be taken as evidences that MVC 356
testing conditions carried out here can be truly compared to those imposed in previous studies. 357
As a consequence, the lower values observed in ISOL are not likely to be due to a lack of 358
motivation from the participants. 359
In ALL, participants were allowed to grasp the ergometer, which is not generally allowed in 360
studies measuring ankle MVCs (cf. a representative setup in Figure #1 of Simoneau et al, 361
(2009), so that concurrent activation potentiation could be induced (Ebben et al. 2008a; Ebben 362
et al. 2010; Cherry et al. 2010; Ebben et al. 2008b). Jaw clenching or Valsalva maneuver have 363
been reported to improve the level of maximal activation of the contracting muscles (Ebben et 364
al. 2008b; Sasaki et al. 1998). However, most of these studies focused on the knee extensors 365
muscles (Ebben et al. 2008b; Ebben et al. 2010), and not on plantarflexors. Furthermore, 366
improvements in peak torque due to jaw clenching and Valsalva maneuver have been reported 367
to be of ~15% for the quadriceps muscles (Ebben et al. 2008b; Ebben et al. 2010), that is, far 368
less than the differences observed in the present study (i.e., ~40%). This may suggest a 369
particular sensitivity of the plantarflexors to the phenomenon. In fact, contrary to other muscles 370
such as elbow flexors (Herbert et al. 1998) or ankle dorsiflexors (Kent-Braun et al. 2002), 371
activation of plantarflexor muscles is rarely complete (Todd et al. 2004; Cresswell et al. 1995). 372
Without training or adequate testing conditions, plantarflexor muscles are not maximally 373
activated by volition, and only reach about 80-90% of voluntary activation (Cresswell et al. 374
1995; Maffiuletti et al. 2002). This is in line with the finding that the neural drive to these 375
muscles can be significantly improved by a strength training (Shield and Zhou 2004) or 376
imagined strength training (Zijdewind et al. 2003; Sidaway and Trzaska 2005), whereas such 377
is not the case for the elbow flexors, for example which possess a high initial level of voluntary 378
20
activation (Herbert et al. 1998). The work of Devanne and collaborators (Devanne et al. 2002; 379
Kouchtir-Devanne et al. 2012) is particularly interesting in this respect. They observed that the 380
excitability of the cortical neurons associated with the first dorsal interosseus was lower during 381
isolated (contraction of first dorsal interosseus only) vs. global muscle contractions (precision 382
grip implying the thumb and the finger). This indicates that the cortical excitability of a given 383
muscle depends on its functional interconnections at the cortical level. These findings support 384
the idea that isolated contractions, which explicitly or implicitly (through instructions) require 385
a selection of the contracting muscles, may induce inhibition, incompatible with the objectives 386
of MVC testing. Allowing global muscle activation or not is then a critical aspect of the 387
instructions 388
Conclusions 389
This study reports that activation of plantarflexor muscles are superior during global muscle 390
activation compared to isolated joint contraction, entailing very large differences in motor-391
output. It emphasizes the pertinence of using isolated vs. unconstrained MVC testing protocols, 392
notably for muscles that are not maximally activated by volition. 393
21
References
394Arampatzis A, De Monte G, Morey-Klapsing G (2007) Effect of contraction form and 395
contraction velocity on the differences between resultant and measured ankle joint 396
moments. Journal of biomechanics 40 (7):1622-1628 397
Arampatzis A, Karamanidis K, De Monte G, Stafilidis S, Morey-Klapsing G, Brüggemann G-398
P (2004) Differences between measured and resultant joint moments during voluntary 399
and artificially elicited isometric knee extension contractions. Clinical biomechanics 19 400
(3):277-283 401
Barry B, Riley Z, Pascoe M, Enoka R (2008) A spinal pathway between synergists can modulate 402
activity in human elbow flexor muscles. Experimental Brain Research 190 (3):347-359 403
Burke S (2001) Missing values, outliers, robust statistics & non-parametric methods. LC-GC 404
Europe Online Supplement, Statistics & Data Analysis 2:19-24 405
Chatterjee S, Hadi AS (1986) Influential observations, high leverage points, and outliers in 406
linear regression. Statistical Science 1 (3):379-393 407
Cherry EA, Brown LE, Coburn JW, Noffal GJ (2010) Effect of remote voluntary contractions 408
on knee extensor torque and rate of velocity development. Journal of Strength and 409
Conditioning Research 24 (9):2564-2569 410
Cresswell AG, Löscher W, Thorstensson A (1995) Influence of gastrocnemius muscle length 411
on triceps surae torque development and electromyographic activity in man. 412
Experimental brain research 105 (2):283-290 413
Danneskiold‐Samsøe B, Bartels E, Bülow P, Lund H, Stockmarr A, Holm C, Wätjen I, 414
Appleyard M, Bliddal H (2009) Isokinetic and isometric muscle strength in a healthy 415
population with special reference to age and gender. Acta Physiologica 197 (s673):1-68 416
De Ruiter CJ, Hoddenbach JG, Huurnink A, De Haan A (2008) Relative torque contribution of 417
vastus medialis muscle at different knee angles. Acta Physiologica 194 (3):223-237. 418
Deslandes S, Mariot J-P, Serveto S (2008) Offset of rotation centers creates a bias in isokinetics: 419
A virtual model including stiffness or friction. Journal of biomechanics 41 (10):2112-420
2120. 421
Devanne H, Cohen LG, Kouchtir-Devanne N, Capaday C (2002) Integrated Motor Cortical 422
Control of Task-Related Muscles During Pointing in Humans. Journal of 423
Neurophysiology 87 (6):3006-3017 424
Drouin JM, Valovich-mcLeod TC, Shultz SJ, Gansneder BM, Perrin DH (2004) Reliability and 425
validity of the Biodex system 3 pro isokinetic dynamometer velocity, torque and 426
position measurements. European journal of applied physiology 91 (1):22-29 427
Ebben WP (2006) A brief review of concurrent activation potentiation: theoretical and practical 428
constructs. Journal of Strength and Conditioning Research 20 (4):985-991. 429
Ebben WP, Flanagan EP, Jensen RL (2008a) Jaw clenching results in concurrent activation 430
potentiation during the countermovement jump. Journal of Strength and Conditioning 431
Research 22 (6):1850-1854. 432
Ebben WP, Leigh DH, Geiser CF (2008b) The effect of remote voluntary contractions on knee 433
extensor torque. Medicine & Science in Sports & Exercise 40 (10):1805-1809. 434
Ebben WP, Petushek EJ, Fauth ML, Garceau LR (2010) EMG analysis of concurrent activation 435
potentiation. Medicine & Science in Sports & Exercise 42 (3):556-562. 436
Ehrig RM, Taylor WR, Duda GN, Heller MO (2006) A survey of formal methods for 437
determining the centre of rotation of ball joints. Journal of biomechanics 39 (15):2798-438
2809 439
22
Gandevia SC (2001) Spinal and Supraspinal Factors in Human Muscle Fatigue. Physiological 440
Reviews 81 (4):1725-1789 441
Hahn D, Olvermann M, Richtberg J, Seiberl W, Schwirtz A (2011) Knee and ankle joint torque– 442
angle relationships of multi-joint leg extension. Journal of biomechanics 44 (11):2059-443
2065 444
Herbert R, Dean C, Gandevia S (1998) Effects of real and imagined training on voluntary 445
muscle activation during maximal isometric contractions. Acta Physiologica 446
Scandinavica 163 (4):361-368 447
Hermens HJ, Freriks B, Disselhorst-Klug C, Rau G (2000) Development of recommendations 448
for SEMG sensors and sensor placement procedures. Journal of Electromyography and 449
Kinesiology 10 (5):361-374 450
Herzog W (1988) The relation between the resultant moments at a joint and the moments 451
measured by an isokinetic dynamometer. Journal of biomechanics 21 (1):5-12 452
Hicks J (1953) The mechanics of the foot: I. The joints. Journal of Anatomy 87 (Pt 4):345 453
Horak FB, Shupert CL, Mirka A (1989) Components of postural dyscontrol in the elderly: a 454
review. Neurobiology of aging 10 (6):727-738 455
Kaufman KR, An K-N, Chao E (1995) A comparison of intersegmental joint dynamics to 456
isokinetic dynamometer measurements. Journal of biomechanics 28 (10):1243-1256 457
Kennedy P, Cresswell A (2001) The effect of muscle length on motor-unit recruitment during 458
isometric plantar flexion in humans. Experimental brain research 137 (1):58-64 459
Kent-Braun JA, Ng AV, Doyle JW, Towse TF (2002) Human skeletal muscle responses vary 460
with age and gender during fatigue due to incremental isometric exercise. Journal of 461
Applied Physiology 93 (5):1813-1823 462
Klass M, Baudry S, Duchateau J (2008) Age-related decline in rate of torque development is 463
accompanied by lower maximal motor unit discharge frequency during fast 464
contractions. Journal of Applied Physiology 104 (3):739-746 465
Kouchtir-Devanne N, Capaday C, Cassim Fo, Derambure P, Devanne H (2012) Task-dependent 466
changes of motor cortical network excitability during precision grip compared to 467
isolated finger contraction. Journal of Neurophysiology 107 (5):1522-1529. 468
Lawrence JH, De Luca C (1983) Myoelectric signal versus force relationship in different human 469
muscles. Journal of Applied Physiology 54 (6):1653-1659 470
Lundberg A, Svensson O, Nemeth G, Selvik G (1989) The axis of rotation of the ankle joint. 471
Journal of Bone & Joint Surgery, British Volume 71 (1):94-99 472
Maffiuletti NA, Pensini M, Martin A (2002) Activation of human plantar flexor muscles 473
increases after electromyostimulation training. Journal of Applied Physiology 92 474
(4):1383-1392 475
Maganaris CN (2003) Force‐length characteristics of the in vivo human gastrocnemius muscle. 476
Clinical anatomy 16 (3):215-223 477
Maxwell SE (1980) Pairwise multiple comparisons in repeated measures designs. Journal of 478
Educational and Behavioral Statistics 5 (3):269-287 479
McGraw KO, Wong S (1996) Forming inferences about some intraclass correlation 480
coefficients. Psychological methods 1 (1):30 481
McNeil CJ, Vandervoort AA, Rice CL (2007) Peripheral impairments cause a progressive age-482
related loss of strength and velocity-dependent power in the dorsiflexors. Journal of 483
Applied Physiology 102 (5):1962-1968 484
Moraux A, Canal A, Ollivier G, Ledoux I, Doppler V, Payan C, Hogrel J-Y (2013) Ankle dorsi-485
and plantar-flexion torques measured by dynamometry in healthy subjects from 5 to 80 486
years. BMC musculoskeletal disorders 14 (1):104 487
23
Perry J, Bekey GA (1981) EMG-force relationships in skeletal muscle. Critical Reviews in 488
Biomedical Engineering 7 (1):1-22 489
Ramos MU, Knapik J (1978) Instrumentation and techniques for the measurement of muscular 490
strength and endurance in the human body. DTIC Document 491
Sasaki Y, Ueno T, Taniguchi H, Ohyama T (1998) Effect of teeth clenching on isometric and 492
isokinetic strength of ankle plantar flexion. Journal of medical and dental sciences 45 493
(1):29 494
Shiavi R, Frigo C, Pedotti A (1998) Electromyographic signals during gait: criteria for envelope 495
filtering and number of strides. Med Biol Eng Comput 36 (2):171-178 496
Shield A, Zhou S (2004) Assessing Voluntary Muscle Activation with the Twitch Interpolation 497
Technique. Sports Medicine 34 (4):253-267. 498
Sidaway B, Trzaska A (2005) Can Mental Practice Increase Ankle Dorsiflexor Torque? 499
Physical therapy 85 (10):1053-1060 500
Simoneau E, Martin A, Van Hoecke J (2007) Effects of joint angle and age on ankle dorsi-and 501
plantar-flexor strength. Journal of Electromyography and Kinesiology 17 (3):307-316 502
Simoneau EM, Billot M, Martin A, Van Hoecke J (2009) Antagonist mechanical contribution 503
to resultant maximal torque at the ankle joint in young and older men. Journal of 504
Electromyography and Kinesiology 19 (2):e123-e131 505
Sleivert GG, Wenger HA (1994) Reliability of measuring isometric and isokinetic peak torque, 506
rate of torque development, integrated electromyography, and tibial nerve conduction 507
velocity. Archives of physical medicine and rehabilitation 75 (12):1315-1321 508
Todd G, Gorman RB, Gandevia SC (2004) Measurement and reproducibility of strength and 509
voluntary activation of lower limb muscles. Muscle & nerve 29 (6):834-842 510
Van Cutsem M, Duchateau J, Hainaut K (1998) Changes in single motor unit behaviour 511
contribute to the increase in contraction speed after dynamic training in humans. The 512
Journal of Physiology 513 (1):295-305 513
Webber SC, Porter MM (2010) Reliability of ankle isometric, isotonic, and isokinetic strength 514
and power testing in older women. Physical therapy 90 (8):1165-1175 515
Winter DA (1990) Biomechanics and motor control of human movement. Wiley, New York 516
Wu G, Siegler S, Allard P, Kirtley C, Leardini A, Rosenbaum D, Whittle M, D’Lima DD, 517
Cristofolini L, Witte H (2002) ISB recommendation on definitions of joint coordinate 518
system of various joints for the reporting of human joint motion—part I: ankle, hip, and 519
spine. Journal of biomechanics 35 (4):543-548 520
Zijdewind I, Toering ST, Bessem B, van der Laan O, Diercks RL (2003) Effects of imagery 521
motor training on torque production of ankle plantar flexor muscles. Muscle & Nerve 522
28 (2):168-173 523
524 525
24
Tables 526
SUPINE PRONE SEATED
ALL ISOL ALL ISOL ALL ISOL
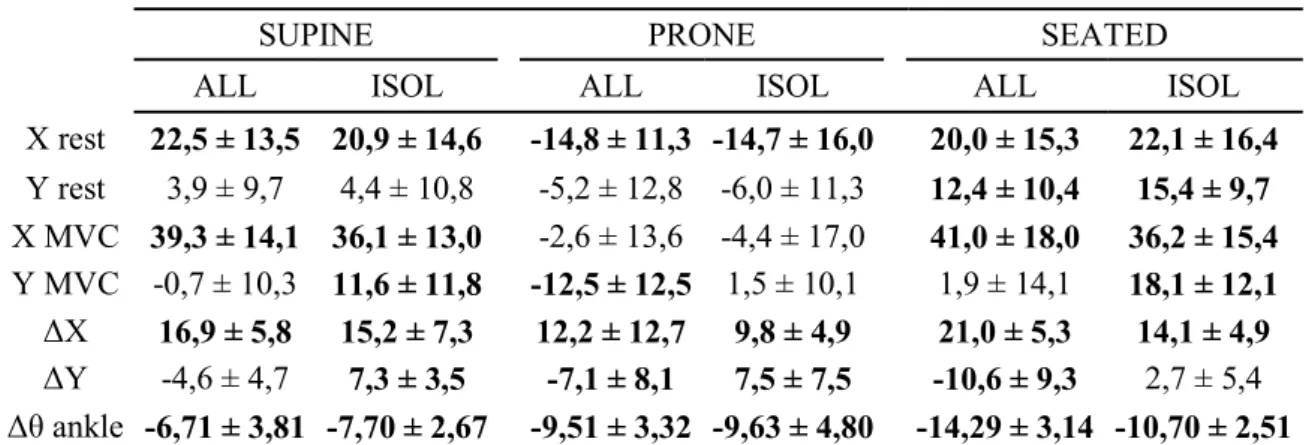
X rest 22,5 ± 13,5 20,9 ± 14,6 -14,8 ± 11,3 -14,7 ± 16,0 20,0 ± 15,3 22,1 ± 16,4 Y rest 3,9 ± 9,7 4,4 ± 10,8 -5,2 ± 12,8 -6,0 ± 11,3 12,4 ± 10,4 15,4 ± 9,7 X MVC 39,3 ± 14,1 36,1 ± 13,0 -2,6 ± 13,6 -4,4 ± 17,0 41,0 ± 18,0 36,2 ± 15,4 Y MVC -0,7 ± 10,3 11,6 ± 11,8 -12,5 ± 12,5 1,5 ± 10,1 1,9 ± 14,1 18,1 ± 12,1 ΔX 16,9 ± 5,8 15,2 ± 7,3 12,2 ± 12,7 9,8 ± 4,9 21,0 ± 5,3 14,1 ± 4,9 ΔY -4,6 ± 4,7 7,3 ± 3,5 -7,1 ± 8,1 7,5 ± 7,5 -10,6 ± 9,3 2,7 ± 5,4 Δθ ankle -6,71 ± 3,81 -7,70 ± 2,67 -9,51 ± 3,32 -9,63 ± 4,80 -14,29 ± 3,14 -10,70 ± 2,51
Table 1. Kinematic variables. X and Y are the position of the ankle joint (estimated by the 527
SCoRe method) relative to the axis of rotation of the dynamometer in the x-direction and y-528
direction at rest (X rest and Y rest) and at the peak torque event (X MVC and. Y MVC), given 529
in mm. ΔX = X MVC- X rest, and ΔY =Y MVC- Y rest. Δθ is the difference in joint angle in 530
degree between MVC and rest, in degree. Bolded values indicate a significant difference from 531
0 (t-test for single mean; p<.05).Values are given as mean ± SD. 532
533
SUPINE PRONE SEATED
torque vs. ISOL ALL ISOL ALL ISOL ALL
TA 0.10 0.55** 0.29 0.67** 0.29 0.10 Sol -0.11 0.42** 0.41* 0.64** 0.59** 0.18 GM 0.40* 0.16 0.30 0.57** 0.42* 0.55** VL -0.28 -0.11 0.22 0.25 0.38* 0.35* RF -0.24 -0.10 0.19 0.34* 0.24 0.16 ST 0.31* 0.16 0.17 0.00 0.54** 0.27 Gmax -0.29 -0.19 0.22 0.19 0.16 0.04 ΔX 0.17 0.01 0.23 0.03 0.27 0.24 ΔY 0.30* -0.17 -0.08 -0.24 -0.06 -0.29 Δθ -0.07 0.21 -0.28 -0.21 -0.26 -0.37* N 46 47 36 37 42 37
Table 2. Correlation coefficients. N refers to the number of values used to compute the 534
Pearson's r. Bolded values indicate significant correlations (*:p<.05;**:p<0.001). 535
536 537
25
Figures 538
539
Figure 1. Position of the foot relative to the ergometer. A. The circled red cross designs the 540
ergometer axis of rotation and the circled black cross the ankle axis of rotation (=CR). In all 541
positions, the X-axis associated with the vector e is the axis parallel to the footplate and x 542
pointing toward the participant toes and the Y-axis asociated with the vector ey is the axis
543
orthogonal to it and pointing toward the participant leg. The origin is centered at the level of 544
the ergometer axis of rotation. B. Definition of the ankle angle (θ). 545
546 547 548
26
549 550
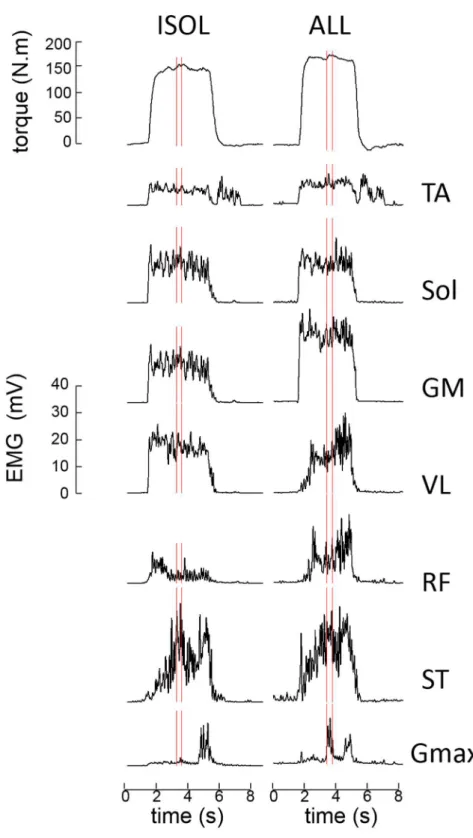
Figure 2. Example of torque and EMG data for a typical participant. Condition = supine 551
position. Smoothed torque and EMG envelope are processed as indicated in section Data 552
analysis. Vertical lines indicate the region around peak torque used for analysis.: tibialis 553
anterior. SOL: soleus. GM: gastrocnemius medialis VL: vastus lateralis. RF: rectus femoris. 554
ST: semi tendinosus. Gmax: gluteus maximus. 555
27
556
Figure 3. Torque data. Bars represent the mean and error-bars one SD. § indicates a significant 557
difference (p<.05) between ALL and ISOL. * indicates a significant difference between 558
[SUPINE and PRONE] vs. SEATED (p<.05). See section RESULTS for details. 559
560 561
28
562
Figure 4. Normalized EMG activities. Bars represent the mean and error-bars one SD. § 563
indicates a significant difference (p<.05) between ALL and ISOL. 564