SOIL MICROBIOLOGY
Does the Aboveground Herbivore Assemblage Influence Soil
Bacterial Community Composition and Richness in Subalpine
Grasslands?
Melanie Hodel&Martin Schütz&Martijn L. Vandegehuchte&
Beat Frey&Matthias Albrecht&Matt D. Busse&Anita C. Risch
Received: 24 January 2014 / Accepted: 9 May 2014 / Published online: 3 June 2014 # Springer Science+Business Media New York 2014
Abstract Grassland ecosystems support large communities of aboveground herbivores that are known to directly and indirectly affect belowground properties such as the microbial community composition, richness, or biomass. Even though multiple species of functionally different herbivores coexist in grassland ecosystems, most studies have only considered the impact of a single group, i.e., large ungulates (mostly domes-tic livestock) on microbial communities. Thus, we investigat-ed how the exclusion of four groups of functionally different herbivores affects bacterial community composition, richness, and biomass in two vegetation types with different grazing histories. We progressively excluded large, medium, and small mammals as well as invertebrate herbivores using exclosures at 18 subalpine grassland sites (9 per vegetation type). We assessed the bacterial community composition using terminal restriction fragment length polymorphism (T-RFLP) at each site and exclosure type during three consecutive growing seasons (2009–2011) for rhizosphere and mineral soil sepa-rately. In addition, we determined microbial biomass carbon
(MBC), root biomass, plant carbon:nitrogen ratio, soil tem-perature, and soil moisture. Even though several of these variables were affected by herbivore exclusion and vegetation type, against our expectations, bacterial community composi-tion, richness, or MBC were not. Yet, bacterial communities strongly differed between the three growing seasons as well as to some extent between our study sites. Thus, our study indicates that the spatiotemporal variability in soil microcli-mate has much stronger effects on the soil bacterial commu-nities than the grazing regime or the composition of the vegetation in this high-elevation ecosystem.
Introduction
Grasslands cover approximately one third of the terrestrial
landscape [1] and support a large community of aboveground
vertebrate and invertebrate herbivores [2]. Herbivores can, in
turn, be key determinants and regulators of grassland process-es: besides altering aboveground biomass and plant species
composition [e.g., 3–7], grazing by herbivores can directly
and indirectly affect belowground properties. Direct impacts such as trampling can alter soil structure and permeability
(e.g., bulk density or aeration; [8]), whereas the deposition
of organic matter and nutrients in the form of dung and urine
may stimulate root and microbial activity [9]. Thus, nitrogen
(N) availability may be enhanced as nutrients ingested by
herbivores are directly returned to the soil, “short-cutting”
the nutrient cycle [10]. In addition, removal of aboveground
biomass can indirectly lead to alterations in soil temperature or
soil moisture [9,11], which in turn can influence microbial
activity and therefore decomposition of organic material. Her-bivory can also alter physiological properties of plants such as C allocation between shoots and roots or the flow of C from
the roots into the soil (root exudation; [11,12]), which in turn
M. Hodel
:
M. Schütz:
M. L. Vandegehuchte:
B. Frey:
M. Albrecht:
A. C. Risch (*)Swiss Federal Institute of Forest, Snow and Landscape Research WSL, Zuercherstrasse 111, 8903 Birmensdorf, Switzerland e-mail: [email protected]
M. Hodel
Bureau for Agriculture and Environment State of Obwalden, Department Environment, St. Antonistrasse 4, 6060 Sarnen, Switzerland
M. Albrecht
Agroscope, Institute for Sustainability Sciences, Reckenholzstrasse 191, 8046 Zuerich, Switzerland
M. D. Busse
USDA Forest Service, Pacific Southwest Research Station, 3644 Avtech Parkway, Redding, CA 96002, USA
can stimulate microbial biomass and activity in the
rhizosphere [13].
Furthermore, over longer time frames, herbivores can in-fluence plant community composition by altering competitive interactions between plant species. This generally leads to an increase in the abundance of plant species with better defense against herbivory, e.g., to plant communities dominated by species with increased fiber or secondary metabolite content. As a consequence, the organic material entering the soil subsystem is of poorer resource quality, which retards soil
processes [e.g., mineralization;10,11]. Additionally, it has
been shown that the effect of herbivores on grassland proper-ties highly depends on the grazing intensity (plant biomass
consumption) as well as the productivity of the system [11].
Generally, it has been suggested that grazers have a positive effect on soil biota and soil processes in productive ecosys-tems in combination with high grazing intensities, while a negative effect is expected in systems with low productivity
[see11].
Consequently, the direct and indirect top-down effects on plants outlined above can induce bottom-up feedback-loops, since microorganisms are involved in a wide variety of eco-system processes (e.g., nutrient mineralization). Thus, to un-derstand feedback mechanisms within grassland ecosystems, it is important to link aboveground with belowground
proper-ties [11]. Many studies have assessed direct and indirect
impacts of aboveground herbivores on soil processes
(e.g., nutrient cycling: [14,15]; decomposition: [9,16]) or
described the relation between grazing animals and microbes
by investigating shifts in bacteria: fungi ratios [17–19].
Con-siderably, less is known on how herbivores affect bacterial community composition or richness. From the few conducted studies, it can be hypothesized that grazing can induce
chang-es in bacteria functional groups [10,20–22]. However, most
studies only considered the impact of a single functional group of herbivores (usually large ungulates or domestic livestock
[7, 10, 21], seldom other herbivores such as grasshoppers
[23]) on microbial communities even though several species,
groups, or taxa of functionally different herbivores of various body sizes generally coexist in a grassland ecosystem.
Given this lack of information, the objective of this study was to investigate how the exclusion of four groups of func-tionally different herbivores affects bacterial community com-position, richness, and microbial biomass carbon (MBC) in two vegetation types that feature different grazing histories (and productivity) in the Swiss Alps—historically heavily grazed, rather nutrient-rich short-grass vegetation (further
re-ferred to as“short-grass vegetation” and historically lightly
grazed, poorer quality tall-grass vegetation (“tall-grass
vege-tation”). More specifically, we investigated how one, two, and
three growing seasons of progressive exclusion of large, me-dium, and small mammals and invertebrates affected the community composition and richness of bacteria in the
rhizosphere and mineral soil using T-RFLP analyses as well as MBC (as a proxy for abundance) in these two vegetation types. In addition, we assessed how differences in bacterial parameters were related to abiotic and biotic variables (soil temperature, soil moisture, root biomass, and plant tissue C:N ratios). We expected distinct differences in bacterial commu-nity composition, richness, and MBC between the two vege-tation types and greater shifts due to the exclusion of larger compared to smaller herbivores. This expectation was based on the fact that larger herbivores recycle more plant material through consumption and defecation compared to the smaller ones. We expected the differences in all variables to be more pronounced in the short-grass vegetation, as this vegetation type is generally grazed with greater intensity.
Material and Methods Study Area
The study was conducted in the Swiss National Park (SNP) located in the southeastern Alps of Switzerland. Forests cover
50 km2of the park, grasslands 36 km2, while the other half of
the park area is covered with unproductive screed slopes, cliffs, and perpetual snow. Elevation ranges from 1,400 to 3,174 m above sea level. Founded in 1914, the SNP promotes a functionally diverse and easily observable grazer communi-ty since human disturbance is minimized (no hunting, fishing, or camping; visitors are not allowed to leave the trails). Mean annual temperature in the study region is 0.6±0.6 °C and mean annual precipitation is 871±156 mm (mean ± SD; recorded at the park’s weather station in Buffalora, 1,977 m
above sea level; [24]).
The subalpine grasslands are characterized by large homo-geneous patches of short- and tall-grass vegetation. Short-grass patches are much smaller (up to 3 ha) and surrounded by extensive areas of tall-grass vegetation. Short-grass vege-tation developed around former stables and huts where cattle and sheep were pastured at night (net nutrient import) during agricultural land-use (from fifteenth century until 1914). Tall-grass vegetation represents the areas where cattle and sheep
used to graze during the day (net nutrient export) [25,26].
Today, wild ungulates, medium and small mammals, as well as invertebrates graze on both vegetation types. The nutrient-rich short-grass vegetation is intensively grazed (up to 85 % of plant biomass consumed), while the tall-grass vegetation is characterized by significantly lower consumption rates
(approximately 20 %; [26]), due to lower forage quality
(lower phosphorus content [26] and N content [27]).
Conse-quently, the average vegetation height of the short-grass veg-etation typically ranges from 2 to 5 cm, and is dominated by red fescue (Festuca rubra L.), quaking grass (Briza media L.) and common bent grass (Agrostis tenuis Sipthrob). The
tall-grass vegetation exceeds 20 cm in height and is dominated by tussocks of evergreen sedge (Carex sempervirens Vill.) or mat
grass (Nardus stricta L., [26]). The herbivore community
grazing on these grasslands can be assigned to four function-ally different groups also featuring different body masses: large [red deer (Cervus elaphus L.) and chamois (Rupricapra rupricapra L.); 30–150 kg], medium [marmot (Marmota marmota L.) and snow hare (Lepus timidus L.); 3–6 kg], and small vertebrate herbivores (small rodents: e.g., Clethrionomys spp., Microtus spp., Apodemus spp., 30–100 g) and inverte-brate herbivores (mainly grasshoppers, aphids, thrips, and leafhoppers <5 g).
Experimental Design
Five exclosure treatments were set up in spring 2009 (imme-diately after snowmelt) at each of 18 sites in subalpine grass-lands (9 on short-grass, 9 on tall-grass vegetation) ranging from 1,975 to 2,300 m above sea level. All grassland sites were located on dolomite parent material. These treatments consisted of five 2×3 m sized plots—four fenced plots that gradually excluded the different herbivore groups listed above—and a plot that was not fenced and thus accessible to all herbivore groups (“All” plot). This plot was located at least 5 m from the 2.1-m tall and 7×9-m sized main fence sur-rounding the other four plots. The fence was constructed of 10 × 10 cm wooden posts and electrical equestrian tape (AGRARO ECO, Landi, Bern, Switzerland; 20-mm width that was mounted at heights of 0.7, 0.95, 1.2, 1.5, and 2.1 m) connected to a solar-charged battery (AGRARO Sunpower S250, Landi, Bern, Switzerland). An additional tape was mounted at a height of 0.5 m, which was not connected to the power source, allowing marmots and hares
to enter, while excluding deer and chamois. The“Marmot/
Mice/Invertebrates” plot, located within this main fence, was left unprotected. Thus, with the exception of red deer and chamois, all other herbivore groups were able to access this
plot. The fence around the 2×3 m“Mice/Invertebrates” plot
consisted of a 90-cm high electric sheep fence (AGRARO Weidezaunnetz ECO, Landi, Bern, Switzerland; mesh size 10×10 cm) connected to the solar panel and excluded mar-mots and hares, while providing access for small mammals
and invertebrates. The 2×3 m“Invertebrates” plot allowed
access only for invertebrates and was surrounded by 1-m high metal mesh (Hortima AG, Hausen, Schweiz; mesh size 2×
2 cm). The“None” plot was surrounded by a 1-m tall
mos-quito net (Sala Ferramenta AG, Biasca, Switzerland; mesh size 1.5×2 mm) to exclude all herbivores. The top of this plot was covered with a roof consisting of a 2×3 m wooden frame lined with mosquito mesh mounted on wooden corner posts. This plot was additionally treated with a biocompatible insec-ticide (Clean kill original, Eco Belle GmbH, Waldshut-Tiengen, Germany) when needed to remove insects that might
have entered during data collection or that hatched from the soil. Fences were dismantled during winter (November to April) to protect them from snow pressure and avalanches and remounted in early May of each year immediately after snowmelt.
To assess whether the design of the “None” exclosure
(mesh and roof) affected the microclimatic conditions, we
erected“microclimate control” exclosures at 6 of the 18 sites.
These exclosures were open at the bottom (20 cm) of the 3-m side to allow invertebrates to enter, but otherwise constructed
as the “None” exclosures (for more details, see [28, 29]).
Thus, this construction allowed a comparable microclimate
to the“None” plots, but also a comparable grazing pressure to
the “Invertebrates” plots. We compared various properties
within these exclosures (Appendix TableA1) and were able
to show that the exclusion of herbivores rather than the con-struction of our exclosures was responsible for the differences
in parameters measured (see [28,29]).
Biweekly ungulate pellet and grasshopper counts showed that all sites were grazed during all three years (Appendix
Table A1; see Risch et al. [28] for more details). Marmot
populations were counted (visual observation) twice during each summer, indicating that marmots were present at all sites
(Appendix Table A1). Mice populations were not assessed,
and no attempt was made to quantify herbivore numbers and composition within the individual exclosure networks. How-ever, game cameras (Moultrie 6MP Game Spy I-60 Infrared Digital Game Camera, Moultrie Feeders, Alabaster, AL, USA) mounted at several fences showed that mice were present, that the medium- and small-sized mammals (marmots/hares and mice) were not afraid to enter the
fences, and that they grazed on their“designated” plots.
Our sites are grazed by each herbivore group with a consistent intensity from snow melt (early May) through late October
(onset of snowfall), i.e., there is no“peak grazing period” as in
other grassland ecosystems. Our herbivore exclusion treat-ments led to differences in consumption rates by the
individ-ual groups [27–29], which resulted in large differences in
above- and belowground plant biomass. At the same time, our treatments also led to changes in feces/urine input by herbivores, although we could not measure these parameters
on the individual plots (but see Appendix TableA1).
Soil Sampling and Belowground Measurements
At each site, soil sampling took place in early September of each growing season allowing for maximum herbivore impact before the vegetation becomes senescent. For this purpose, we selected one 1×1-m area within each of the five treatment plots. Within this area, two strips of 10 cm×1 m were cleared of vegetation, which was collected, dried at 65 °C, ground to pass a 0.5-mm sieve, and analyzed for plant tissue C and N concen-tration (Leco TruSpec Analyzer, Leco, St. Joseph, MI, USA).
Within these cleared strips, three soil samples were collected with a core sampler (5-cm diameter; AMS core sampler, AMS Inc, American Falls, ID, USA) at a randomly selected location. Then, two different soil layers were distinguished. In a first step, organic soil within the dense root layer (rhizosphere) was collected (typically 1 to 3 cm in depth), and in a second step, a 10-cm mineral soil core beneath the rhizosphere was taken. Due to the shallow soil depth in the study region, deeper soil
sampling was not possible [30]. The three cores for each of the
two layers were pooled and immediately stored in a cool-box. This sampling scheme amounted in a total of 540 soil samples (2 soil layers × 5 treatments × 18 exclosures × 3 years of sampling). Samples were sieved through a 2-mm sieve upon return to the field station. A subsample of soil (see below), glass beads, and extraction buffer were placed into an Eppendorf
tube, briefly mixed on a shaker, and then frozen at−20 °C until
further analyses were conducted.
To assess root biomass, five soil samples were randomly collected within the same strips as described above with a soil corer (2.2-cm diameter, Giddings Machine Company, Windsor, CO, USA) to a depth of 10 cm. Samples were dried at 30 °C and subsequently roots were manually separated from soil material. Each sample was sorted for an hour, which assured that over 95 % of all roots were picked. Before weighing to the nearest milligram, roots were dried at 65 °C for 48 h. The average data of the five samples was used to calculate root biomass per square meter.
Soil temperature and moisture were measured every other week throughout the field season (May–September) of each year. Measurements were conducted for the 0 to 12-cm depth at the previously assigned quadrat of each plot. Soil temper-ature was measured with a waterproof digital pocket ther-mometer (Barnstead International, Dubuque, IA, USA) and soil moisture was assessed at five random points within the quadrat with a FieldScout TDR-100 (time domain reflectom-eter; Spectrum Technologies, Plainfield, IL, USA).
Determining Bacterial Community Structure and Microbial Biomass Carbon
Bacterial community composition within the rhizosphere and mineral soil layers of each soil sample was analyzed following
the protocol recommended by Frey et al. [31]. The 16S rDNA
genes of the total extracted DNA were PCR-amplified and terminal restriction fragment length polymorphism (T-RFLP) was used to profile the bacterial community composition. For
the DNA extraction, 350–600 mg soil material and 750-mg
glass beads (0.1-mm diameter, B. Braun Biotech International, Melsungen, Germany) were suspended in 1.3-ml DNA ex-traction buffer (2 % CTAB, 20 mM EDTA pH 8, 2 M NaCl; 100 mM Tris THAM pH 8, 2 % PVP) and subsequently frozen until further treatment. Extraction was obtained using a bead beating procedure (FastPrep 120, Savant Instruments,
NY, USA) of 40 s at 5.5 m s−1followed by 5 min
centrifuga-tion at 13,000 rpm. Each soil sample was extracted three times with repeated addition of 1 ml of extraction buffer and pooled with its supernatant. The pooled extract of all three extraction steps was purified with 2 ml chloroform-isoamyl alcohol (24:1 v/v). Precipitation of DNA was achieved through the addition of 3 ml isopropanol incubated for 1 h at 37 °C, followed by a 15-min centrifugation at 13,000 rpm. The pellets were washed with 70 % EtOH, air dried and
resus-pended in 220 μl of AE buffer (10 mM Tris-Cl, 0.5 mM
EDTA, pH 9).
To bind PCR inhibiting substances such as humic acids,
samples were processed with a BSA-pretreatment: 12.5μl AE
buffer, 2.5 μl BSA (Fluka, Buchs, Switzerland), and 10 μl
DNA were incubated for 5 min at 90 °C. Amplification of bacterial 16S rDNA gene was conducted with a PCR with a fluorescent-labeled (6-FAM) forward primer 27f (5′-AGAG TTTGATCMTGGCTCAG-3′) and an unlabeled reverse
primer 1378r (5′-CGGTGTGTACAAGGCCCGGGAACG-3′).
A 20-μl reaction mixture consisting of 0.2 μM of each of the
primers, 1× PCR-buffer (QIAGEN, Hilden, Germany), 2μM
MgCl2, 0.4 mM deoxynucleoside triphosphate (Promega),
0.6 mg ml−1BSA, and 0.05 U/μl HotStar Taq polymerase
(QIAGEN) was added to 5μl of prediluted (1:50) DNA. PCR
amplification was performed with a PTC-100 thermocycler (MJ Research, Waltham, MA, USA) with the following cycling conditions: an initial activating step for HotStar Taq polymerase (15 min at 95 °C) was followed by 35 amplification cycles consisting of 45 s denaturation at 95 °C, 45 s annealing at 48 °C, and 2 min extension at 72 °C. The PCR amplification was terminated with an additional 5 min final extension step at 72 °C. The amplification success was verified by electrophoresis on a 1 % agarose gel in 1 % TAE buffer.
The PCR product was digested using 0.1 U of the restric-tion nuclease MspI (Promega) in 1 % Y Tango buffer diluted with HPLC water and incubated for 3 h at 37 °C, followed by a 20-min inactivation step at 65 °C. Digestion products were then desalted with Montage SEQ96 plates (Millipore Corpo-ration, Billerica, MA, USA). For this execution, a vacuum (22–23 bar) was applied to let the digestion products, which were preliminarily transferred into the wells, flow through the
membrane. The membrane was then washed twice with 20μl
of AE-buffer, applying the same procedure. After using
another 20 μl AE-buffer incubated on a shaker for
10 min at 750 rpm, DNA was resuspended and trans-ferred to a new PCR plate.
For the T-RFLP analysis, a mix of 1μl of the previously
obtained restriction digests, 0.1μl of the internal size standard
ROX500 (Applied Biosystems, Foster City, CA, USA), and
12.9 μl HiDi formamide (Applied Biosystems, Foster City,
CA, USA) was denaturated for 5 min at 95 °C, and then chilled in ice water before separation using an ABI Prism 310 Genetic Analyzer (Applied Biosystems, Foster City,
CA, USA). The analyzer was equipped with a 36 cm capillary,
which was filled with POP-4TM polymer. T-RFLP profiles
were analyzed using Genotyper v3.7 NT (Applied Biosystems, Foster City, CA, USA). Terminal restriction frag-ments (T-RFs) above a signal threshold of 50 relative fluores-cence units were determined manually. Relative signal inten-sities were obtained by dividing signal inteninten-sities of each individual T-RF by the sum of all signal intensities of a sample. This norm compensates differences in PCR product quantity and T-RFLP fingerprint intensity among samples, which is necessary when signal intensities among different
samples are compared [32]. It should be noted that not every
terminal restriction fragment identified by the T-RFLP analy-sis necessarily represents a single species, since it is possible that different species have restriction fragments with exactly the same number of base pairs. Thus, we define the individual restriction fragments as operational taxonomic units (OTUs), which can be considered a conservative estimate of the num-ber of bacterial species present in our system. We are aware that using only one restriction enzyme might have led to an underestimation of microbial richness as bacteria can share the same terminal restriction fragments for a particular primer. Yet, the method used allowed us to assess relative differences in bacterial community composition when aboveground her-bivores were removed, which was our goal.
Microbial biomass C was determined using the
substrate-induced method of Anderson and Domsch [33]; glucose
(5 g kg−1soil; the optimum concentration for CO2production
in these soils) was added to 25 g of sieved mineral soil
(dry weight equivalent), and CO2production was measured
using a LI-COR 6200 gas analyzer (LI-COR Biosciences, Lincoln, NE, USA) 1–2 h after glucose addition. Prior to the analysis, samples were brought to 60 % water-filled pore space with addition of deionized water and were incubated for 10 days at room temperature to re-equilibrate microbial activity following disturbance due to sampling. This incuba-tion time was identified by a preliminary experiment as the minimal time during which microbial activity reaches a steady state (basal respiration). Microbial biomass C was determined for mineral soil only as the rhizosphere samples were too small for analysis. Collecting additional samples was not feasible given the small size of the 1 ×1 m plots and an experiment that lasted 5 years in total.
Statistical Analysis
Nonmetric multidimensional scaling (NMDS) with subse-quent linear mixed model analyses performed on the NMDS scores were used to test for variation in bacterial community composition based on presence-absence data of the rhizo-sphere and the mineral soil separately. The experimental fac-tors of exclosure treatment (five levels; see experimental design), vegetation type (short-grass vs. tall-grass vegetation),
year (2009, 2010, 2011), and all possible interactions were treated as fixed effects and site (fence) as a random factor. NMDS was based on Sørensen distances between samples (i.e., Bray-Curtis calculated on presence/absence data), 50 restarts, and a stability criterion of 0.001. We assessed the relationships of biotic and abiotic variables (soil temperature, soil moisture, root biomass, plant tissue C:N ratio, and MBC) as well as some geographical properties of the fences (elevation, north–south (NS) and east–west (EW) coordinates) with the axis scores of the three NMDS axes (axis1, axis2, and axis3) by correlation analyses (Pearson’s correlation coefficient). In addi-tion, we tested how site location affected the community composition by running one-way ANOVAs with NMDS axes scores as dependent variables and site (fence) as an independent factor.
Linear mixed model analysis was performed to analyze variation in OTU richness and MBC (square-root-trans-formed). The analysis of OTU richness was done separately for the rhizosphere and the mineral soil samples. The models comprised the same fixed and random effects as described above. Tukey’s HSD post hoc tests with Bonferroni correction were used to test for significant differences between the her-bivore exclusion treatments. As there were no significant treatment × year interactions, indicating that the effects of herbivore exclusion were not significantly different among the three years of the experiment, only the results of the overall model including the data of all years are reported. Indeed, results of separate analyses for each year were qualitatively identical with respect to herbivore exclusion effects. We also assessed which of the measured biotic and abiotic variables (soil temperature, soil moisture, root biomass (log-transformed), and plant tissue C:N ratio) were correlated with richness and mineral soil MBC (square-root-transformed) using Pearson correlation coefficients. In addition, we used linear mixed model analyses with the fixed and random effects mentioned above to assess how herbivore exclusion affected the biotic and abiotic vari-ables. With the exception of the NMDS, which were performed with PRIMER 6 (PRIMER-E Ltd, Plymouth, UK), all statistical analyses were performed with the PASW Statistics 19.0 statistical package (IBM SPSS, Chicago, IL, USA).
Results
Bacterial Community Composition and Richness
Over the three years of the experiment, a total of 89 OTUs of different length (ribotypes) were detected. Fragment lengths ranged from 50.16 to 496.91 bp. The three-dimensional NMDS had a minimum stress-value of 0.124 for the
rhizo-sphere (Fig.1a) and 0.084 for the mineral soil bacterial
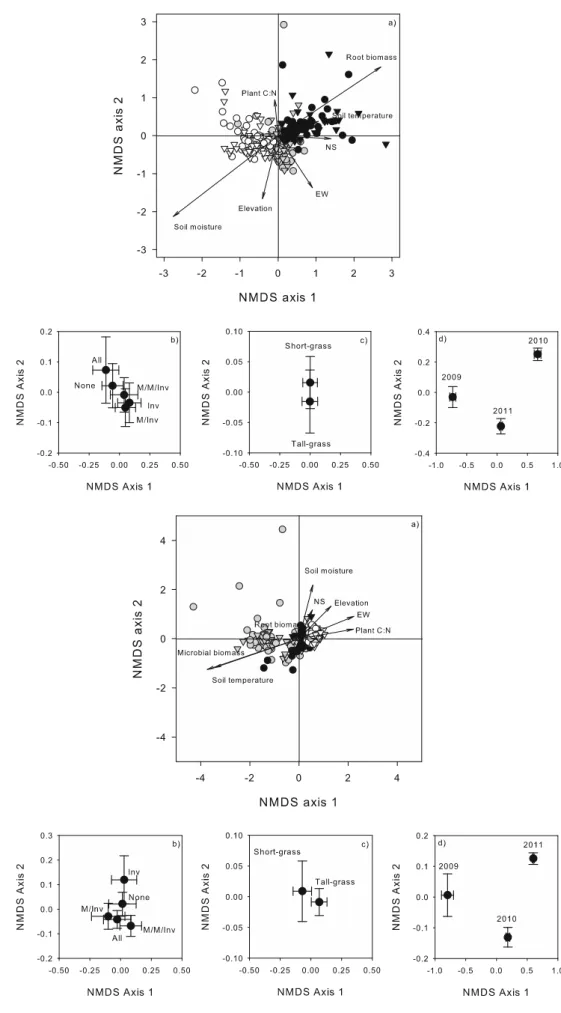
Fig. 1 Results of NMDS axes 1 and 2 for the rhizosphere soil samples. a All samples in relation to abiotic and biotic ecosystem parameters (black arrows). NS is the north–south coordinate of the exclosure network, EW is the east–west coordinate of the exclosure network. Circles represent short-grass vegetation, triangles represent tall-grass vegetation. Gray filling stands for the 2009, black for the 2010, and no filling for the 2011 growing season. b NMDS axes 1 and 2 mean ± standard error for the individual treatments (M/M/Inv = Marmot/Mice/Invertebrates, M/Inv. = Mice/Invertebrates, Inv. = Invertebrates), c NMDS axes 1 and 2 mean ± standard error for the two vegetation types, and d NMDS axes 1 and 2 mean ± standard error for the three growing seasons
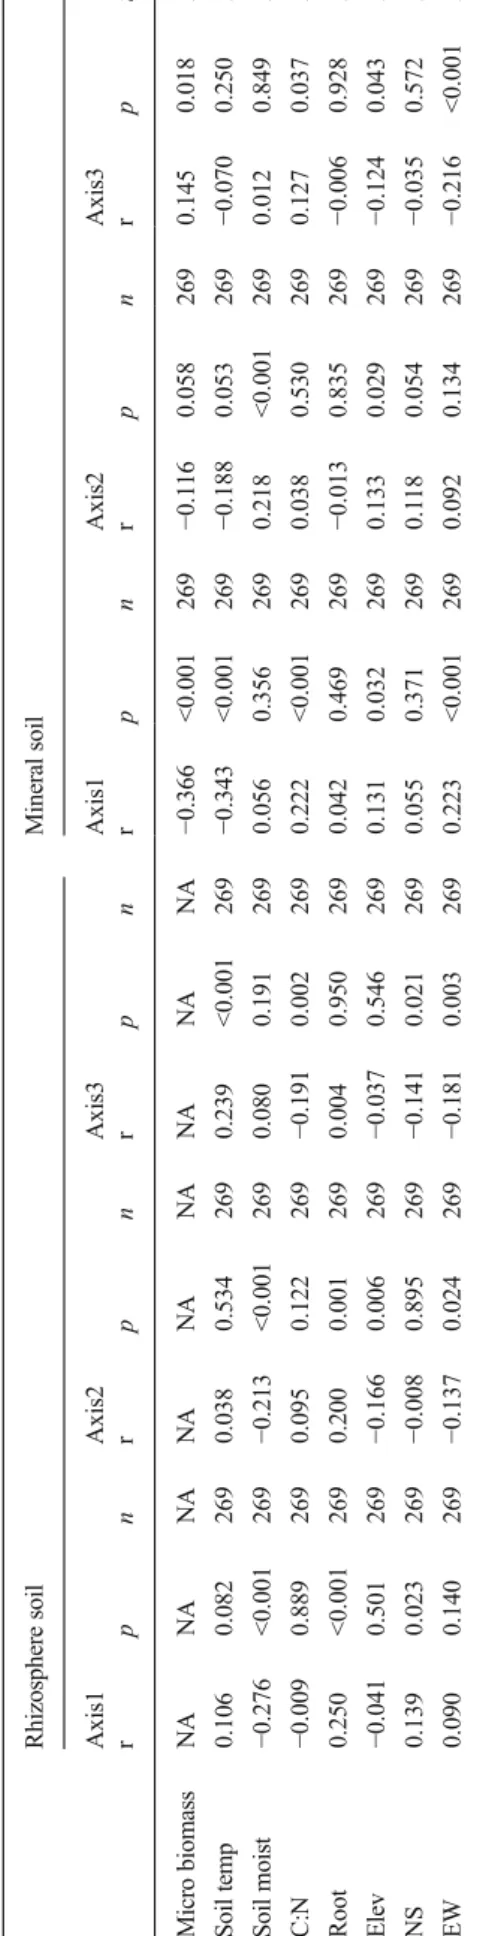
Fig. 2 Results NMDS axes 1 and 2 for the mineral soil samples. a All samples in relation to abiotic and biotic ecosystem parameters (black arrows). NS is the north– south coordinate of the exclosure network, EW is the east–west coordinate of the exclosure network. Circles represent short-grass vegetation, triangles represent tall-grass vegetation. Gray filling stands for the 2009, black for the 2010, and no filling for the 2011 growing season. b NMDS axes 1 and 2 mean ± standard error for the individual treatments (M/M/Inv = Marmot/ Mice/Invertebrates, M/Inv. = Mice/Invertebrates, Inv. = Invertebrates), c NMDS axes 1 and 2 mean ± standard error for the two vegetation types, and d NMDS axes 1 and 2 mean ± standard error for the three growing seasons
exclusion treatments or vegetation type significantly affected the composition of bacterial communities in the rhizosphere or
mineral soil (Table1; Figs.1b, cand2b, c). However,
inter-estingly, the bacterial community composition of both the rhizosphere and mineral soil significantly differed between
the three years (Table 1; Figs. 1d and 2d). Differences in
bacterial community composition in the rhizosphere soil showed strongest relations to soil moisture and root
biomass (Fig. 1a; Table 2). The soil temperature, plant
C:N concentrations, and geographic location somewhat affected the bacterial communities, but with regard to locations, we only detected differences between the fences on the second axis [NMDS axis 2 (results not
shown); Table 2]. In contrast to the rhizosphere soil,
strong relationships were found between the bacterial community composition and all variables except root biomass and north–south coordinates in the mineral soil
(Fig. 2a; Table 2). Geographic location affected the
bacterial community composition in the mineral soil somewhat more compared to the rhizosphere as we found differences between the 18 fences on 2 of the 3 NMDS axes (axes 1 and 3; results not shown).
OTU richness of neither the rhizosphere (F4,239=
0.175, p = 0.951) nor the mineral soil was significantly
af-fected by herbivore exclusion (F4,223= 0.676, p = 0.609).
Moreover, vegetation type had no overall effect on this
re-sponse variable in the rhizosphere (F4,239=0.151, p=0.698) or
the mineral soil (F4,223=0.745, p=0.401). However, mineral
soil bacterial richness strongly varied among the three
growing seasons (F4,223= 145.926, p < 0.001), whereas
no among-year variation was detected for the
rhizo-sphere (F4,239= 0.386, p = 0.680; Appendix Table A2).
Mineral soil bacterial richness was positively correlated with the biotic variables root biomass and plant C:N concentration and negatively with the abiotic variables
soil temperature and soil moisture (Table 3). In
con-trast, no correlation was found between rhizosphere bacterial richness and these biotic or abiotic variables
(Table 3).
Soil Microbial Biomass Carbon and Soil Properties
Mineral soil MBC significantly differed between the herbivore exclusion treatments varying between 765±47 (mean ± SE)
and 973±56 mg/kg soil over the course of our study (F4, 227=
3.579, p=0.007). It was lowest in plots from which ungulates and marmots (“Mice/Invertebrates”) were excluded and highest in plots with free access for all but ungulates
(“Mar-mot/Mice/Invertebrates”; Fig.3). It should, however, be noted
that the treatment differences were only (weakly) significant
for 2010 (F4,64=2.568, p=0.046), but not for the other two
years of investigation (2009: F4,63=1.052, p=0.387; 2011:
F4,64=1.535, p=0.203). MBC significantly differed between
the three years of sampling with highest values in 2009
com-pared to the other two years (Appendix TableA2). No
differ-ence was found in MBC between the two vegetation types
Table 1 Statistical results from the linear mixed model approach applied on the NMDS axes scores of bacterial community structure data for both the rhizosphere and mineral soil
Axis1 Axis2 Axis3
df F p F p F p
Rhizosphere soil
Treatment 4,223 2.170 0.073 0.532 0.712 0.444 0.777 Vegetation type 1,16 0.001 0.975 0.111 0.743 0.208 0.655 Year 2,223 274.9 <0.001 19.92 <0.001 138.8 <0.001 Treatment × vegetation type 4,223 0.960 0.430 0.832 0.506 0.567 0.687 Treatment × year 8,223 0.643 0.741 1.517 0.152 0.804 0.600 Vegetation type × year 2,223 0.660 0.518 0.062 0.939 0.162 0.851 Treatment × vegetation type × year 8,223 0.581 0.793 0.500 0.855 1.287 0.251
Mineral soil
Treatment 4,223 0.961 0.430 1.741 0.142 0.454 0.769 Vegetation type 1,16 1.084 0.313 0.086 0.773 0.660 0.429 Year 2,223 176.1 <0.001 8.668 <0.001 24.30 <0.001 Treatment × vegetation type 4,223 0.348 0.845 1.449 0.219 1.421 0.228 Treatment × year 8,223 0.891 0.525 1.253 0.270 1.203 0.298 Vegetation type × year 2,223 0.285 0.752 3.854 0.023 0.004 0.996 Treatment × vegetation type × year 8,223 0.211 0.989 0.864 0.548 0.784 0.617 df degrees of freedom, F=F value, p=p value
(short-grass: 817±31, tall-grass: 921±38 g/kg; F1,16=0.638, p=0.436). Generally, mineral soil MBC was positively related to soil temperature (r=0.233, p<0.001; n=269), and
negative-ly to both soil moisture (r=− 0.219, p<0.001; n=269) and
plant tissue C:N ratio (r=−0.129, p=0.034; n=269), but not to
root biomass (r=0.077, p=0.210; n=269).
Our progressive herbivore exclusion resulted in a re-duction of soil temperature consistently across the two
vegetation types (F4,223= 15.556, p < 0.001). Moreover,
there was a vegetation-type-dependent effect of herbivore exclusion on root biomass (significant treatment ×
vege-tation type interaction: F4,223=4.02, p=0.003): herbivore
exclusion reduced root biomass only in the tall-grass
vegetation (F4,112= 3.987, p = 0.003). Soil moisture
signif-icantly differed between the herbivore treatments (F4,223=
2.583, p=0.038). Similar as for root biomass, we found a
Ta b le 2 Corr el ati o n b et w een the thre e NM DS axe s scor es and abioti c and b iot ic p ar amet ers Rhizosphere so il Mineral soil A x is1 A xis2 A x is3 A xis 1 Axis 2 A xi s3 r pn r pn r pn r pn r pn r pn Mi cr o b io ma ss N A NA NA NA NA NA NA NA N A − 0.366 <0.001 269 − 0.1 1 6 0 .058 269 0.145 0.018 269 Soil temp 0.106 0.082 269 0. 038 0.534 269 0.239 <0.001 269 − 0.343 <0.001 269 − 0.188 0.053 269 − 0.070 0.250 269 S o il m o is t − 0.276 <0.001 269 − 0.213 <0.0 01 269 0.080 0.191 269 0.056 0.356 269 0.218 <0.001 269 0.012 0.849 269 C: N − 0.009 0.889 269 0.095 0.122 269 − 0.1 9 1 0 .002 269 0.222 <0.001 269 0.038 0.530 269 0.127 0.037 269 Root 0.250 <0.001 269 0.200 0.001 269 0.004 0.950 269 0.042 0.469 269 − 0.013 0.835 269 − 0.006 0.928 269 El ev − 0.041 0.501 269 − 0.166 0.006 269 − 0.0 3 7 0 .546 269 0.131 0.032 269 0.133 0.029 269 − 0.124 0.043 269 NS 0.139 0.023 269 − 0.008 0.895 269 − 0.1 4 1 0 .021 269 0.055 0.371 269 0.1 1 8 0 .054 269 − 0.035 0.572 269 EW 0.090 0.140 269 − 0.137 0.024 269 − 0.1 8 1 0 .003 269 0.223 <0.001 269 0.092 0.134 269 − 0.216 <0 .001 269 Soil temp so il te m p er at ure in °C ,soil moist soil moi stur e (% ), El ev el evat ion (m) ,NS north –south coordinate, EW ea st –west coo rdinate, mi cr o b iom a ss microbial biomass m g/kg, Root root biomass (g/m 2 ), C :N plant m at er ial C :N ra tio, r Pe ar so n corr el ati on co ef fi ci ent , p = p value, n = number o f d ata points
Table 3 Correlations between bacterial community richness and abiotic (soil temperature, soil moisture) and biotic (root biomass, plant C:N ratio) parameters for both the rhizosphere and mineral soil separately
Rhizosphere soil Mineral soil Richness Richness r p n r p n Root biomass 0.039 0.522 269 0.180 0.003 269 Soil temperature −0.024 0.701 269 −0.218 <0.001 269 Soil moisture 0.042 0.494 269 −0.139 0.022 269 Plant C:N −0.067 0.271 269 0.203 0.001 269 r Pearson correlation coefficient, p=p value, n=number of data points
Fig. 3 Effect of herbivore removal on soil microbial biomass carbon (MBC) for the two different vegetation types. Values represent mean ± standard error. Labels on x-axis represent herbivore groups present
vegetation-type-dependent effect of herbivore exclusion on plant C:N ratios (treatment × vegetation type interaction:
F4,223=4.403, p=0.002), with herbivore exclusion decreasing
plant tissue C:N ratio in the tall-grass vegetation only (F4,122=
4.728, p=0.001). All biotic and abiotic variables significantly differed over the course of the three years (see Appendix
TableA2).
Discussion
Bacterial Community Composition and Richness
Against our expectations, we did not detect an influence of herbivore exclusion on bacterial community compo-sition. These findings contrast most studies that dealt with grazing effects (large ungulates) on soil bacterial
communities: For example, Zhou et al. [7] detected
differences in bacterial community structure in grass-lands grazed by sheep at different intensities: their com-munities differed in areas with low to medium grazing
intensities (1.33 and 4.0 sheep ha−1, respectively)
com-pared to ungrazed and heavily (6.67 sheep ha−1) grazed
sites. Also Attard et al. [34] and Clegg et al. [21]
reported shifts in bacterial community structure caused by grazing in a microcosm and a field experiment, respectively. Both explained their findings by changes in the inputs of urine and feces, changes in plant
com-position, and soil structure. Also Grayston et al. [35]
and Waldrop and Firestone [36] suggested that
differ-ences in plant community composition were responsible for resulting differences in bacterial community compo-sition. In our study, we only found small changes in vegetation community composition by 2012. Haynes
[27] showed that only 1 of 157 plant species—
F. rubra—increased in cover, while more competitive plant species (according to Grimes’ CSR strategies
[37]) gained slightly higher cover compared to
stress-tolerant species in both vegetation types. This lack in major plant community changes could explain the lack of differences in bacterial community composition be-tween our treatments. Yet, we (i) considerably altered urine and feces inputs with our experimental setup
(un-gulate feces input see Appendix Table A1; no data
available for the other species) and (ii) worked in two considerably different plant communities (for differences
also see [25]). But, again, these differences did not
result in changes in bacterial community structures ei-ther. We acknowledge that we cannot exclude that our treatments might have affected other groups such as Archaea and fungi. Yet, this would need further research.
The only differences that we detected were temporal, i.e., between the three growing seasons (interannual) of sampling and partly spatial, i.e., between the different sites. These findings suggest that interannual and spatial variability in air temperature and precipitation (data not shown) led to variations in soil temperature and soil moisture, which likely also affected the amount and quality of available resources for the bacterial commu-nity. Several authors reported seasonal as well as inter-annual patterns in microbial community composition
[e.g., 35, 36, 38]. They attributed their findings to
temporal variation soil temperature, soil moisture, and resource availability. Our study suggests a similar mechanism.
Microbial Biomass Carbon and Soil Properties
Excluding functionally different herbivore groups from subalpine grasslands only resulted in slight differences in mineral soil MBC in 2010, when MBC variability was lowest, but not during the other years. Thus, the data should be interpreted with care. Generally, authors explained decreases in MBC due to grazing exclusion by a reduction in nutrient input via dung and urine and
decreases in biomass consumption rates [e.g., 10, 16,
39]. We do have large decreases in the input of large
ungulate dung (and also urine), but do not have data for our plots. It is therefore difficult to assess the specific effect of dung and urine reduction on MBC in detail. Again, we did not detect any differences in MBC between our two vegetation types and the stron-gest differences in MBC were among the three growing seasons. Thus, our MBC results contrast with the
find-ings of Bardgett et al. [10] who reported higher
micro-bial biomass in Nardus dominated vegetation—similar to our tall-grass—compared to Agrostis-Festuca vege-tation that is similar to our short-grass. Yet, in their study, the two grassland types were located on different parent material that featured different pH, which was not the case in our study. Interannual differences in MBC have often been reported from semiarid
grass-lands [40, 41] and a tall-grass prairie [42], where soil
moisture was positively related with MBC. This is apparently in contrast to the negative correlation of soil moisture with MBC that we found in our study. However, the grassland ecosystems mentioned above are likely moisture limited compared to our high-elevation, alpine ecosystems that are temperature
limit-ed. Risch et al. [28] and Haynes et al. [29] indeed
showed that soil moisture was negatively related to soil temperature in our study system, with increases in moisture and decreases in temperature when herbivores were progressively excluded.
Lack of Response of Soil Bacterial Community Composition and Richness to Herbivore Removal and Grazing History Excluding the different herbivores for three growing seasons from two different grassland types did, against our expectations, not result in changes of the bacterial community composition and richness, even though our treatments had large effects on above- and belowground
biomass [results; 28, 29] and likely also feces/urine
input by herbivores. A potential explanation for this lack in response could be that the time of exclusion was too short to allow for changes. This argument would be supported by the fact that many studies that reported grazing-related differences in bacterial commu-nity composition were performed over fairly long time
frames (e.g., 16 years [7]; 37 years [10]), during which
the ecosystems had time to adjust to the new grazing regimes and ecosystem properties were likely altered.
Yet, we also did not detect any differences in bac-terial community composition and richness between the two vegetation types with different plant communities and ecosystem properties that were grazed at different intensities for decades. This indicates that the bacterial communities present in our system respond either very
slowly to changes in grazing regimes and the concom-itant changes in the vegetation composition, or that other factors than these alterations of ecosystem param-eters are more important in our high-elevation grass-lands. A very slow response is certainly possible, as already discussed above. Yet, our findings suggest that it is more likely that the spatiotemporal variability in the soil microclimate had a stronger effect on ecosys-tem properties than the alterations in these variables caused by herbivory or plant community type. This would be in line with the findings by Frank and Esper
[43] and Cannone et al. [44] that suggested that
high-elevation ecosystems are more sensitive to variability in climate parameters compared to ecosystems at lower elevations.
Acknowledgments We would like to thank numerous interns and volunteers for their help with fence construction, data collection and laboratory work. Our special thanks go to Bigna Stoffel, Vera Baptista, Anna Schweiger, and Annatina Zingg for sorting the roots. We are grateful to the Swiss National Park for administrative support of our research. This study was funded by the Swiss National Science Founda-tion, SNF grant-no 31003A_122009/1 a nd SNF grant-no 31003A_140939/1.
Appendix
Table 4 Average number of un-gulate pellet groups 100 m−2, number of marmots counted, and average number of grasshoppers m−2at each site for summer 2009 and 2010
Pellet groups 100 m−2 Marmots site−1 Grasshoppers m−2 Site Vegetation type 2009 2010 2011 2009 2010 2011 2009 2010 2011 1 Short-grass 13.7 12.4 9.4 5.0 1.0 4.0 0.5 5.3 0.8 2 Tall-grass 6.0 8.3 7.7 5.0 1.0 4.0 0.7 5.0 0.7 3 Short-grass 9.3 12.1 9.4 5.0 1.0 4.0 0.5 1.5 0.6 4 Tall-grass 7.7 10.1 8.9 5.0 1.0 4.0 0.9 5.9 1.3 5 Short-grass 17.8 11.9 12.1 3.0 2.0 4.0 0.6 2.7 0.9 6 Tall-grass 8.3 8.5 4.4 3.0 2.0 4.0 0.9 3.8 0.4 7 Short-grass 1.8 8.9 6.1 9.0 1.0 4.0 0.2 0.4 0.3 8 Tall-grass 15.2 10.6 12.0 9.0 1.0 4.0 0.6 1.6 0.1 9 Short-grass 1.7 4.4 3.4 2.0 2.0 3.0 0.1 1.0 0.4 10 Tall-grass 6.0 9.4 4.9 2.0 2.0 3.0 0.2 0.3 0.1 11 Short-grass 13.2 13.2 11.6 17.0 21.0 16.0 0.5 2.8 0.5 12 Tall-grass 15.2 21.0 16.3 17.0 21.0 16.0 1.6 4.4 1.4 13 Short-grass 17.3 15.0 15.3 17.0 21.0 16.0 1.1 3.6 0.7 14 Tall-grass 26.0 13.6 12.5 17.0 21.0 16.0 0.8 3.5 1.4 15 Short-grass 20.3 6.9 7.8 11.0 11.0 9.0 0.5 0.4 0.2 16 Tall-grass 9.2 6.5 4.6 11.0 11.0 9.0 0.2 0.1 0.1 17 Short-grass 28.3 14.2 11.6 11.0 11.0 9.0 0.3 0.7 0.1 18 Tall-grass 10.5 5.6 3.8 11.0 11.0 9.0 0.3 0.3 0.2
References
1. Lieth H (1978) Pattern of primary productivity in the biosphere. Hutchinson & Ross, Stroudsberg
2. White RS, Murray S, Rohweder M (2000) Pilot analysis of global ecosystems: grassland ecosystems technical report. World Resources Institute, Washington
3. Wardle DA, Barker GM, Yeates GW, Bonner KI, Ghani A (2001) Introduced browsing mammals in New Zealand natural forests: aboveground and belowground consequences. Ecol Monogr 71: 587–614
4. Del-Val E, Crawley MJ (2005) What limits herb biomass in grass-lands: competition or herbivory? Oecologia 142:202–211
5. Bakker ES, Ritchie ME, Olff H, Milchunas DG, Knops JMH (2006) Herbivore impact on grassland plant diversity depends on habitat productivity and herbivore size. Ecol Lett 9:780–788
6. Austrheim G, Mysterud A, Pedersen B, Halvoresen R, Hassel K, Evju M (2008) Large scale experimental effects of three levels of sheep densities on an alpine ecosystem. Oikos 117:837–846 7. Zhou X, Wang J, Wang Y (2010) Intermediate grazing intensities by
sheep increase soil bacterial diversities in an inner Mongolian steppe. Biol Fert Soils 46:817–824
8. Binkley D, Singer F, Kaye M, Rochelle R (2003) Influence of elk grazing on soil properties in rocky mountain national park. For Ecol Manag 185:239–247
9. Stark S, Wardle DA, Ohtonen R, Helle T, Yeates GW (2000) The effect of reindeer grazing on decomposition, mineralization and soil biota in a dry oligotrophic Scots pine forest. Oikos 90:301–310 10. Bardgett RD, Leemans DK, Cook R, Hobbs PJ (1997) Seasonality of
the soil biota of grazed and ungrazed hill grasslands. Soil Biol Biochem 29:1285–1294
11. Bardgett RD, Wardle DA (2003) Herbivore-mediated linkages be-tween aboveground and belowground communities. Ecology 84: 2258–2268
12. Holland JN, Cheng W, Crossley DA (1996) Herbivore-induced changes in plant carbon allocation: assessment of below-ground C fluxes using carbon-14. Oecologia 107:87–94
13. Hamilton EW, Frank DA (2001) Can plants stimulate soil microbes and their own nutrient supply? Evidence from a grazing tolerant grass. Ecology 82:2397–2402
14. Tracy BF, Frank DA (1998) Herbivore influence on soil microbial biomass and nitrogen mineralization in a northern grassland ecosys-tem: Yellowstone National Park. Oecologia 114:556–562
15. Bakker ES, Olff H, Boekhoff M, Gleichmann JM, Berendse F (2004) Impact of herbivores on nitrogen cycling: contrasting effects of small and large species. Oecologia 138:91–101
16. Wang KH, McSorley R, Bohlen B, Gathumbi SM (2006) Cattle grazing increases microbial biomass and alters soil nematode com-munities in subtropical pastures. Soil Biol Biochem 38:1956–1965 17. Bardgett RD, Hobbs PJ, Frostegård Å (1996) Changes in fungal:
bacterial biomass ratios following reductions in the intensity of management on an upland grassland. Biol Fertil Soils 22:261–264 18. Bardgett RD, Jones AC, Jones DL, Kemmitt SJ, Cook R, Hobbs PJ
(2001) Soil microbial community patterns related to the history and intensity of grazing in sub-montane ecosystems. Soil Biol Biochem 33:1653–1664
19. Klumpp K, Fontaine S, Attard E, Le Roux X, Gleixner G, Soussana J (2009) Grazing triggers soil carbon loss by altering plant roots and their control on soil microbial community. J Ecol 97:876–885 20. Patra AK, Abbadie L, Clays-Josserand A, Degrange V, Grayston SJ,
Loiseau P, Loualt F, Mahmood S, Nazaret S, Philippot L, Poly F, Prosser JI, Richaume A, Le Roux X (2005) Effects of grazing on microbial functional groups involved in soil dynamics. Ecol Monogr 75:65–80
21. Clegg CD (2006) Impact of cattle grazing and inorganic fertilizer additions to managed grasslands on the microbial community com-position of soils. Appl Soil Ecol 31:73–82
22. Orwin KH, Bertram JE, Clough TJ, Condron LM, Sherlock RR, O’Callaghan M, Ray J, Baird DB (2010) Impact of bovine urine deposition on soil microbial activity, biomass, and community struc-ture. Appl Soil Ecol 44:89–100
23. Holland JN (1995) Effects of above-ground herbivory on soil micro-bial biomass in conventional and no-tillage agroecosystems. Appl Soil Ecol 2:275–279
24. MeteoSchweiz (2011) IDAWEB weather data portal. https://gate.
meteoswiss.ch/idaweb/login.do?language = en. Accessed 10 Jan 2012
25. Schütz M, Risch AC, Leuzinger E, Krüsi BO, Achermann G (2003) Impact of herbivory by red deer (Cervus elaphus L.) on patterns and processes in subalpine grasslands in the swiss national park. For Ecol Manag 181:177–88
26. Schütz M, Risch AC, Achermann G, Thiel-Egenter C, Page-Dumroese DS, Jurgensen MF, Edwards PJ (2006) Phosphorus trans-location by red deer on a subalpine grassland in the central European Alps. Ecosystems 9:624–633
27. Haynes AG (2013) Trophic cascades in two contrasting plant com-munities: the effects of herbivore exclusion on grassland ecosystems. PhD thesis 21497, ETH Zurich
28. Risch AC, Haynes AG, Busse MD, Filli F, Schütz M (2013) The response of soil CO2fluxes to progressively excluding vertebrate and
invertebrate herbivores depends on ecosystem type. Ecosystems 16: 1192–1202
29. Haynes AG, Schuetz M, Buchmann N, Page-Dumroese DS, Busse MD, Risch AC (2014) Linkages between grazing history and Table 5 Interannual differences in bacterial community richness for both
the mineral soil and the rhizosphere. Interannual differences in environ-mental variables microbial biomass (MBC; mg/kg), soil temperature in
°C; soil moisture (%), plant material C:N ratio and root biomass (g/m2);
values represent mean ± standard error. F=F value, p=p value; different letters indicate significantly different values
2009 2010 2011 F p
Richness (mineral) 49.3±1.70b 73.4±0.92a 70.2±0.65a 123.49 <0.001 Richness (rhizosphere) 70.0±0.70 69.3±1.01 68.8±0.97 0.430 0.651 Microbial biomass 1061.4±45.8a 764.3±35.1b 795.3±37.0b 16.73 <0.001 Soil temperature 13.7±0.16a 13.0±0.16b 12.5±0.16c 12.53 <0.001 Soil moisture 34.8±1.44a 26.7±0.83b 35.8±0.82a 22.12 <0.001 Plant tissue C:N 24.2±0.30b 26.5±0.34a 26.7±0.40a 14.98 <0.001 Root biomass 688.4±37.42b 972.4±38.87a 627.2±19.36b 31.16 <0.001
herbivore exclusion on decomposition rates in mineral soils of sub-alpine grasslands. Plant Soil 374:579–591
30. Risch AC, Jurgensen MF, Page-Dumroese DS, Wildi O, Schütz M (2008) Long-term development of above- and belowground carbon stocks following land-use change in subalpine ecosystems of the Swiss National Park. Can J For Res 38:1590–1602
31. Frey B, Kremer J, Rüdt A, Sciacca S, Matthies D, Lüscher P (2009) Compaction of forest soils with heavy logging machin-ery affects soil bacterial community structure. Eur J Soil Biol 45:312–320
32. Hartmann M, Frey B, Kölliker R, Widmer F (2005) Semi-automated genetic analyses of soil microbial communities: comparison of T-RFLP and RISA based on descriptive and discriminative statistical approaches. J Microbiol Methods 61:349–360
33. Anderson JPE, Domsch KH (1978) A physiological method for the quantitative measurement of microbial biomass in soil. Soil Biol Biochem 10:215–221
34. Attard E, Degrange V, Klumpp K, Richaume A, Soussana JF, Le Roux X (2008) How do grassland management history and bacterial micro-localisation affect the response of bacterial community struc-ture to changes in aboveground grazing regime? Soil Biol Biochem 40:1244–1252
35. Grayston SJ, Griffith GS, Mawdsley JL, Campbell CD, Bradgett RD (2001) Accounting for variability in soil microbial commu-nities of temperate upland grassland ecosystems. Soil Biol Biochem 33:533–551
36. Waldrop MP, Firestone MK (2006) Seasonal dynamics of microbial community composition and function in oak canopy and open grass-land soils. Microl Ecol 52:470–479
37. Grime JP (1977) Evidence fort he existence of three primary strate-gies in plants and its relevance to ecological and evolutionary theory. Am Nat 111:1169–1194
38. Bardgett RD, Lovell RD, Hobbs PJ, Jarvis SC (1999) Seasonal changes in soil microbial communities along a fertility gradient of temperate grasslands. Soil Biol Biochem 31:1021–1030
39. Bardgett RD, Leemans DK (1995) The short-term effects of cessation of fertilizer applications, liming and grazing on microbial biomass and activity in a reseeded upland grassland soil. Biol Fert Soils 19:148–154 40. Bell C, McIntyre N, Cox S, Tissue D, Zak J (2008) Soil microbial responses to temporal variations of moisture and temperature in a Chihuahuan desert grassland. Microb Ecol 56:153–167
41. Liu W, Xu W, Hong J, Wan S (2010) Interannual variability of soil microbial biomass and respiration in response to topography, annual burning and N addition in a semiarid temperate steppe. Geoderma 158:259–267
42. Garcia FO, Rice CW (1994) Microbial biomass dynamics in tall-grass prairie. Soil Sci Soc Am J 58:816–823
43. Frank D, Esper J (2005) Characterization and climate response of high-elevation, multi-species tree-ring network in the European Alps. Dendrochronologia 22:107–121
44. Cannone N, Sgorbati S, Guglielmin M (2007) Unexpected impacts of climate change on alpine vegetation. Front Ecology Environ 5:360–364