HAL Id: hal-03163551
https://hal.sorbonne-universite.fr/hal-03163551
Submitted on 9 Mar 2021
HAL is a multi-disciplinary open access
archive for the deposit and dissemination of
sci-entific research documents, whether they are
pub-lished or not. The documents may come from
teaching and research institutions in France or
abroad, or from public or private research centers.
L’archive ouverte pluridisciplinaire HAL, est
destinée au dépôt et à la diffusion de documents
scientifiques de niveau recherche, publiés ou non,
émanant des établissements d’enseignement et de
recherche français ou étrangers, des laboratoires
publics ou privés.
with motor handicap in Parkinson’s disease
Nacim Betrouni, Caroline Moreau, Anne-Sophie Rolland, Nicolas Carrière,
Marie Chupin, Gregory Kuchcinski, Renaud Lopes, Romain Viard, Luc
Defebvre, David Devos
To cite this version:
Nacim Betrouni, Caroline Moreau, Anne-Sophie Rolland, Nicolas Carrière, Marie Chupin, et al..
Texture-based markers from structural imaging correlate with motor handicap in Parkinson’s
dis-ease. Scientific Reports, Nature Publishing Group, 2021, 11 (1), �10.1038/s41598-021-81209-4�.
�hal-03163551�
1 Scientific Reports | (2021) 11:2724 | https://doi.org/10.1038/s41598-021-81209-4
www.nature.com/scientificreports
Texture‑based markers
from structural imaging correlate
with motor handicap in Parkinson’s
disease
Nacim Betrouni
1*, Caroline Moreau
1,2, Anne‑Sophie Rolland
2, Nicolas Carrière
2,
Marie Chupin
3, Gregory Kuchcinski
1,4, Renaud Lopes
1,4, Romain Viard
1,4, Luc Defebvre
1,2&
David Devos
1,2There is a growing need for surrogate biomarkers for Parkinson’s disease (PD). Structural analysis using magnetic resonance imaging with T1‑weighted sequences has the potential to quantify histopathological changes. Degeneration is typically measured by the volume and shape of morphological changes. However, these changes appear late in the disease, preventing their use as surrogate markers. We investigated texture changes in 108 individuals, divided into three groups, matched in terms of sex and age: (1) healthy controls (n = 32); (2) patients with early‑stage PD (n = 39); and (3) patients with late‑stage PD and severe L‑dopa‑related complications (n = 37). All patients were assessed in off‑treatment conditions. Statistical analysis of first‑ and second‑order texture features was conducted in the substantia nigra, striatum, thalamus and sub‑thalamic nucleus. Regions of interest volumetry and voxel‑based morphometry were performed for comparison. Significantly different texture features were observed between the three populations, with some showing a gradual linear progression between the groups. The volumetric changes in the two PD patient groups were not significantly different. Texture features were significantly associated with clinical scores for motor handicap. These results suggest that texture features, measured in the nigrostriatal pathway at PD diagnosis, may be useful in predicting clinical progression of motor handicap.
Parkinson’s disease (PD) is characterized by the progressive loss of dopaminergic neurons in the nigrostriatal pathway1,2. Patients meet the clinical criteria for PD when 60–70% of the neurons in the substantia nigra have
degenerated and approximately 80% of the striatal dopamine content has been lost3,4. At present, the diagnosis of
PD is based primarily on clinical features. Conventional neuroimaging modalities are of proven value in assessing Parkinsonian patients. 123I-ioflupane striatal dopamine transporter SPECT (DaTSCAN) has been validated as a
tool for the differential diagnosis of PD and non-degenerative tremors, and 123I-metaiodobenzylguanidine SPECT
and 18F-fluorodeoxyglucose PET have been used for the differential diagnosis of PD and atypical Parkinsonism.
The very high cost and limited availability of these technologies prevent their widespread and systematic use in routine clinical practice. Moreover, these methods have not been demonstrated to have any prognostic value5.
Magnetic resonance imaging (MRI), with different modalities having diverse tissue-specific sensitivities, is useful for investigating brain degeneration to differentiate between PD and other Parkinsonian syndromes. T2* relaxometry and susceptibility-weighted mapping can be used to quantify the iron load and nigral degeneration. Patients with PD have an abnormally low T2 to T2* ratio and, reciprocally, an abnormally high R2 to R2* ratio6,
while resting state functional connectivity maps describe functional networks; the main finding is that these net-works have fewer connections in patients with PD7. However, due to the fact that Parkinson’s disease’s diagnosis
is based on clinical examinations, in addition to the non-availability of all these MR sequences in daily routine and the lack of consensus on the interpretation of images through dedicated software, none of these methods is currently used in clinical practice for diagnostic, therapeutic or prognostic purposes.
OPEN
1Université de Lille, INSERM, U1172, CHU-Lille, Lille Neuroscience Cognition Research Centre, 1 place de
Verdun, 59000 Lille, France. 2Neurology and Movement Disorders Department, CHU Lille, Licend, 59000 Lille,
France. 3CATI, Institut du Cerveau et de le Moelle Epinière, INSERM, U1127, CNRS, UMR7225, Sorbonne,
Université, 75013 Paris, France. 4Department of Neuroradiology, CHU Lille, Licend, 59000 Lille, France. *email:
Structural imaging, using T1-weighted sequences, has also been investigated and different studies have reported changes in grey matter volume and cortical changes, mainly linked to disease-related cognitive decline8,9.
The techniques used can be classified into regions-of-interest (ROI)-based approaches with manual labelling, automatic or semi-automatic segmentation, voxel-based whole-brain morphometric analysis using voxel-based morphometry (VBM) or tensor-based morphometry (TBM), and surface or shape-based approaches mainly for cortical thickness analysis. The main results of these studies are inconsistent, however, suggesting that this imaging technique is not sensitive enough and is of little diagnostic value10. Conversely, optimized
neuromelanin-sensitive T1-weighted scans have revealed stage-dependent substantia nigra signal reduction in PD as a putative marker of neuromelanin loss11.
In the present study, we investigated post-processing of T1-weighted images using texture analysis after hypothesizing that the computed features in different key anatomical structures could be clinically meaningful in differentiating between PD patients and controls and show a specific progressive pattern between two critical periods of the disease: diagnosis (early-stage) and severe L-dopa-related complications (late-stage). A number of studies of MRI sequences in patients with Alzheimer’s disease have already found that image texture analysis is more sensitive than conventional atrophy measurements, such ROI volumetry and VBM12,13. In a longitudinal
study of PD patients with a 2-year follow-up using T2-weighted images, Sikiö et al.14, described texture analysis
as a quantitative method for detecting structural changes in brain MR images and this was significantly related to clinical scores for PD severity. The Unified Parkinson’s Disease Rating Scale (UPDRS) 1 score evaluating the cognition, behaviour and mood, correlated with texture features extracted from the area of posterior corona radiata and from the substantia nigra. UPDRS-II which scores the self-evaluation of the activities of daily liv-ing correlated with texture features from the putamen, the dentate nucleus and the thalamus while UPDRS-III score evaluating the motor examination, correlated with features in the area of basilar pons. Li et al.15 described
the use of quantitative susceptibility-weighted and R2* MR maps to discriminate between patients and healthy controls. More recently, our group has described some texture features as markers of cognitive decline with a better sensitivity than ROI- and VBM-based techniques16.
Results
Volumetry and morphometry.
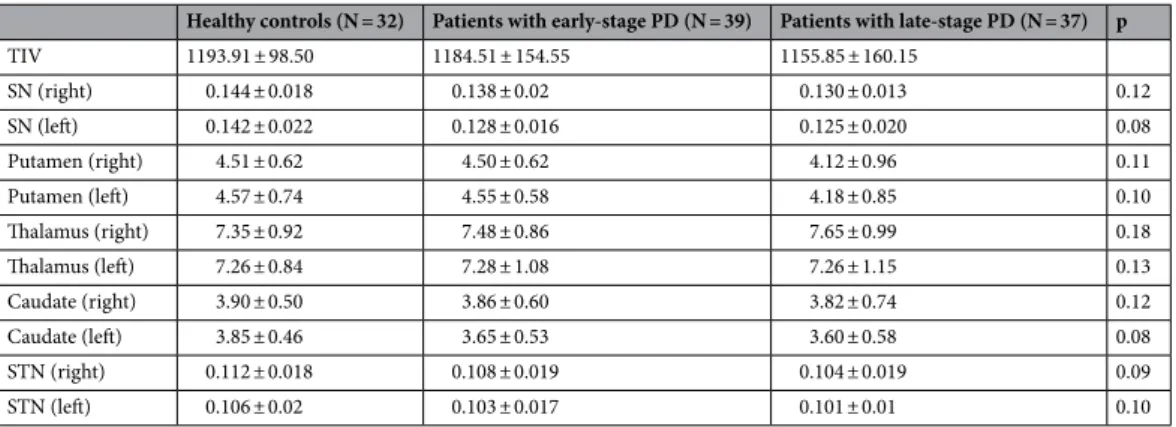
There was no significant difference in volume of any of the five brain regions between the two PD groups and the healthy controls. The results of these analyses are shown in Table 1. When compared using the VBM approach, the three groups exhibited significant differences only when the con-trol group was compared with one of the PD patients groups (Fig. 1). These differences were mainly in the deep grey matter structures. No significant difference was found between the two PD patient groups.Texture features.
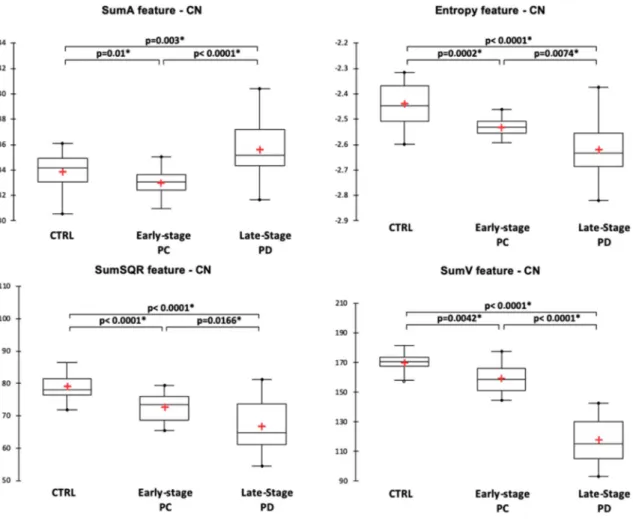
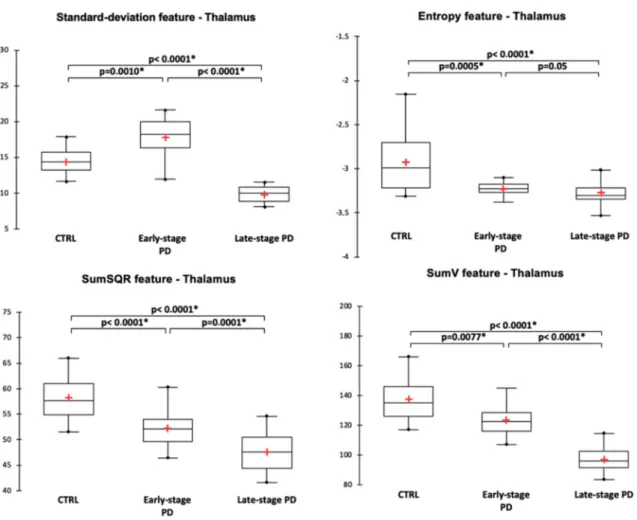
The ANOVA analyses run on the texture features in the five brain structures revealed significant differences between the three groups, with different profiles. For group pair-wise comparisons, sig-nificance was considered at p < 0.02 after FDR correction.For the substantia nigra, texture features were significantly different between the three groups and pair-wise post-hoc tests showed that the different features expressed as contrast, entropy, sum variance (sumV) and sum square (sumSQR) were significantly different between the groups. Figure 2 illustrates the distribution of the significantly different texture features. In the striatum, different texture features exhibited pair-wise differences between the three populations. For the putamen (Fig. 3), it was the case for the mean, sumV and correlation features, while for the caudate nucleus (Fig. 4), it was the case for sumA, entropy, sumSQR and sumV. For the thalamus, pair-wise differences were found for the standard-deviation, sumSQR, sumV and entropy features (Fig. 5). Lastly, for sub-thalamic nucleus, this particular structure in terms of volume, two texture features: entropy and sumSQR showed pair-wise differences between the three groups.
Table 1. Region of interest-based volumes (expressed in cm3) and results of ANOVA for intergroup
comparisons after normalization against total intracranial volume. PD Parkinson’s disease, TIV total intracranial volume, SN substantia nigra, STN sub-thalamic nucleus.
Healthy controls (N = 32) Patients with early-stage PD (N = 39) Patients with late-stage PD (N = 37) p
TIV 1193.91 ± 98.50 1184.51 ± 154.55 1155.85 ± 160.15 SN (right) 0.144 ± 0.018 0.138 ± 0.02 0.130 ± 0.013 0.12 SN (left) 0.142 ± 0.022 0.128 ± 0.016 0.125 ± 0.020 0.08 Putamen (right) 4.51 ± 0.62 4.50 ± 0.62 4.12 ± 0.96 0.11 Putamen (left) 4.57 ± 0.74 4.55 ± 0.58 4.18 ± 0.85 0.10 Thalamus (right) 7.35 ± 0.92 7.48 ± 0.86 7.65 ± 0.99 0.18 Thalamus (left) 7.26 ± 0.84 7.28 ± 1.08 7.26 ± 1.15 0.13 Caudate (right) 3.90 ± 0.50 3.86 ± 0.60 3.82 ± 0.74 0.12 Caudate (left) 3.85 ± 0.46 3.65 ± 0.53 3.60 ± 0.58 0.08 STN (right) 0.112 ± 0.018 0.108 ± 0.019 0.104 ± 0.019 0.09 STN (left) 0.106 ± 0.02 0.103 ± 0.017 0.101 ± 0.01 0.10
3 Scientific Reports | (2021) 11:2724 | https://doi.org/10.1038/s41598-021-81209-4
www.nature.com/scientificreports/
Individual classification using texture features.
The regression analysis using the LASSO method showed that three texture features from second-order statistics: entropy, sumSQR and sumV, computed in the five brain regions were the best independent predictors in building a classification model. These features, as it was shown in Figs. 2, 3, 4 and 5, were significantly different between the three populations with a gradual pro-gression from the healthy controls to late-stage PD patients. The discriminatory powers of these texture features between the two PD patient groups were analysed using ROC analysis. The results are summarized in Table 2.Texture feature and clinical scores.
The correlation analyses with the clinical scores: MDS-UPDRS III and Hoen-Yahr score in off-treatment conditions as well as the MDS-UPDRS total score focused on the same features. After FDR correction, entropy showed significant negative correlations with the three clinical scores (r = − 0.50, p < 0.0001, r = − 0.30, p = 0.01 and r = − 0.45, p = 0.001, respectively) in the substantia nigra. For the putamen, a correlation was found only for the Hoen–Yahr score (r = − 0.30, p = 0.01). For the caudate nucleus, entropy was correlated with the MDS-UPDRS III (r = − 0.41, p = 0.0004) and MDS-UPDRS total (r = − 0.36, p = 0.002) while for the thalamus, it correlated significantly with the three scores (r = − 0.48, p = 0.01, r = − 0.28, p = 0.01 and r = − 0.44, p = 0.002, respectively).For the feature sumV, significant negative correlations were found with the three clinical scores in the substan-tia nigra (r = − 0.38, p = 0.002, r = − 0.28, p = 0.01, r = − 0.37, p = 0.002, respectively), caudate nucleus (r = − 0.64, p < 0.0001, r = − 0.49, p < 0.0001, r = − 0.64, p < 0.0001, respectively) and thalamus (r = 0.67, p < 0.0001, r = -0.39, p = 0.001, r = -0.64, p < 0.0001, respectively). For the putamen, this feature correlated with the two MDS-UPDRS scores (r = -0.35, p = 0.003 for MDS-UPDRS III and r = -0.35, p = 0.002 for MDS-UPDRS total).
Finally, for sumSQR, significant correlations with the three clinical scores were found only for the substantia nigra (r = − 0.45, p < 0.0001, r = − 0.27, p = 0.003, r = − 0.40, p = 0.001, respectively). For the caudate nucleus, a significant correlation was found for the MDS-UPDRS III (r = − 0.26, p < 0.015). For the thalamus, correlations were found for the two MDS scores: (r = − 0.45, p < 0.0001 for the MDS-UPDRS III and r = − 0.39, p = 0.001 for the MDS-UPDRS total).
Discussion
This study investigated T1-weighted MR image texture features that could potentially be used as imaging mark-ers in PD. This imaging sequence is standard in neuroimaging. The method was applied to three populations matched in terms of age and sex. The first population comprised healthy controls while the other two consisted of PD patients at two pivotal stages of the disease: diagnosis (early-PD), when a surrogate biomarker is needed, and late-stage PD with severe L-dopa-related complications, which represents the endpoint for the classical seg-mental motor handicap of PD. The texture features were computed in different grey matter structures considered as key structures in PD. In addition to the substantia nigra, the primary site of the disease, the putamen and caudate nucleus were also considered as they are directly downstream from the substantia nigra17. The
thala-mus was considered as the master relay station for brain structures, connecting the basal ganglia to the cortical regions, traditionally associated with the disease, and finally, the sub-thalamic nucleus was investigated as it has an important role in the motor system and is of clinical interest as a target in deep brain stimulation. For each
Figure 1. Voxel based morphometry analysis results indicating regions where structural changes between the
groups were found using the contrast gray matter in the group 1 > gray matter in the group 2. (a) When the healthy group was compared against the early-stage Parkinson’s disease group. (b) When the healthy group was compared against the late-stage Parkinson’s disease group. Images created by SPM12, Welcome Trust Centre for NeuroImaging, London, UK; http://fil.ion.ucl.ac.uk/spm/softw are/spm12 /).
structure, 12 texture features from first- and second-order statistics were computed enabling us to obtain a broad description of the grey matter variations inside in each structure.
The structures considered are functionally different in terms of their involvement in PD and its progression at different stages. The substantia nigra and sub-thalamic nucleus have small volumes and may be less suitable for texture analysis. Nevertheless, our results show that some features differed significantly between the three popu-lations. These results confirm the working hypothesis that texture features that quantify grey matter variations can be more sensitive than atrophy measurement methods such as ROI-based volumetry and morphometry. By comparison, in the ROI-based approach, although a global volume diminution can be observed from the healthy group to the late-stage PD group (Table 1), no statistically significant differences were found, while in the VBM approach, differences were observed only when the healthy group was considered against the PD groups (Fig. 1). This approach acts voxel by voxel and consequently can be considered as close to the texture analysis formalism.
The results were more significant in the substantia nigra than in the putamen and to a lesser extent in the caudate nucleus, thalamus and sub-thalamic nucleus. This is congruent with the classical pattern of degeneration predominant in the substantia nigra and putamen at the time of diagnosis and progression in these areas together with the progression of motor handicap18. The discriminatory powers of the texture features for the
classifica-tion of PD patients were also examined using ROC analysis and showed that in most cases the AUC was > 0.5. Our study also showed that texture features were correlated with classical motor handicap scores in PD. This result suggests that grey matter variations quantified by texture could be clinically meaningful.
By design, texture analysis seems to be less affected by the accuracy of the boundaries of the brain structures than volumetry methods. The most widely used segmentation techniques are still prone to low precision and systematic bias, whereas manual segmentation is time consuming and susceptible to inter-observer variability19.
In a previous study20, we reported the results on the stability and reproducibility of texture features in the
hip-pocampus and entorhinal cortex for discriminating patients with cognitive impairment after a stroke. VBM approaches, that operate on the whole brain, are not reliant on structure definition, but may be hampered by differences in experimental design as the choice of multiple comparison correction techniques lead to differing results21,22. Furthermore, in PD, texture features were reported to have higher sensitivity for the detection of
slight cognitive slowing16.
Our analysis showed that among the 12 texture features considered, three second-order features: entropy, sumV and sumSQR, consistently showed significant differences with a gradual decrease from the healthy con-trol group to late-stage PD. These results are consistent with those of Li et al.15, where different texture features
computed in the substantia nigra on quantitative susceptibility and R2* maps were able to differentiate PD patients from healthy volunteers. These authors identified entropy as one of the most discriminating features, with significantly lower values in the PD patient group. Entropy represents a measure of randomness in the MR signal distribution while sumSQR and sumV reflect signal variation. However, without an anatomo-histological validation study associating a biological signature to each feature, it will remain difficult to have a complete understanding of these texture features.
In-homogeneities and inter-machine variability in T1-weighted signal distribution that can hamper the use of texture analysis were mitigated by the application of normalized grey levels using a N3 algorithm. This pro-cessing allowed the standardization of grey level value distributions. Furthermore, the three texture features that
Figure 2. Comparison of texture features in the substantia nigra between healthy controls (CTRL), early-stage
5 Scientific Reports | (2021) 11:2724 | https://doi.org/10.1038/s41598-021-81209-4
www.nature.com/scientificreports/
appeared as potential markers of PD were obtained from second-order statistics. In contrast to first-order statistic features that are computed directly from the signal values, these features are computed from the co-occurrence matrix making them less sensitive to signal variations.
Finally, it is important to consider the clinical implications of the results of this study. Different studies have attempted to evaluate structural imaging as a tool for the early diagnosis of PD and for differentiating between PD and atypical Parkinsonism. However, despite these efforts, the reality is that there is not enough statistical separation of single-structure measurements between PD and non-PD subjects to be of clinical use10. The
cur-rent trends suggest considering a pattern of atrophy across several structures23. The approach proposed here is
in line with these trends; the combination of different features, computed in different structures of interest, is more suitable for machine learning and prediction models to make individualized patient decisions. A multi-parametric and multi-modality solution, involving different MR sequences (T1 and R2*) and/or SPECT images may enhance the predictive ability of the model24,25.
Methods
Study population.
The PD population was enrolled consecutively, from the movement disorders depart-ment of Lille university hospital, following the inclusion and non-inclusion criteria, described below, of early PD at the time of diagnosis and advanced PD at the time of motor fluctuations. In a second step, healthy con-trols were selected to match to the age and sex ratio of the PD patients. The healthy concon-trols were recruited among spouses and caregivers who did not have neurological pathologies or other serious conditions (progres-sive inflammatory or cancerous pathology). There were no secondary exclusions after inclusions for medical (claustrophobia, incidentaloma, etc.) or technical (artifacts, etc.) reasons.Thirty-nine de novo diagnosed patients before any symptomatic treatment, mean disease duration 0.45 year, and median Hoehn–Yahr stage 2 (min = 0 and max = 3) and late-stage patients with severe motor fluctuations and candidate for second-line treatments (i.e. apomorphine pump, deep brain stimulation, DUODOPA), mean disease duration 8.45 years, and median Hoehn–Yahr stage 2.5 (min = 1 and max = 5) were included. All patients met the Movement Disorders Society (MDS) clinical criteria for the diagnosis of PD26. Patients with severe
cognitive impairment or dementia [Montreal Cognitive Assessment score < 22 and as defined by the Diagnostic and Statistical Manual of Mental Disorders, Fourth Edition (DSM-IV) criteria], patients with psychiatric disor-ders (psychosis, hallucinations, compulsive disordisor-ders, substance addiction, bipolar disorder, severe depression,
Figure 3. Comparison of texture features in the putamen between healthy controls (CTRL), early-stage PD and
according to the DSM-IV), as assessed in a semi-structured interview with a psychiatrist, and patients with severe brain atrophy or abnormal MRI results for any reason other than PD were excluded from the study.
The demographic description of the population and clinical characteristics of the patients are summarized in Table 3.
The study was approved by the institutional review board (Comité de Protection des Personnes (CPP) Nord Ouest IV, Lille, France; study reference: 2013-A00193-42). All participants provided their written, informed consent before participation. The study complied strictly with the methods, guidelines and regulations described in the approved protocol.
Image acquisition and structures of interest.
All patients and controls were scanned using 3 T MRI sys-tems (PHILIPS Healthcare, Best, Netherlands) with an 8-channel sensitivity encoding (SENSE) head coil. High-resolution 3D T1-weighted images were acquired in the sagittal plane with 1 mm2 isotropic pixel size, repetitiontime = 7.2 ms, echo time = 3.3 ms, flip angle = 9°, field of view = 240 × 256 mm2; acquisition matrix = 256 × 256;
slice thickness = 1 mm and 176 continuous slices.
A loss of nigral dopaminergic neurons is strongly correlated with the motor impairments that characterize PD27. However, regions of cell loss also include the caudate nucleus28, thalamus29 and putamen30. For this study,
we considered the following deep grey matter structures: substantia nigra, putamen, thalamus, caudate nucleus and sub-thalamic nucleus. For the putamen, thalamus and caudate nucleus, the left and right parts of each hemi-sphere were extracted from the images using Freesurfer. The substantia nigra and sub-thalamic nucleus were segmented using in-house software that implements an atlas-based approach for the substantia nigra atlas31 and
the sub-thalamic nucleus atlas32. The results were checked visually and corrected as appropriate.
Volumetry and morphometry.
Classical MRI approaches based on brain atrophy measurement were investigated to test for group differences. ROI based volumetry and VBM were used. For the first, bilateral vol-umes of each structure, described above, were estimated from the segmentation data. Normalization was done by dividing each individual volume by the intracranial volume (ICV)33. The ICV was estimated as a part of thestatic FreeSurfer pipeline using a method described in Buckner et al.34.
For the VBM method, images were processed using the SPM12 DARTEL toolbox (Welcome Trust Centre for NeuroImaging, London, UK; http://fil.ion.ucl.ac.uk/spm/softw are/spm12 /) with default settings35.
Figure 4. Comparison of texture features in the caudate-nucleus between healthy controls (CTRL), early-stage
7 Scientific Reports | (2021) 11:2724 | https://doi.org/10.1038/s41598-021-81209-4
www.nature.com/scientificreports/
Texture features.
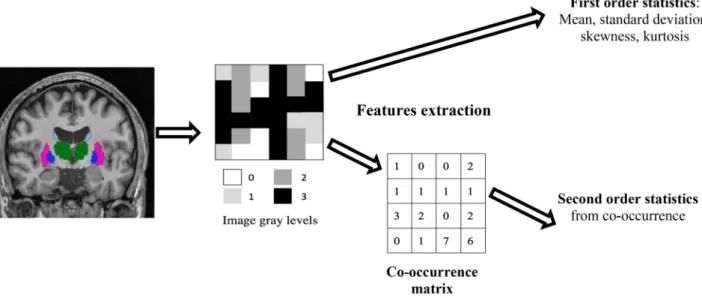
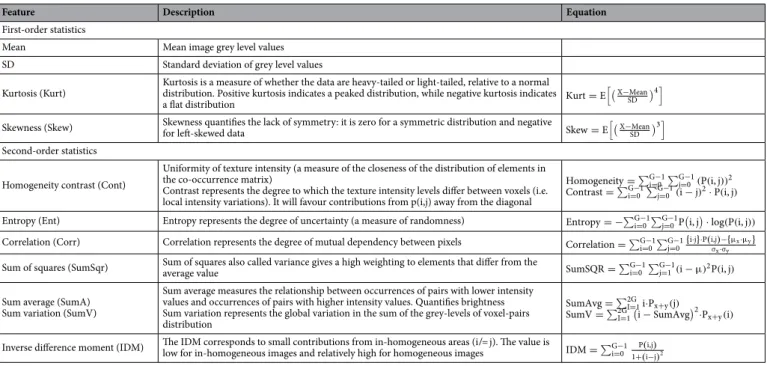
Image texture can be described using different features. In this study, under the assump-tion that the neural loss induced by the disease progression affects the signal distribuassump-tion in the region of interest, texture was captured using features from the first order statistics and in order to take into account the neighbourhood in gray levels variation, second order statistics, derived from the co-occurrence matrices were used (Fig. 6). In total, twelve texture features were computed: four from first-order statistics and six from second-order statistics, used in our previous investigation16. The first-order parameters included mean greylevel, standard deviation (SD) of grey levels, kurtosis (a measure of whether intensities are heavy-tailed or light-tailed, relative to a normal distribution) and skewness (a measure of a lack of symmetry of the signal intensity). The second-order features (also known as Haralick texture features) quantify the relationships between pairs of neighbouring voxels in the image. The features were derived from the grey level co-occurrence matrix (GLCM); a spatial relationship was defined as the relative direction in a given direction d. In this study, the GLCM matrix was estimated by considering four directions (θ = 0°, 45°, 90° and 135°) and a distance d = 1. Using this matrix, the following features were computed: homogeneity, contrast, entropy, correlation, variance, sum average, sum variation and inverse different moment (IDM). All the features and their computation are described in Table 4.
Figure 5. Comparison of texture features in the thalamus between healthy controls (CTRL), early-stage PD and
late-stage PD patients.
Table 2. Receiver operating characteristic (ROC) analysis of the three texture features entropy, sum square
(SumSQR) and sum variance (SumV) for discrimination of the two PD patient groups. AUC area under the curve, Sp specificity, Se sensitivity.
Entropy SumSQR SumV
AUC Sp Se AUC Sp Se AUC Sp Se
Substantia nigra 0.76 0.72 0.73 0.66 0.65 0.70 0.71 0.74 0.73
Putamen < 0.5 < 0.5 0.62 0.65 0.66
Caudate nucleus 0.63 0.66 0.65 0.55 0.58 0.56 0.64 0.65 0.65
Thalamus 0.54 0.56 0.57 0.69 0.70 0.70 0.79 0.78 0.78
For each brain structure and each feature, calculation was done for the right and left sides and then averaged. Texture features may be affected by MR signal in-homogeneities and inter-machine variability in T1-weighted sequences making their reproducibility questionable. In order to ensure reproducibility, the images were cor-rected for field bias and in-homogeneities using the nonparametric non-uniform intensity normalization algo-rithm (N3). This processing allowed standardization of grey level value distributions (FreeSurfer software package (version 6.0)36.
Statistical analysis.
Texture features and ROI-based volumes were compared between the three groups using ANOVA with significance fixed at p < 0.05. If appropriate, t tests with false rate discovery (FDR) correction were then run for pair-wise comparisons. For the VBM, t tests were performed to identify differences in whole brain grey matter volume. Clusters were considered significant with a threshold in terms of size fixed to 10 voxels and after controlling for family-wise errors rate using FDR.Regression analysis using the least absolute shrinkage and selection operator (LASSO) method was run on the statistically significant texture features to select the best independent predictors. The LASSO analysis was run by considering the three groups. The individual classification capabilities in separating the two PD groups of the selected features were subsequently measured using area under curve (AUC) analysis.
Correlations between the texture features and classical clinical motor scores (MDS-UPDRS III, Hoehn–Yahr score and MDS-UPDRS total) were investigated using Spearman’s correlation coefficient with significance fixed at p < 0.05 and corrected using FDR.
Table 3. Demographic and clinical characteristics of the three study populations. M male, F female, PD
Parkinson’s disease, MDS-UPDRS Movement Disorders Society-Unified Parkinson’s Disease Rating Scale, OFF off-treatment. *Pearson’s Chi-squared test. **ANOVA. #Mann–Whitney test.
Healthy controls (N = 32) Patients with early-stage PD (N = 39) Patients with late-stage PD (N = 37) p
Sex (M/F) 18/14 22/17 22/15 0.30*
Age (years) 61.6 ± 10.8 63 ± 10.4 60.75 ± 9.6 0.40**
Disease duration (years) – 0.45 ± 0.46 8.5 ± 3.9 < 0.0001#
Hoehn–Yahr score (OFF) – 2 (0–3) 2.5 (1–5) < 0.0001#
MDS-UPDRS 1 – 8.25 ± 5.70 10.2 ± 4.9 0.02#
MDS-UPDRS 2 – 5.66 ± 4.09 17.8 ± 7.16 < 0.0001#
MDS-UPDRS 3 (OFF) – 17.15 ± 7.40 45.42 ± 16.38 < 0.0001#
MDS-UPDRS 4 – 0 9.0 ± 3.7 –
MDS-UPDRS total – 32.05 ± 12.94 78.86 ± 24.44 < 0.0001#
Figure 6. Texture features extraction scheme. For each brain structure represented as a region of interest
segmented on the T1w MR images, gray levels variation is captured without taking into account voxels neighbouring using first order statistics and by considering the neighbourhood by converting the gray levels into a co-occurrence matrix and then extracting the second order statistics.
9 Scientific Reports | (2021) 11:2724 | https://doi.org/10.1038/s41598-021-81209-4
www.nature.com/scientificreports/
Texture features were computed using in-house software and the XLSTAT software plug-in (AddinSoft, www. xlsta t.com) was used to perform all statistical tests. The code package as well as all the data used in this study are available for download.
Received: 4 September 2020; Accepted: 28 December 2020
References
1. Fearnley, J. M. & Lees, A. J. Ageing and Parkinson’s disease: Substantia nigra regional selectivity. Brain 114, 2283–2301 (1991). 2. Kordower, J. H. et al. Disease duration and the integrity of the nigrostriatal system in Parkinson’s disease. Brain 136, 2419–2431
(2013).
3. Riederer, P. & Wuketich, S. Time course of nigrostriatal degeneration in Parkinson’s disease. A detailed study of influential factors in human brain amine analysis. J. Neural. Transm. 38, 277–301 (1976).
4. Diederich, N. J., James, S. D., Uchihara, T., Grillner, S. & Goetz, C. G. Parkinson’s disease: Is it a consequence of human brain evolution?. Mov. Disord. 34, 453–459 (2019).
5. Pagano, G., Niccolini, F. & Politis, M. Imaging in Parkinson’s disease. Clin. Med. 16, 371–375 (2016).
6. Hopes, L. et al. Magnetic resonance imaging features of the nigrostriatal system: Biomarkers of Parkinson’s disease stages?. PLoS One
11, e0147947 (2016).
7. Pyatigorskaya, N., Gallea, C., Garcia-Lorenzo, D., Vidailhet, M. & Lehericy, S. A review of the use of magnetic resonance imaging in Parkinson’s disease. Ther. Adv. Neurol. Disord. 7, 206–220 (2014).
8. Gonzalez-Redondo, R. et al. Grey matter hypometabolism and atrophy in Parkinson’s disease with cognitive impairment: A two-step process. Brain 137, 2356–2367 (2014).
9. Feldmann, A. et al. Morphometric changes of grey matter in Parkinson’s disease with depression: A voxelbased morphometry study. Mov. Disord. 23, 42–46 (2008).
10. Sterling, N. W., Lewis, M. M., Du, G. & Huang, X. Structural imaging and Parkinson’s disease: Moving toward quantitative markers of disease progression. J. Parkinsons. Dis. 6, 557–567 (2016).
11. Schwarz, S. T. et al. T1-weighted MRI shows stage-dependent substantia nigra signal loss in Parkinson’s disease. Mov. Disord. 26, 1633–1638 (2011).
12. Sørensen, L. et al. Early detection of Alzheimer’s disease using MRI hippocampal texture. Hum. Brain. Mapp. 37, 1148–1161 (2016). 13. Hwang, E. J. et al. Texture analyses of quantitative susceptibility maps to differentiate Alzheimer’s disease from cognitive normal
and mild cognitive impairment. Med. Phys. 43, 4718–4728 (2016).
14. Sikiö, M. et al. MR image texture in Parkinson’s disease: A longitudinal study. Acta. Radiol. 56, 97–104 (2015).
15. Li, G. et al. 3D texture analyses within the substantia nigra of Parkinson’s disease patients on quantitative susceptibility maps and R2* maps. Neuroimage 188, 465–472 (2019).
16. Betrouni, N., Lopes, R., Defebvre, L., Leetjens, A. & Dujardin, K. Texture features of MR images: A marker of slight cognitive deficits in Parkinson’s disease. Mov. Disord. 35, 486–494 (2020).
17. Jellinger, K. A. Neuropathology of sporadic Parkinson’s disease: Evaluation and changes of concepts. Mov Disord. 27, 8–30 (2012). 18. Braak, H. et al. Staging of brain pathology related to sporadic Parkinson’s disease. Neurobiol. Aging. 24, 197–211 (2013). 19. Maltbie, E. et al. Asymmetric bias in user guided segmentations of brain structures. Neuroimage 59, 1315–1323 (2012). 20. Betrouni, N. et al. Texture features of magnetic resonance images: An early marker of post-stroke cognitive impairment. Transl.
Stroke. Res. 11, 643–652 (2020).
Table 4. Texture features considered, together with their significance, equations and models. G number of
grey levels used, I intensity value of a neighbour voxel, j intensity value of a reference pixel, P(i,j) probability of the appearance of the (i,j) pair in the co-occurrence matrix, µm ean value of P, Px and Py marginal probabilities, σx.σy SD of Px and Py, respectively. Px+y= G−1i=0
G−1
j=1 P(i, j) , i + j = k for k = 0,1….G−1.
Feature Description Equation
First-order statistics
Mean Mean image grey level values
SD Standard deviation of grey level values
Kurtosis (Kurt) Kurtosis is a measure of whether the data are heavy-tailed or light-tailed, relative to a normal distribution. Positive kurtosis indicates a peaked distribution, while negative kurtosis indicates
a flat distribution Kurt = E
X−Mean SD
4 Skewness (Skew) Skewness quantifies the lack of symmetry: it is zero for a symmetric distribution and negative for left-skewed data Skew = E X−MeanSD 3 Second-order statistics
Homogeneity contrast (Cont)
Uniformity of texture intensity (a measure of the closeness of the distribution of elements in the co-occurrence matrix)
Contrast represents the degree to which the texture intensity levels differ between voxels (i.e. local intensity variations). It will favour contributions from p(i,j) away from the diagonal
Homogeneity = G−1i=0 G−1j=0 (P(i, j))2 Contrast = G−1i=0 G−1j=0 (i − j)2·P(i, j) Entropy (Ent) Entropy represents the degree of uncertainty (a measure of randomness) Entropy = − G−1i=0 G−1j=0P i, j ·log(P(i, j)) Correlation (Corr) Correlation represents the degree of mutual dependency between pixels Correlation = G−1i=0 G−1j=0 {i·j}·P(i,j)−{µx·µy}
σx·σy
Sum of squares (SumSqr) Sum of squares also called variance gives a high weighting to elements that differ from the average value SumSQR = G−1i=0 G−1j=1(i − µ)2P(i, j) Sum average (SumA)
Sum variation (SumV)
Sum average measures the relationship between occurrences of pairs with lower intensity values and occurrences of pairs with higher intensity values. Quantifies brightness Sum variation represents the global variation in the sum of the grey-levels of voxel-pairs distribution
SumAvg = 2GI=1i·Px+y(j)
SumV = 2GI=1 i − SumAvg 2·Px+y(i) Inverse difference moment (IDM) The IDM corresponds to small contributions from in-homogeneous areas (i ̸ = j). The value is low for in-homogeneous images and relatively high for homogeneous images IDM = G−1i=0 P(i,j)
21. Pan, P. L., Song, W. & Shang, H. F. Voxel-wise meta-analysis of grey matter abnormalities in idiopathic Parkinson’s disease. Eur. J.
Neurol. 19, 199–206 (2012).
22. Agosta, F. et al. The topography of brain damage at different stages of Parkinson’s disease. Hum. Brain. Mapp. 34, 2798–2807 (2013). 23. Scherfler, C. et al. Diagnostic potential of automated subcortical volume segmentation in atypical parkinsonism. Neurology 86,
1242–1249 (2016).
24. Rahmim, A. et al. Improved prediction of outcome in Parkinson’s disease using radiomics analysis of longitudinal DAT SPECT images. Neuroimage. Clin. 16, 539–544 (2017).
25. Rahmim, A. et al. Application of texture analysis to DAT SPECT imaging: Relationship to clinical assessments. Neuroimage. Clin.
12, e1–e9 (2016).
26. Emre, M. et al. Clinical diagnostic criteria for dementia associated with Parkinson’s disease. Mov. Disord. 22, 1689–1707 (2007). 27. Guiney, S. J., Adlard, P. A., Bush, A. I., Finkelstein, D. I. & Ayton, S. Ferroptosis and cell death mechanisms in Parkinson’s disease.
Neurochem. Int. 104, 34–48 (2017).
28. Pitcher, T. L. et al. Reduced striatal volumes in Parkinson’s disease: A magnetic resonance imaging study. Transl. Neurodegener.
21, 1–17 (2012).
29. Tessa, C. et al. Progression of brain atrophy in the early stages of Parkinson’s disease: A longitudinal tensor-based morphometry study in de novo patients without cognitive impairment. Hum. Brain Mapp. 35, 3932–3944 (2014).
30. Nemmi, F., Sabatini, U., Rascol, O. & Péran, P. Parkinson’s disease and local atrophy in subcortical nuclei: Insight from shape analysis. Neurobiol. Aging. 36, 424–433 (2015).
31. Keuken, M. C. et al. Quantifying inter-individual anatomical variability in the subcortex using 7T structural MRI. Neuroimage 94, 40–46 (2014).
32. Forstmann, B. U. et al. Cortico-subthalamic white matter tract strength predict interindividual efficacy in stopping a motor response. Neuroimage 60, 370–375 (2012).
33. Sanfilipo, M. P. et al. Correction for intracranial volume in analysis of whole brain atrophy in multiple sclerosis: The proportion vs residual method. Neuroimage 22, 1732–1743 (2004).
34. Buckner, R. L. et al. A unified approach for morphometric and functional data analysis in young, old, and demented adults using automated atlas-based head size normalization: Reliability and validation against manual measurement of total intracranial volume.
Neuroimage 23, 724–739 (2004).
35. Ashburner, J. & Friston, K. J. Voxel-basedmor-phometry-themethods. Neuroimage 11, 805–821 (2000).
36. Fischl, B. et al. Whole brain segmentation: Automated labeling of neuroanatomical structures in the human brain. Neuron 33, 341–355 (2002).
Acknowledgements
The authors would like to thank the clinical imaging platform (CI2C) for making available the data for the healthy control group. The authors also thank all the members of the Centre for Acquisition and Treatment of Information (CATI) MRI facility and all members of the PREDISTIM study group.
Author contributions
N.B.: conceptualization, formal analysis; methodology; roles/writing—original draft; C.M.: funding acquisition; A.-S.R.: project administration; N.C.: investigation; M.C.: data curation; G.K.: writing—review and editing; R.L.: writing—review and editing; R.V.: data curation; L.D.: investigation; D.D.: methodology, funding acquisition, investigation, validation, supervision, writing—review and editing.
Funding
The study was funded by the France Parkinson charity and French Ministry of Health (PHRC national 2012). Funding was also received from Lille University Hospital, the Fédération de la Recherche Clinique du CHU de Lille and the clinical imaging platform (CI2C). This is an ancillary study to Protocol ID: 2013-A00193-42; ClinicalTrials.gov: NCT02360683.
Competing interests
The authors declare no competing interests.
Additional information
Correspondence and requests for materials should be addressed to N.B. Reprints and permissions information is available at www.nature.com/reprints.
Publisher’s note Springer Nature remains neutral with regard to jurisdictional claims in published maps and
institutional affiliations.
Open Access This article is licensed under a Creative Commons Attribution 4.0 International
License, which permits use, sharing, adaptation, distribution and reproduction in any medium or format, as long as you give appropriate credit to the original author(s) and the source, provide a link to the Creative Commons licence, and indicate if changes were made. The images or other third party material in this article are included in the article’s Creative Commons licence, unless indicated otherwise in a credit line to the material. If material is not included in the article’s Creative Commons licence and your intended use is not permitted by statutory regulation or exceeds the permitted use, you will need to obtain permission directly from the copyright holder. To view a copy of this licence, visit http://creat iveco mmons .org/licen ses/by/4.0/.