HAL Id: hal-00301975
https://hal.archives-ouvertes.fr/hal-00301975
Submitted on 13 Dec 2005HAL is a multi-disciplinary open access
archive for the deposit and dissemination of sci-entific research documents, whether they are pub-lished or not. The documents may come from teaching and research institutions in France or abroad, or from public or private research centers.
L’archive ouverte pluridisciplinaire HAL, est destinée au dépôt et à la diffusion de documents scientifiques de niveau recherche, publiés ou non, émanant des établissements d’enseignement et de recherche français ou étrangers, des laboratoires publics ou privés.
The use of tunnel concentration profile data to
determine the ratio of NO2/NOx directly emitted from
vehicles
X. Yao, N. T. Lau, C. K. Chan, M. Fang
To cite this version:
X. Yao, N. T. Lau, C. K. Chan, M. Fang. The use of tunnel concentration profile data to determine the ratio of NO2/NOx directly emitted from vehicles. Atmospheric Chemistry and Physics Discussions, European Geosciences Union, 2005, 5 (6), pp.12723-12740. �hal-00301975�
ACPD
5, 12723–12740, 2005The ratio of NO2/NOx directly emitted from
vehicles X. Yao et al. Title Page Abstract Introduction Conclusions References Tables Figures J I J I Back Close
Full Screen / Esc
Print Version Interactive Discussion
EGU Atmos. Chem. Phys. Discuss., 5, 12723–12740, 2005
www.atmos-chem-phys.org/acpd/5/12723/ SRef-ID: 1680-7375/acpd/2005-5-12723 European Geosciences Union
Atmospheric Chemistry and Physics Discussions
The use of tunnel concentration profile
data to determine the ratio of NO
2
/NO
x
directly emitted from vehicles
X. Yao1, N. T. Lau1, C. K. Chan2, and M. Fang1
1
Institute for the Environment, The Hong Kong University of Science and Technology, Clear Water Bay, Hong Kong, China
2
Department of Chemical Engineering, The Hong Kong University of Science and Technology, Clear Water Bay, Hong Kong, China
Received: 29 September 2005 – Accepted: 21 November 2005 – Published: 13 December 2005
Correspondence to: M. Fang (fangming@ust.hk)
© 2005 Author(s). This work is licensed under a Creative Commons License.
ACPD
5, 12723–12740, 2005The ratio of NO2/NOx directly emitted from
vehicles X. Yao et al. Title Page Abstract Introduction Conclusions References Tables Figures J I J I Back Close
Full Screen / Esc
Print Version Interactive Discussion
EGU Abstract
Recently, it is reported that primary vehicular NO2/NOxratio to be 10–30% and primary vehicular NO2 has raised much interest and concern in the control of NO2 in urban areas. In this study, primary vehicular NO2/NOx ratio in Hong Kong was investigated based on intensive long tunnel (3.7–4 km in length) experiments where concentration
5
profiles of air pollutants along the entire lengths of the tunnels were obtained. Long tunnels were selected because of the inherent low O3 concentrations in the partially enclosed environment. In addition the concentrations of pollutants from vehicles are high. Thus, the NO2measured inside long tunnels would be more representative of the primary NO2 emitted by vehicles and contribution due to atmospheric transformation
10
would be limited. This dataset was supported by a long-term on-road air quality dataset (June 2002–August 2003). Both datasets were obtained using the Mobile Real-time Air Monitoring Platform (MAP). The primary on-road vehicular NO2/NOxratio was less than 2%, detected in the mid sections of tunnels investigated, where O3 concentration was at a minimum. In sections of the tunnels (entrance and exit) where O3concentrations
15
were relatively high, the NO2/NOx ratio could be as high as 19%. Long-term (annual average) on-road air quality data in open air yielded NO2/NOxratios up to 28%. Thus, it is apparent that directly emitted NO2from vehicles is not significant in atmospheric NO2 concentration. A simple model was used to segregate the contribution of background NO2and transformed NO2measured in vehicle plumes.
20
1. Introduction
NO2 plays a central role in tropospheric chemistry. NO2 in urban atmosphere origi-nates mainly from primary emissions of combustion processes and oxidation of NO. Recently, primary vehicular NO2 raised much interest and concern in NO2 control in urban areas (Harrison and Shi, 1996; Carslaw and Beevers, 2004a, b, 2005; Soltic and
25
ACPD
5, 12723–12740, 2005The ratio of NO2/NOx directly emitted from
vehicles X. Yao et al. Title Page Abstract Introduction Conclusions References Tables Figures J I J I Back Close
Full Screen / Esc
Print Version Interactive Discussion
EGU 2–5% to ∼30% (Lenner and Lindqvist, 1983; Cariappa et al., 1994; Harrison and Shi,
1996; Clapp and Jenkin, 2001; Jimenez et al., 2001; Carslaw and Beevers, 2004a, b, 2005; Jenkin, 2004a, b; Soltic and Weilenmann, 2004). The lower ratio (2–5%) is the widely accepted value for gasoline engines under normal driving conditions (Hilliard and Wheeler, 1979). Two methods were used in these experiments: direct
measure-5
ments using chassis dynamometers equipped with dilution system and remote sensing technology, and indirect measurements in tunnels at pre-determined spots, and con-ventional stationary (including roadside) monitoring. One of the difficulties encountered in these methods is how to isolate primary vehicular NO2from background and trans-formed NO2. A more definitive primary NO2/NOx ratio would be very useful in the
10
understanding of the transformation of this pollution in the atmosphere.
NOx concentrations at tailpipes vary from a few ppm to hundreds of ppm depend-ing on engine operatdepend-ing conditions and efficiency of the three-way catalytic converter installed (Turns, 1996). NO can be converted to NO2by a number of reactions, e.g.:
2NO+ O2→ 2NO2, (1) 15 NO+ O3→ NO2+ O2, (2) NO+ HO2→ NO2+ OH, (3) NO+ RO2→ NO2+ RO, (4) . . .
Reaction (1) is not important in NO2production compared to the O3and free radical
20
reactions (Finlayson-Pitts and Pitts Jr., 2000), thus the ubiquitous O3in the atmosphere makes it difficult to determine the amount of NO2directly emitted from vehicles.
Reaction (2) is a fast reaction. The formation rate of NO2at 298 K by Reaction (2) is estimated to be 27% min−1when O3is constant at 10 ppb. In urban area, it is reported that HO2concentration was as high as 0.01 ppb (Hard et al., 1992). The formation rate
25
of NO2at 298 K by Reaction (3) is about 8% min−1when HO2is constant at 0.01 ppb. If Reaction (2) is considered alone, the amount of NO2generated is same as the amount of O3 reacted. Thus, (NO2+O3) is conserved. (NO2+O3) is not conserved when the
ACPD
5, 12723–12740, 2005The ratio of NO2/NOx directly emitted from
vehicles X. Yao et al. Title Page Abstract Introduction Conclusions References Tables Figures J I J I Back Close
Full Screen / Esc
Print Version Interactive Discussion
EGU NOx and volatile organic carbon (VOC) reactions such as Reactions (3–4) take place
resulting in a net increase of (NO2+O3) (Finlayson-Pitts and Pitts Jr., 2000; So and Wang, 2003).
In this study, intensive high-resolution air pollutant concentration profiles along the entire lengths of tunnels (3.7–4.0 km in lengths) were measured to estimate the primary
5
vehicular NO2/NOx ratios and to study the oxidation of NO to NO2 in vehicle plumes. The dataset was obtained using the Mobile Real-time Air Monitoring Platform (MAP). The advantages of the tunnel measurements are:
1. Tunnels are ideal for studying vehicular emissions because the space is confined and the conditions are “controlled”. The main source of air pollutants is vehicular
10
(fresh and aged) and the NOxconcentration can reach several ppm.
2. In the absence of solar irradiation inside tunnels, O3 concentration is inherently low and Reaction (2) is not favored. This in turn inhibits the O3-involved reac-tions. However, dark chemical reactions still can take place (Cariappa et al., 1994; Finlayson-Pitts and Pitts Jr., 2000). MAP concentration profile data allow
15
the pinpointing of the exact location of the lowest O3 concentration where HO2 and RO2 free radicals are also possibly the lowest, and, therefore, primary NO2 is expected to be more prominent. In other words, the interference due to Reac-tions (2–4) could be reasonably isolated.
Notably, volatile organic compounds (VOC) are still present and in high concentrations.
20
The tunnel results were supported by a long-term on-road air quality dataset (June 2002–August 2003), also obtained using MAP, for seasonal variation and statistical average of this ratio in open space.
2. Experimental
Two tunnels in Hong Kong were used in the study. The Tate Cairn’s Tunnel (TCT) is
25
ACPD
5, 12723–12740, 2005The ratio of NO2/NOx directly emitted from
vehicles X. Yao et al. Title Page Abstract Introduction Conclusions References Tables Figures J I J I Back Close
Full Screen / Esc
Print Version Interactive Discussion
EGU is negligible in both tunnels. Both tunnels have two separated tubes, two-lane tubes
in TCT and three-lane in TLT. The daily average traffic volumes in TCT and TLT were 62 600 and 45 400 vehicles day−1, respectively, during the experiments. The ratio of diesel trucks to passenger vehicles in TCT was 25% while it was 43% in TLT. The di ffer-ence in the daily averaged traffic flow and traffic compositions between the southbound
5
and northbound tubes in the same tunnels at the same time was negligible, although a diurnal variation of traffic flow existed.
A longitudinal ventilation system with 16 fresh air fans is used in TCT with a total fresh air supply of 6 912 000 m3 hr−1, while a semi-transverse ventilation system with 24 fresh air fans and 15 exhaust air fans is used in TLT with a total fresh air supply
10
of 42 200 000 m3 hr−1 and a total exhaust air flux of 6 140 000 m3 hr−1. Ten sets of CO, NO2, NO and visibility sensors are used to monitor air quality in the two tunnels to control the ventilation.
The Mobile Real-time Air Monitoring Platform (MAP) developed at the Hong Kong University of Science and Technology was used to make the tunnel measurements.
15
The details have been reported in Yao et al. (2005a, b). Stand-alone NOx, O3and CO gas analyzers (API, Inc.) onboard MAP were used to obtain the concentration profiles. The intensive tunnel measurements were made in September 2004 and May 2005. For each tunnel, the average air pollutant concentrations were computed from five runs. The NOxmonitor reported concentration data in 10–20 s spans. The speed of vehicles
20
in the tunnels was limited to 70 km hr−1. Thus, the spatial resolution of NO2 and NOx concentrations in the tunnels was 300 m.
The long-term on-road dataset consists of a total of 126 days (runs) of air pollutant data (June 2002–August 2003). In each run, MAP measured air pollutants nominally from 10:00 to 16:00. Traffic conditions included low traffic country roads, highways
25
heavily traveled by heavy-duty trucks, city streets and tunnels.
ACPD
5, 12723–12740, 2005The ratio of NO2/NOx directly emitted from
vehicles X. Yao et al. Title Page Abstract Introduction Conclusions References Tables Figures J I J I Back Close
Full Screen / Esc
Print Version Interactive Discussion
EGU 3. Results
3.1. Concentration profiles of NO and NO2in tunnels
There was no evident difference in the measured air pollutant concentrations between the southbound and the northbound tubes of TCT at similar times (rush hour or non-rush hour in daytime). Averages of the two tubes of TCT will be discussed instead of
5
treating them separately. However, a large difference was found in TLT between the two tubes probably due to fuels from different sources used in the vehicles. Ultra low sulfur-content fuel (<150 ppm for gasoline and <50 ppm for diesel) is used in Hong Kong while the sulfur-content is <800 ppm for gasoline and <2000 ppm for diesel across the border north of Hong Kong. When heavy-duty trucks return to Hong Kong, the
10
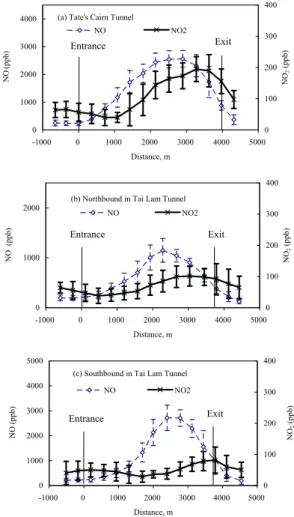
tanks are usually filled with high sulfur-content fuels and the southbound TLT is the preferred truck route. The use of high sulfur-content fuels will eventually poison three-way catalytic converters resulting in high NOx emissions. The average concentration profiles, with standard deviations, of NO and NO2in the tunnels are shown in Figs. 1a– c. The entrance of the tunnel is marked by 0 (zero) m.
15
Pollutant concentration profiles inside the tunnels are influenced by a combination of factors: sources, sinks, piston effect and mechanical ventilation. NO peak appeared at about two-thirds the length of the tunnel from the entrance, while lower NO concentra-tions occurred at the two ends as shown in Figs. 1a–c. It is reported that the peaks of NOx and the less reactive species CO and SO2occurred almost at the same location
20
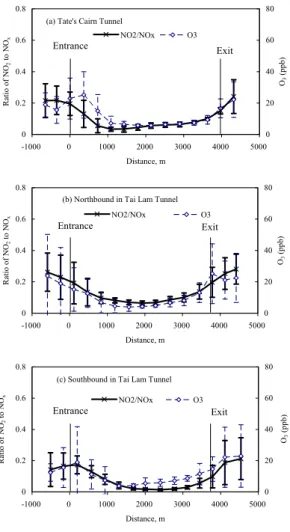
in TCT (Yao et al., 2005). NO2peak was detected at the exit section while the lowest value occurred at 500–1500 m from the entrance section. The lowest O3 occurred at 1000–2000 m from the entrance section and relatively high O3 was detected at both ends (entrainment effect) as shown in Figs. 2a–c.
The respective NO, NO2 and O3 concentration profiles in the tunnels were similar
25
only the concentrations varied. There are three sources of NO in the tunnels: ambient NO in front of the vehicle carried into the tunnels due to piston effect and relatively low background NO in fresh air brought into the tunnels due to mechanical ventilation,
ACPD
5, 12723–12740, 2005The ratio of NO2/NOx directly emitted from
vehicles X. Yao et al. Title Page Abstract Introduction Conclusions References Tables Figures J I J I Back Close
Full Screen / Esc
Print Version Interactive Discussion
EGU and primary NO emitted from vehicles. One of the NO sinks is the transformation of
NO to NO2 in the atmosphere. The highest NOx concentration was detected in the southbound tube of the TLT tunnel and it will be used in the discussion to follow. The maximum NO concentration (averaged value of five runs) was 2720 ppb and the aver-age for the entire tunnel was 1331 ppb. The maximum NO2 concentration (averaged
5
value of five runs) was only 82 ppb and the average for the entire tunnel was 52 ppb. NO concentration at the entrance was 214 ppb and was assumed to be the background NO outside of the tunnel. The high NO inside the tunnel indicates overwhelming con-tribution from fresh vehicle emissions.
There are four main NO2 sources in the tunnel: ambient NO2in front of the vehicle
10
carried into the tunnels due to piston effect and relatively low background NO2in fresh air brought into the tunnels due to mechanical ventilation, primary NO2 emitted from vehicles, and transformed NO2 from NO. NO2 concentration at the entrance of the southbound tube of TLT was 50 ppb. The lowest NO2 (28 ppb) occurred at ∼1500 m. The higher NO2at the entrance was likely ambient NO2carried into the tunnel by piston
15
effect. Furthermore, fresh air brought into the tunnel by mechanical ventilation would also contribute to the NO2concentration as well as diluting the emitted and transformed NO2 in the entrance section. For the rest of the tunnel, accumulation of emitted NO2 and transformed NO2 overcame the dilution processes and NO2 increased gradually to 82 ppb (an increase of 54 ppb).
20
In the 1500 to 2500 m section, both NOx and NO2 increased. From 2500 m to the exit section where end effect was experienced, NO2increased by 44 ppb while NOx de-creased by 1777 ppb. The concentration of the NO2originating from primary vehicular emissions in this section was expected to decrease with decreasing NOx. The 44 ppb increase in NO2in this section was probably due to transformed NO2. The wind speed
25
inside the tunnel was estimated to be ∼5 m s−1 based on ventilation data. It took the air ∼240 s to travel from the 2500 m point to the exit of the tunnel. It should be noted that the average air mass movement in tunnels is much lower than vehicular speed. The NO concentration decreased from 2720 to 1001 ppb in this distance. A rough
ACPD
5, 12723–12740, 2005The ratio of NO2/NOx directly emitted from
vehicles X. Yao et al. Title Page Abstract Introduction Conclusions References Tables Figures J I J I Back Close
Full Screen / Esc
Print Version Interactive Discussion
EGU culation showed that NO2produced by Reaction (1) was ∼6 ppb. The 44 ppb increase
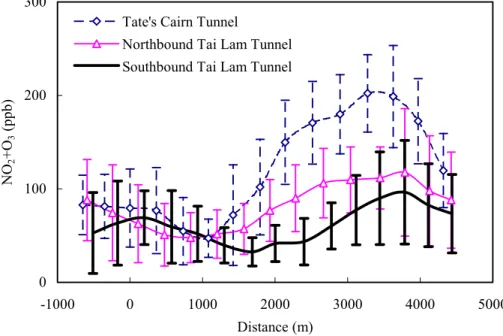
in NO2measured suggests that 86% of the NO2was not transformed by Reaction (1). As shown in Fig. 3, the increase of (NO2+O3) from ∼1500 m to the exit section of the tunnel by 63 ppb (to 96 ppb), suggests that the transformation reactions such as Reactions (3–4) were likely to be important.
5
3.2. The NO2/NOxratio profiles in the tunnels
Higher NO2/NOxvalues were found at both ends of both tunnels as shown in Figs. 2a– c. The lowest NO2/NOx ratios (2 to 6%) with NO concentrations at 1006–2128 ppb, occurred at ∼1000 m from the entrance of TCT and at ∼2000 m in both tubes of TLT. These lowest NO2/NOxratios should be closer to the primary vehicular NO2/NOxratios.
10
The apparent two-fold range in the lowest NO2/NOxratio was probably due to vehicular conditions and ambient concentrations of these gases.
In the literature, higher primary NO2/NOx ratios have been reported for diesel en-gines than gasoline enen-gines, and vehicles with higher NOx emissions (Hilliard and Wheeler, 1979; Lenner and Lindqvist, 1983; Cariappa et al., 1994; Soltic and
Weilen-15
mann, 2004).
The NOx concentration in the southbound tube of TLT doubled that in the north-bound tube. As presented in the Experimental Section, traffic composition, traffic flow and ventilation in both tubes of TLT are similar. The difference in NOx concentration between the two tubes was probably caused by low quality fuels used by the
cross-20
border vehicles in the southbound tube of TLT. The primary vehicular NO2/NOx ratio was expected to be higher in the southbound tube of TLT.
TLT has more diesel vehicles, lower traffic flow and better ventilation system than TCT. The southbound tube of TLT had higher NOx concentration than TCT, suggest-ing higher emission of this pollutant. Thus, the primary vehicular NO2/NOx ratio was
25
expected to be higher in the southbound tube of TLT than TCT. The lowest NO2/NOx ratio at 2% detected in the southbound TLT was the upper limit of the average on-road primary vehicular NO2/NOxratio in the two tunnels (four tubes) studied.
ACPD
5, 12723–12740, 2005The ratio of NO2/NOx directly emitted from
vehicles X. Yao et al. Title Page Abstract Introduction Conclusions References Tables Figures J I J I Back Close
Full Screen / Esc
Print Version Interactive Discussion
EGU Ventilated fresh air diluted all gases inside the tunnel and was probably responsible
for NO2concentrations to decrease from the entrance to the minima. In this distance in the tunnels, the NO2/NOxratio gradually decreased by 12–15%. It should be noted that the NO2/NOxratio in ventilated air was higher than that in the vehicle exhaust, therefore the intrusion of ventilated air would increase the NO2/NOxratio. Any oxidation of NO to
5
NO2by Reactions (2–4) would also increase this ratio. This ratio increased by 8–13% from where the lowest NO2was detected to the exit section.
3.3. The NO2/NOxon-road ratio
In the open air, it is reported that NOx concentration in vehicle plumes substantially decreased in a few minutes when vehicle plumes are diluted by ambient air (Seakins
10
et al., 2002). During dilution processes, rapid transformation of NO to NO2 can take place due to Reactions (2–4). Higher dilution extent of vehicle plumes by ambient air would yield a higher NO2/NOxratio. We further examine the NO2/NOxratio in on-road open air. The on-road NOxconcentrations are shown in Fig. 4a and the annual average was 251 ppb, indicating that the dilution extent of vehicle plumes by ambient air in open
15
air is better than in tunnels. As expected, the annual average NO2/NOx ratio was as high as 28% (Fig. 4b). Using the primary vehicular NO2/NOx ratio determined in the tunnels (2%), background and/or transformed NO2would account for 26% of the ratio in open air. In addition, there was no significant seasonal variation of the NO2/NOx ratio in the long-term on-road dataset as shown in Fig. 4b. The correlation between
20
NOxand the ratio is poor (R2=0.25).
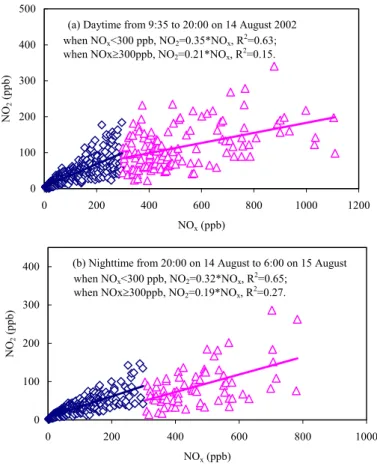
Twenty-four-hour experiments conducted on 14–15 August 2002 was used as an example to examine the contribution of different sources and processes to the on-road NO2/NOx ratios. As shown in Figs. 5a, b, fairly good correlations exist between NO2 and NOx when NOx was <300 ppb. The slopes are 0.35 and 0.32 in daytime
25
and nighttime, respectively. However, for NOx>300 ppb, correlations between NO2and NOxare poor with the corresponding slopes at 0.21 and 0.19. Compared to the primary vehicular NO2/NOx ratio of 2%, background NO2or transformed NO2 determined the
ACPD
5, 12723–12740, 2005The ratio of NO2/NOx directly emitted from
vehicles X. Yao et al. Title Page Abstract Introduction Conclusions References Tables Figures J I J I Back Close
Full Screen / Esc
Print Version Interactive Discussion
EGU on-road NO2/NOx ratio regardless of time.
A simple model was used to isolate the emitted and transformed NO2 from back-ground NO2. Assume that the measured NO2 in vehicle plumes consisted of back-ground NO2([NO2]BG), primary vehicle emitted NO2 ([NO2]P) and transformed NO2 ([NO2]T)
5
Define NOx<50 ppb to be background and NOx≥300 ppb to be vehicle plume. For NOx<50 ppb, the average NOx, NO2 and O3 concentrations were 24, 12 and 37 ppb, respectively, and for NOx≥300 ppb, they were 513, 115 and 6 ppb, respectively. In nighttime, the average NOx, NO2 and O3concentrations for NOx<50 ppb were 25, 13
and 10 ppb, respectively, while for NOx≥300 ppb, they were 463, 87 and 2 ppb.
10
The following was used to estimate [NO2]P+[NO2]T from MAP data:
[NO2]P + [NO2]T=[NO2]V P−[NO2]BG. (5)
where [NO2]V P is the NO2measured in vehicle plumes.
The amount of NO2([NO2]R2) produced by Reaction (2) alone (no VOC involved in O3formation) is:
15
[NO2]R2=[O3]BG−[O3]V P, (6)
where [O3]BG is O3concentration when NOx<50 ppb, and [O3]V P is O3 concentration in vehicle plumes. Substituted Reaction (6) into (5),
[NO2]P + [NO2]T−[NO2]R2=[NO2]V P−[NO2]BG−([O3]BG−[O3]V P), (7) Define:
20
Ratio1=([NO2]P + [NO2]T)/([NOx]V P−[NOx]BG), (8) Ratio2=([NO2]P + [NO2]T−[NO2]R2)/([NOx]V P−[NOx]BG). (9)
Ratio1 is the ratio of primarily emitted and transformed NO2 to primarily emitted NOx and they were 21% for daytime and 17% for nighttime. Ratio2 is the ratio of primarily
ACPD
5, 12723–12740, 2005The ratio of NO2/NOx directly emitted from
vehicles X. Yao et al. Title Page Abstract Introduction Conclusions References Tables Figures J I J I Back Close
Full Screen / Esc
Print Version Interactive Discussion
EGU emitted and transformed NO2 excluding Reaction (2) to primarily emitted NOx and it
was 15% for both day and night. Considered the primary vehicular NO2/NOx ratio of 2%, the transformed NO2excluding Reaction (2) contributed 13% to Ratio2, however, the contribution cannot be isolated from the primary vehicular contribution based on the data measured in the open air alone.
5
Overall, the data measured in the open air may not be applicable for estimating pri-mary vehicular NO2/NOxratios due to the existence of background and/or transformed NO2.
4. Summary
Intensive long-tunnel (3.7–4 km) air pollutant concentration profiles along the entire
10
lengths of tunnels in Hong Kong were used to estimate primary vehicular NO2/NOx ratios under depleted O3 conditions. The lowest NO2/NOx values were found in the middle of the tunnels at 2–6%. At the entrance sections of the tunnels, higher ambient NO2 concentrations caused the NO2/NOx ratios to be as high as 20%. In the exit sections of the tunnels, more O3 became available to rapidly oxidize NO to NO2 and
15
the NO2/NOx ratio was as high as 19%. These values, however, were still lower than the average annual NO2/NOxratio on roads in Hong Kong at 28%, where atmospheric transformation was expected to be much more significant. Ozone and free radicals are ubiquitous and they interfere with the measurement of NO directly emitted from vehicles. Long tunnels, shielded from ultraviolet irradiation and have a constant flow of
20
automobiles, provide an ideal and convenient laboratory for the assessment of primarily emitted vehicular NO2 as demonstrated in this paper. Mobile platform measurements provide concentration profiles necessary for such analysis.
Acknowledgements. The financial support by the Hong Kong Jockey Club Charities Trust in the Mobile Real-time Air Monitoring Platform project is gratefully acknowledged. We thank the MAP 25
team, K. L. To, W. Tsang, A. Tam and A. Choi, who are responsible for the real-time mobile air quality data used in this paper.
ACPD
5, 12723–12740, 2005The ratio of NO2/NOx directly emitted from
vehicles X. Yao et al. Title Page Abstract Introduction Conclusions References Tables Figures J I J I Back Close
Full Screen / Esc
Print Version Interactive Discussion
EGU References
Cariappa, C., Narney, J. K., Laster, W. R., and Caton, J. A.: Effect of carbon monoxide on nitric oxide in exhaust gases, Combust. Sci. Technol., 100, 355–361, 1994.
Carslaw, D. C. and Beevers, S. D.: New direction: should road vehicle emissions legislation
consider primary NO2?, Atmos. Environ., 38, 1233–1234, 2004a.
5
Carslaw, D. C. and Beevers, S. D.: Investigating the potential importance of primary NO2
emis-sions in a street canyon, Atmos. Environ., 38, 3585–3594, 2004b.
Carslaw, D. C. and Beevers, S. D.: Estimations of road vehicle primary NO2 exhaust using
monitoring data in London, Atmos. Environ., 39, 167–177, 2005.
Clapp, L. J. and Jenkin, M. E.: Analysis of the relationship between ambient levels of O3, NO2
10
and NO as a function of NOx in the UK, Atmos. Environ., 35, 6391–6450, 2001.
Finlayson-Pitts, B. J. and Pitts Jr., J. N.: Chemistry of the upper and lower atmosphere: theory, experiments and applications, Academic Press, San Diego, 2000.
Hard, T., Chan, C. Y., Mehrabzadeh, A. A., and O’Brien, R. J.: Diurnal HO2cycles at clean air
and urban sites in the troposphere, J. Geophys. Res., 97, 9785–9794, 1996. 15
Harrison, R. M. and Shi, J. P.: Sources of nitrogen dioxide in winter smog episodes, Sci. Total Environ., 189/190, 391–399, 1996.
Hilliard, J. C. and Wheeler, R. W.: Nitrogen dioxide in engine exhaust, SAE Transactions 88 (SAE 790691), 1979.
Jenkin, M. E.: Analysis of sources and partitioning of oxidant in the UK. Part 1: the NOx
-20
dependence of annual mean concentrations of nitrogen dioxide and ozone, Atmos. Environ., 38, 5117–5129, 2004a.
Jenkin, M. E.: Analysis of sources and partitioning of oxidant in the UK. Part 2: contributions of nitrogen dioxide emissions and background ozone at a kerbside location in London, Atmos. Environ., 38, 5131–5138, 2004b.
25
Jimenez, J. L., McCrae, G. J., Nelson, D. D., Zahniser, M. S., and Kolb, C. E.: Remote sensing
of NO and NO2emissions from heavy-duty diesel trucks using tunable diode lasers, Environ.
Sci. Tech., 34, 2380–2387, 2000.
Lenner, M. and Lindqvist, O.: The NO2/NOx ratio in emission from gasoline-power cars: high
NO2percentage in idle engine measurements, Atmos. Environ., 17, 1395–1398, 1983.
30
Seakins, P. W., Lansley, D. L., Hodgson, A., Huntley, N., and Pope, F.: Mobile laboratory reveals new issues in urban air quality, Atmos. Environ., 36, 1247–1248, 2002.
ACPD
5, 12723–12740, 2005The ratio of NO2/NOx directly emitted from
vehicles X. Yao et al. Title Page Abstract Introduction Conclusions References Tables Figures J I J I Back Close
Full Screen / Esc
Print Version Interactive Discussion
EGU
Seinfeld, J. H. and Pandis, S. N.: Atmospheric Chemistry and Physics from Air pollution to Climate Change, John Wiley & Sons, Inc, New York, 1998.
So, K. L. and Wang, T.: On the local and regional influence on ground-level ozone concentra-tions in Hong Kong, Environ. Pollut., 123, 307–317, 2003.
Soltic, P. and Weilenmann, M.: NO2/NO emissions of gasoline passenger cars and light-duty
5
trucks with Euro-2 emission standard, Atmos. Environ., 37, 5207–5216, 2003.
Turns, S. R.: An introduction to combustion-concepts and applications, McGraw-Hill Inc. New York, 1996.
Yao, X. H., Lau, N. T., Fang, M., and Chan, C. K.: Real-time observation of the transformation of ultrafine atmospheric particle modes, Aerosol Sci. Technol., 39, 831–841, 2005.
10
Yao, X. H., Lau, N. T., Fang, M., and Chan, C. K.: Use of stationary and mobile measurements to study power plant emissions, J. Air Waste Manag. Assoc., in press, 2005.
ACPD
5, 12723–12740, 2005The ratio of NO2/NOx directly emitted from
vehicles X. Yao et al. Title Page Abstract Introduction Conclusions References Tables Figures J I J I Back Close
Full Screen / Esc
Print Version Interactive Discussion
EGU Figure 1. Profiles of NO and NO2 in tunnels
(c) Southbound in Tai Lam Tunnel
0 1000 2000 3000 4000 5000 -1000 0 1000 2000 3000 4000 5000 Distance, m N O (ppb) 0 100 200 300 400 NO 2 (ppb) NO NO2
(b) Northbound in Tai Lam Tunnel
0 1000 2000 -1000 0 1000 2000 3000 4000 5000 Distance, m N O (ppb) 0 100 200 300 400 NO 2 (ppb) NO NO2
(a) Tate's Cairn Tunnel
0 1000 2000 3000 4000 -1000 0 1000 2000 3000 4000 5000 Distance, m NO (ppb) 0 100 200 300 400 NO 2 (ppb) NO NO2 Exit Entrance Exit Entrance Exit Entrance 14 Fig. 1. Profiles of NO and NO2in tunnels.
ACPD
5, 12723–12740, 2005The ratio of NO2/NOx directly emitted from
vehicles X. Yao et al. Title Page Abstract Introduction Conclusions References Tables Figures J I J I Back Close
Full Screen / Esc
Print Version Interactive Discussion
EGU Figure 2. Profiles of NO2/NOx and O3 in tunnels.
(c) Southbound in Tai Lam Tunnel
0 0.2 0.4 0.6 0.8 -1000 0 1000 2000 3000 4000 5000 Distance, m Ratio o f NO 2 to NO x 0 20 40 60 80 O3 (ppb) NO2/NOx O3 (b) Northbound in Tai Lam Tunnel
0 0.2 0.4 0.6 0.8 -1000 0 1000 2000 3000 4000 5000 Distance, m Ratio o f NO 2 to NO x 0 20 40 60 80 O3 (ppb) NO2/NOx O3
(a) Tate's Cairn Tunnel
0 0.2 0.4 0.6 0.8 -1000 0 1000 2000 3000 4000 5000 Distance, m Ratio o f NO 2 to NO x 0 20 40 60 80 O3 (ppb) NO2/NOx O3 Exit Entrance Entrance Exit Exit Entrance 15 Fig. 2. Profiles of NO2/NOxand O3in tunnels.
ACPD
5, 12723–12740, 2005The ratio of NO2/NOx directly emitted from
vehicles X. Yao et al. Title Page Abstract Introduction Conclusions References Tables Figures J I J I Back Close
Full Screen / Esc
Print Version Interactive Discussion
EGU
Figure 3. (NO2+O3) profiles in tunnels.
0 100 200 300 -1000 0 1000 2000 3000 4000 5000 Distance (m) NO 2 +O 3 (ppb)
Tate's Cairn Tunnel
Northbound Tai Lam Tunnel Southbound Tai Lam Tunnel
16 Fig. 3. (NO2+O3) profiles in tunnels.
ACPD
5, 12723–12740, 2005The ratio of NO2/NOx directly emitted from
vehicles X. Yao et al. Title Page Abstract Introduction Conclusions References Tables Figures J I J I Back Close
Full Screen / Esc
Print Version Interactive Discussion
EGU
Figure 4. Seasonal variations of NO2/NOx and NOx in on-road vehicle plumes.
(b) Ratio of NO2 to NOx 0 0.2 0.4 0.6 Ju n-02 Jul-02Aug-02Sep-0 2 Oct-0 2 Nov -02 Dec-0 2 Ja n-03 Fe b-03 M ar-03 Apr-03Ma y-03 Ju n-03 Jul-03Aug-0 3 Month Ratio o f NO 2 to NO x (a) NOx 0 150 300 450 600 Ju n-02 Jul-02Aug-02 Sep-02 Oct-0 2 Nov -02 Dec-0 2 Jan-03Feb-0 3 M ar-03 Apr-03Ma y-03 Jun-0 3 Jul-0 3 Aug -03 Month NO x (ppb) Average 0.28 Average 251 ppb 17
Fig. 4. Seasonal variations of NO2/NOx and NOxin on-road vehicle plumes.
ACPD
5, 12723–12740, 2005The ratio of NO2/NOx directly emitted from
vehicles X. Yao et al. Title Page Abstract Introduction Conclusions References Tables Figures J I J I Back Close
Full Screen / Esc
Print Version Interactive Discussion
EGU
Figure 5. Correlations between NO2 and NOx in daytime and nighttime measurements.
(a) Daytime from 9:35 to 20:00 on 14 August 2002
0 100 200 300 400 500 0 200 400 600 800 1000 1200 NOx (ppb) NO 2 (ppb)
(b) Nighttime from 20:00 on 14 August to 6:00 on 15 August
0 100 200 300 400 0 200 400 600 800 1000 NOx (ppb) NO 2 (ppb) when NOx<300 ppb, NO2=0.32*NOx, R2=0.65; when NOx≥300ppb, NO2=0.19*NOx, R2=0.27. when NOx<300 ppb, NO2=0.35*NOx, R2=0.63; when NOx≥300ppb, NO2=0.21*NOx, R2=0.15.
Fig. 5. Correlations between NO2and NOxin daytime and nighttime measurements.