HAL Id: hal-01465920
https://hal.archives-ouvertes.fr/hal-01465920v2
Submitted on 12 Oct 2017
HAL is a multi-disciplinary open access
archive for the deposit and dissemination of
sci-entific research documents, whether they are
pub-lished or not. The documents may come from
teaching and research institutions in France or
abroad, or from public or private research centers.
L’archive ouverte pluridisciplinaire HAL, est
destinée au dépôt et à la diffusion de documents
scientifiques de niveau recherche, publiés ou non,
émanant des établissements d’enseignement et de
recherche français ou étrangers, des laboratoires
publics ou privés.
Distributed under a Creative Commons Attribution - NonCommercial| 4.0 International
License
Early changes in body weight and blood pressure are
associated with mortality in incident dialysis patients
Flore Duranton, Yohan Duny, Ilan Szwarc, Sébastien Deleuze, Catherine
Rouanet, Isabelle Selcer, François Maurice, Jean-Pierre Rivory,
Marie-Françoise Servel, Bernard Jover, et al.
To cite this version:
Flore Duranton, Yohan Duny, Ilan Szwarc, Sébastien Deleuze, Catherine Rouanet, et al.. Early
changes in body weight and blood pressure are associated with mortality in incident dialysis patients.
Clinical Kidney Journal, Oxford University Press, 2016, 9 (2), pp.287 - 294. �10.1093/ckj/sfv153�.
�hal-01465920v2�
O R I G I N A L A R T I C L E
Early changes in body weight and blood pressure are
associated with mortality in incident dialysis patients
Flore Duranton
1
, Yohan Duny
2
, Ilan Szwarc
3
, Sébastien Deleuze
4
,
Catherine Rouanet
4
, Isabelle Selcer
4
, François Maurice
4
, Jean-Pierre Rivory
4
,
Marie-Françoise Servel
3
, Bernard Jover
5
, Philippe Brunet
6
, Jean-Pierre Daurès
2
,
and Àngel Argilés
1,3
1
RD
– Néphrologie/EA7288, Université Montpellier, Montpellier, France,
2EA2415, Institut Universitaire de
Recherche Clinique, Université Montpellier, Montpellier, France,
3Néphrologie Dialyse Saint Guilhem, Sète,
France,
4NephroCare, Castelnau-le-Lez, France,
5EA7288, UFR Pharmacie, Université Montpellier, Montpellier,
France, and
6Service de Néphrologie, CHU de La Conception, Université Aix
– Marseille, Marseille, France
Correspondence to: Àngel Argilés; E-mail: argiles@rd-n.orgAbstract
Background: While much research is devoted to identifying novel biomarkers, addressing the prognostic value of routinely measured clinical parameters is of great interest. We studied early blood pressure (BP) and body weight (BW) trajectories in incident haemodialysis patients and their association with all-cause mortality.
Methods: In a cohort of 357 incident patients, we obtained all records of BP and BW during thefirst 90 days on dialysis (over 12 800 observations) and analysed trajectories using penalized B-splines and mixed linear regression models. Baseline comorbidities and all-cause mortality (median follow-up: 2.2 years) were obtained from the French Renal Epidemiology and Information Network (REIN) registry, and the association with mortality was assessed by Cox models adjusting for baseline comorbidities. Results: During the initial 90 days on dialysis, there were non-linear decreases in BP and BW, with milder slopes after 15 days [systolic BP (SBP)] or 30 days [diastolic BP (DBP) and BW]. SBP or DBP levels at dialysis initiation and changes in BW occurring in thefirst month or during the following 2 months were significantly associated with survival. In multivariate models adjusting for baseline comorbidities and prescriptions, higher SBP value and BW slopes were independently associated with a lower risk of mortality. Hazard ratios of mortality and 95% confidence intervals were 0.92 (0.85–0.99) for a 10 mmHg higher SBP and 0.76 (0.66–0.88) for a 1 kg/month higher BW change on Days 30–90.
Conclusions: BW loss in thefirst weeks on dialysis is a strong and independent predictor of mortality. Low BP is also associated with mortality and is probably the consequence of underlying cardiovascular diseases. These early markers appear to be valuable prognostic factors.
Key words: blood pressure, body weight, haemodialysis, incident, mortality
Received: September 17, 2015. Accepted: December 18, 2015
© The Author 2016. Published by Oxford University Press on behalf of ERA-EDTA.
This is an Open Access article distributed under the terms of the Creative Commons Attribution Non-Commercial License (http://creativecommons.org/ licenses/by-nc/4.0/), which permits non-commercial re-use, distribution, and reproduction in any medium, provided the original work is properly cited. For commercial re-use, please contact journals.permissions@oup.com
Clinical Kidney Journal, 2016, 1–8
doi: 10.1093/ckj/sfv153 Original Article 1
C
LIN
IC
A
L
K
IDNE
Y
J
OURNA
at Bibliothèque Universitaire de médecine - Nîmes on February 3, 2016
http://ckj.oxfordjournals.org/
Introduction
Patients who are treated chronic dialysis have a very high risk of mortality, reaching 50% after 5 years on dialysis [1,2]. Cardiovas-cular diseases are a major concern since they are responsible for up to 40% of deaths in this population [1,2]. Elevated blood pres-sure (BP) and being overweight are known cardiovascular risk fac-tors in the general population, but their effect in haemodialysis patients seems to be more ambiguous [3]. An apparent U-shaped association between BP and mortality and a reversed association between body weight (BW) and mortality have been observed in prevalent haemodialysis patients [4,5]. Despite scarce evidence, these results have been reproduced in patients incident to dialy-sis [6,7]. Incident patients face important changes at the moment of dialysis initiation. Removal of excess water, gain in appetite, recovery of heart function and improved haemodynamic status are likely to affect BP or BW as well as survival [5,8]. In this con-text, knowing not only the baseline level of a given biomarker but also how it changes over time could be of very great interest [9,
10]. However, the early changes in BW and BP following dialysis initiation and their association with survival have not been clear-ly described.
In the present study, we described the longitudinal changes in BP and BW occurring within the 3 months following dialysis ini-tiation. We tested their association with survival observed after up to 8 years of follow-up. We found that low BP and declining BW did relate to mortality. With this approach, we showed that early clinical parameters can be of value to assess prognosis in incident dialysis patients.
Materials and methods
Patients
The study cohort consisted of adult patients who were incident to dialysis between 1 January 2004 and 31 December 2010, who were followed up until 31 December 2011 (maximum 8 years). To be in-cluded, patients had to be dialysed in one of the participating institutions (Néphrologie Dialyse Saint Guilhem, Sète, France; NephroCare, Castelnau-Le-Lez, France) in thefirst 31 days on dia-lysis and to survive thefirst 90 days on dialysis. Additional inclu-sion criteria were the presence of at least three observations of weight and BP records in thefirst 90 days on dialysis. From the initial 421 patients, thefinal cohort consisted of 357 patients of which 322 had been seen in thefirst 15 days on dialysis (Supple-mentary data, Figure S1). This historic cohort study was approved by the‘Commission nationale de l’informatique et des libertés’ (CNIL no. EGY/FLR/AR129203) and the‘Comité consultatif sur le traitement de l’information en matière de recherche’ (CCTIRS no. 12.572).
Data collection and description
Before every dialysis session, systolic and diastolic blood pres-sure (SBP and DBP) were meapres-sured in a lying position by auto-matic sphygmomanometers, and BW was measured using controlled scales. For each session, dialysis data ( prescribed bloodflow, dialysate flow, infusion rate and dialyser) and clinic-al data (SBP, DBP and BW) were longitudinclinic-ally recorded in the electronic medical records Hemadialyse (Hemasystem, Aix En Provence, France), Clinidial (SyComCare, Mauguio, France) or EuCliD (Fresenius Medical Care, Bad Homburg, Germany). SBP, DBP and BW recorded during thefirst 90 days on dialysis were
extracted and apparent outliers were discarded (<2% of observa-tions). Pre-dialysis levels of serum albumin and C reactive pro-tein (CRP) were routinely determined by hospital laboratories and recorded in electronic medical records. Individual mean al-bumin level and median CRP level for thefirst 3 months on dia-lysis were considered as exposure. Electronically recorded drug prescriptions were analysed to identify patients who started antihypertensive therapies before or during thefirst 3 months on dialysis. The list of antihypertensive drugs was obtained from the Vidal database [11], and is summarized in Supplemen-tary data, Table S1. Comorbidities at baseline were obtained from the Renal Epidemiology and Information Network (REIN) registry in which all patients surviving 90 days on chronic dialy-sis are included [12]. The dates of censoring events (renal trans-plantation, transfer out of the region, peritoneal dialysis and renal recovery) and outcome (death and dialysis refusal) occur-ring duoccur-ring follow-up were obtained from the REIN registry. When dialysis was stopped due to dialysis refusal, date of death was obtained by other sources or was considered to have occurred 14 days later.
Modelfitting and statistical analyses
The change of BP and BW over time was graphically described using penalized B-splines of the third degree allowing 8 knots located every 10 days, from Day 10 to 80. Secondly, mixed-effects linear models were used to describe the effect of time and to model individual changes [13]. Time and intercept were included in the model as bothfixed and random effects. The effect of time was allowed to change after some days by adding a delayed time effect, as both a random and afixed effect. To account for autocorrelation related to the longitudinal design, the error matrix was defined as autoregressive of the first order. The ap-proach is analogous to modelling patient-specific linear regres-sions with a possible change of slope. BW was normalized by square root transformation and the presented results are back-transformed [14].
The association of BP and BW intercepts and slopes with survival was assessed using Cox proportional hazard models adjusting for age, gender and study centre, as well as vascular access, emergency start, diabetes, active malignancy, chronic respiratory disease, coronary disease, cerebrovascular disease, myocardial infarction and the use of antihypertensive therapies (Model 1), and with the further addition of hypertension, periph-eral vascular disease, dysrhythmia and congestive heart failure (Model 2). Proportionality was assessed by analysis of Schoen-feld and deviance residues and by including variable × time pro-ducts in the model. We estimated the association between SBP, BW and mortality within each subgroup independently and then tested the presence of an interaction across subgroups. In the sensitivity analysis, we reproduced analyses with relative BW change ( per cent change from BW intercept or estimate at Day 30) because the extent of BW changes is likely to be asso-ciated with initial BW. We also reproduced analyses with body mass index [BMI (kg/m2) = BW/height2] in patients in whom
height was recorded.
Data were summarized as mean and standard error of the mean and median and interquartile range (IQR). Comparisons between groups were performed by two-sample test, paired t-test or Wilcoxon rank-sum t-test according to data distribution. All P-values are two sided and a value of P < 0.05 was considered significant. Statistical analyses were performed using SAS v.9.3 (SAS Institute, Cary, NC).
2 | F. Duranton et al.
C
LIN
IC
A
L
K
IDNE
Y
J
OURNA
L
at Bibliothèque Universitaire de médecine - Nîmes on February 3, 2016
http://ckj.oxfordjournals.org/
Results
Included population
There were 357 patients who met all the inclusion criteria (Supplementary data, Figure S1). Their baseline characteristics are given in Table1. Patients were relatively old and were more frequently males (around two-thirds of the study population) than females. The most frequent initial renal disease was glom-erulonephritis. Comorbidities such as hypertension and diabetes were very frequent. Cerebrovascular disease, myocardial infarc-tions and active malignancies were present in∼10% of patients. Thefirst dialysis was performed in an emergency in 30% of patients and catheter was the initial vascular access in 37% of patients. Most patients (96%) were treated with haemodialysis and 4% with haemodiafiltration. Over the first 3 months, most patients (92%) received three to four weekly dialysis sessions. Sessions lasted a median of 4 h (IQR: 3.0–4.0 h). Blood flow was set between 180 and 400 mL/min [median and IQR: 300 (250– 300) mL/min]. Dialysis was performed with highflux (56%) or lowflux dialysers (44%).
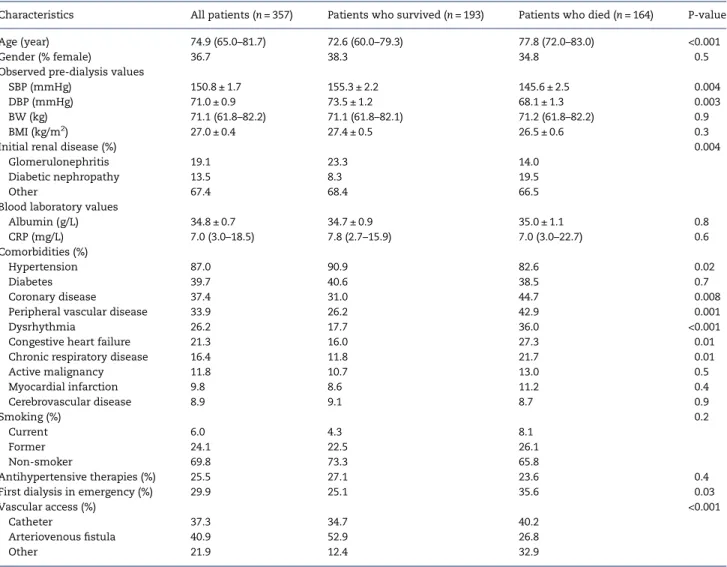
The median follow-up was 2.2 years (IQR: 1.3–3.8 years), at which time the survival rate was 68%. At the end of the observa-tion period, 164 (46%) patients had presented the outcome (158 deaths and 6 dialysis cessations). For other patients, censoring was due to study ending (n = 158), renal transplantation (n = 25), switch to peritoneal dialysis (n = 1), renal function recovery (n = 6) and loss to follow-up (n = 3). Patients who presented the outcome were more likely to have coronary insufficiency, congestive heart failure and peripheral vascular disease (Table1). In contrast, they were less frequently diagnosed with hypertension and had lower BP (P < 0.01) and similar BW (Table1).
Changes in BP and BW
We studied BP and BW levels during thefirst 90 days on dialysis. For SBP, DBP or BW, the mean number of observations per patient was 36 [median and IQR: 38 (34–40)], leading to a total number of observations exceeding 12 800. Overall, 95% of patients had 22 or more observations of SBP, DBP and BW; only two patients had four or fewer observations. Graphical analysis showed that
Table 1. Baseline characteristics of patients depending on survival
Characteristics All patients (n = 357) Patients who survived (n = 193) Patients who died (n = 164) P-value
Age (year) 74.9 (65.0–81.7) 72.6 (60.0–79.3) 77.8 (72.0–83.0) <0.001
Gender (% female) 36.7 38.3 34.8 0.5
Observed pre-dialysis values
SBP (mmHg) 150.8 ± 1.7 155.3 ± 2.2 145.6 ± 2.5 0.004
DBP (mmHg) 71.0 ± 0.9 73.5 ± 1.2 68.1 ± 1.3 0.003
BW (kg) 71.1 (61.8–82.2) 71.1 (61.8–82.1) 71.2 (61.8–82.2) 0.9
BMI (kg/m2) 27.0 ± 0.4 27.4 ± 0.5 26.5 ± 0.6 0.3
Initial renal disease (%) 0.004
Glomerulonephritis 19.1 23.3 14.0
Diabetic nephropathy 13.5 8.3 19.5
Other 67.4 68.4 66.5
Blood laboratory values
Albumin (g/L) 34.8 ± 0.7 34.7 ± 0.9 35.0 ± 1.1 0.8 CRP (mg/L) 7.0 (3.0–18.5) 7.8 (2.7–15.9) 7.0 (3.0–22.7) 0.6 Comorbidities (%) Hypertension 87.0 90.9 82.6 0.02 Diabetes 39.7 40.6 38.5 0.7 Coronary disease 37.4 31.0 44.7 0.008
Peripheral vascular disease 33.9 26.2 42.9 0.001
Dysrhythmia 26.2 17.7 36.0 <0.001
Congestive heart failure 21.3 16.0 27.3 0.01
Chronic respiratory disease 16.4 11.8 21.7 0.01
Active malignancy 11.8 10.7 13.0 0.5 Myocardial infarction 9.8 8.6 11.2 0.4 Cerebrovascular disease 8.9 9.1 8.7 0.9 Smoking (%) 0.2 Current 6.0 4.3 8.1 Former 24.1 22.5 26.1 Non-smoker 69.8 73.3 65.8 Antihypertensive therapies (%) 25.5 27.1 23.6 0.4
First dialysis in emergency (%) 29.9 25.1 35.6 0.03
Vascular access (%) <0.001
Catheter 37.3 34.7 40.2
Arteriovenousfistula 40.9 52.9 26.8
Other 21.9 12.4 32.9
Mean ± standard error of the mean (SEM) or median (IQR). P-values are for the comparison between patients who survived and patients who died.
Thefirst observations available within the first week on dialysis were considered baseline values. The sample size was 294 for SBP, DBP and BW, 90 for albumin and 63 for CRP. Prescription of antihypertensive therapies within thefirst 3 months was considered.
CRP, C reactive protein.
C
LIN
IC
A
L
K
IDNE
Y
J
OURNA
at Bibliothèque Universitaire de médecine - Nîmes on February 3, 2016
http://ckj.oxfordjournals.org/
mean SBP, DBP and BW decreased over thefirst 3 months, with a steeper initial phase (Figure1). BW was globally stabilized after thefirst month. Results from mixed modelling were consistent with observations (Table2).
The level of BW was influenced by having diabetes (7.1 ± 1.8 kg, P < 0.001), chronic respiratory disease (5.5 ± 2.4 kg, P = 0.02) or hypertension (5.7 ± 2.6 kg, P = 0.03), receiving antihypertensive therapies (−4.3 ± 1.9 kg, P = 0.03) and by albumin levels (0.4 ± 0.2 kg for each 1 g/L, P = 0.02). BP was lower in patients with dys-rhythmia (SBP,−7.0 ± 3.3 mmHg, P = 0.03; DBP, −6.1 ± 1.6 mmHg, P < 0.001) or congestive heart failure (SBP,−15.2 ± 3.5 mmHg; DBP,−8.2 ± 1.7 mmHg; both P < 0.001). The level of SBP was high-er in diabetic patients (9.1 ± 3.0 mmHg, P = 0.002) and lowhigh-er in those starting dialysis in an emergency (−9.9 ± 3.2 mmHg, P =
0.002). The level of DBP was lower in patients with coronary dis-ease (−5.4 ± 1.4 mmHg, P = 0.002), chronic respiratory disdis-ease (−4.3 ± 1.9 mmHg, P = 0.02) and peripheral vascular disease (−3.6 ± 1.5 mmHg, P = 0.02).
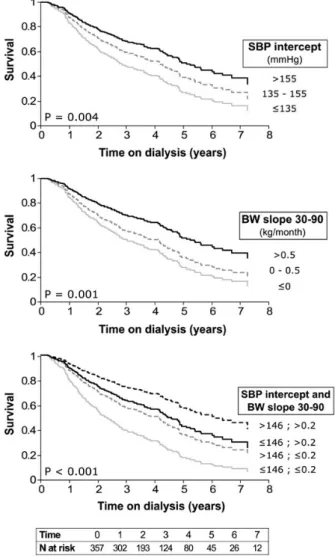
Association of BP and BW with mortality
The Kaplan–Meier survival curves for patients grouped by SBP and BW slope are presented in Figure2. Patients with higher SBP intercepts had a significantly lower risk of mortality (Figure2). The risk of mortality was also affected by BW slopes: patients with weight reduction were at higher risk of mortality, while patients with increasing BW were at lower risk (Figure2). Having both a high SBP value and a BW increase was associated with the best survival rate (Figure2). For a comparable amount of change of 1 SD, effect sizes were similar for SBP and DBP intercept on the one hand, and for the two BW slopes on the other (Supple-mentary data, Table S2). Compared with BP intercepts, the effects of BW slopes on survival were of greater magnitude.
Survival analyses accounting for the effect of age, gender and other baseline characteristics showed that having a 10 mmHg higher SBP reduced the risk of mortality by 8% (P = 0.04, Table3, Model 1) and having a 1 kg/month higher BW slope (less negative or more positive) reduced the risk of mortality by 24% (P < 0.001, Table3, Model 1). Active malignancy, chronic respiratory disease and the use of catheter as vascular access were associated with an increased risk of mortality, respectively, of 1.75-, 1.9- and 2.6-fold (P≤ 0.02, Table3, Model 1).
Using the same adjustment model, the association of SBP value and BW change with mortality was estimated by Cox pro-portional hazard models in different subgroups and the presence of interactions was tested (Figure3). The only significant inter-action was that of SBP intercept with gender with regards to mor-tality: high SBP is significantly associated with survival in males, but not in females.
With the inclusion of additional cardiovascular comorbidities as covariates (Table3, Model 2), BW changes remained signifi-cantly associated with survival (22% risk reduction for 1 kg/ month higher BW slopes) while the effect of baseline SBP was no longer significant. In this model, peripheral vascular disease and dysrhythmia were both found to be significantly associated with increased risk of mortality, which almost doubled. These results suggest that decreasing BW is predictive of adverse
Fig. 1. General trajectory of SBP, DBP and BW over thefirst 3 months on dialysis. Regression lines and 95% confidence intervals were obtained with penalized B-splines, using data from all patients together.
Table 2. Parameters describing the trajectories of SBP, DBP and BW over thefirst 3 months on dialysis
Mixed linear model parameters Mean ± SEM Median (IQR) SBP before dialysis Intercept (mmHg) 148.5 ± 1.1 147.8 (136.3; 161.6) Slope 0–15 (mmHg/month) −12.0 ± 1.3 −10.5 (−22.8; −1.0) Slope 15–90 (mmHg/month) −1.2 ± 0.4 −0.7 (−5.5; 3.0) DBP before dialysis Intercept (mmHg) 69.4 ± 0.6 68.5 (61.1; 77.3) Slope 0–30 (mmHg/month) −1.5 ± 0.3 −1.2 (−4.8; 2.4) Slope 30–90 (mmHg/month) −0.7 ± 0.2 −0.6 (−2.5; 1.1) BW before dialysis Intercept (kg) 70.5 ± 0.9 70.1 (60.7; 79.6) Slope 0–30 (kg/month) −1.4 ± 0.2 −0.8 (−2.8; 0.4) Slope 30–90 (kg/month) 0.07 ± 0.05 0.1 (−0.3; 0.6)
All means and medians are significantly different from 0 with the exception of mean BW slope 30–90. 4 | F. Duranton et al.
C
LIN
IC
A
L
K
IDNE
Y
J
OURNA
L
at Bibliothèque Universitaire de médecine - Nîmes on February 3, 2016
http://ckj.oxfordjournals.org/
outcome, the risk of which is further increased in the case of low BP, heart failure or arteritis.
Sensitivity analyses
The addition of blood albumin and CRP levels in the adjustment models drastically limited the population size (89 patients, Sup-plementary data, Table S3). The effects of SBP intercept and BW change were no longer significant, while chronic respiratory dis-ease and dysrhythmia were confirmed as important risk factors. Survival analyses were reproduced when including any pairing of BP intercept and BW slope in the two multivariate models (Sup-plementary data, Table S4.A). In all cases, initial BP was signifi-cantly associated with outcome in thefirst adjustment model, while BW slopes were strongly associated with better survival in all models (P < 0.001). The results were very similar when BW was analysed as per cent change from baseline (Supplementary data, Table S4.B). We analysed the trajectory of BMI in a subcohort of 241 patients with recorded height. In most models, both higher baseline BP and BMI change were associated with survival, even with the fully adjusted model (Supplementary data, Table S4.C). Finally, we tested the association between mortality and the level of SBP, DBP and BW estimated on Days 15, 30 and 90 and found that as time passes, the link between BP level and mortality weakens (Supplementary data, Table S5).
Discussion
BP and BW are clinical parameters of primary importance in renal patients. As chronic kidney disease (CKD) progresses and glomerularfiltration rate decreases, sodium balance becomes positive and extracellular volume overload generally appears. This process induces weight gain and almost necessarily a rise in BP. The initiation of dialysis rapidly corrects this situation: BW and BP are significantly reduced in only a few weeks, as shown using penalized B-splines (Figure1), which estimate BP and BW levels at each time point based on all observations, with no assertion on the global shape of trajectories [15]. Follow-ing the initial decrease, BP continues to decrease over thefirst 3 months on dialysis, while BW starts to slightly increase. The
Fig. 2. Kaplan–Meier survival curves by subgroups. Survival rates were estimated for subgroups of estimated baseline SBP (SBP intercept) and BW change on Days 30–90 (BW slope 30–90) with no adjustment for comorbidities. P-value for the log-rank test is displayed.
Table 3. Hazard ratios of mortality from multivariate Cox models
Covariates
Model 1 Model 2
HR (95% CI) P-value HR (95% CI) P-value
SBP intercept (for each 10 mmHg increase) 0.92 (0.85; 0.99) 0.04 0.95 (0.88; 1.03) 0.2
BW slope 30–90 (for each 1 kg/month increase) 0.76 (0.66; 0.88) <0.001 0.78 (0.67; 0.91) <0.001
Antihypertensive therapies (yes) 0.96 (0.45; 2.07) 0.9 0.87 (0.40; 1.89) 0.7
Emergency start (yes) 1.01 (0.68; 1.49) 0.9 0.86 (0.58; 1.29) 0.5
Fistula (versus catheter) 0.38 (0.24; 0.59) <0.001 0.35 (0.22; 0.55) <0.001
Diabetes (yes) 0.93 (0.65; 1.33) 0.7 0.90 (0.62; 1.30) 0.6
Active malignancy (yes) 1.75 (1.08; 2.85) 0.02 1.88 (1.16; 3.06) 0.01
Chronic respiratory disease (yes) 1.92 (1.27; 2.90) 0.002 1.77 (1.16; 2.71) 0.01
Coronary disease (yes) 1.32 (0.93; 1.89) 0.1 1.12 (0.77; 1.63) 0.6
Cerebrovascular disease (yes) 1.23 (0.69; 2.18) 0.5 1.02 (0.57; 1.82) 0.9
Myocardial infarction (yes) 0.83 (0.48; 1.43) 0.5 0.78 (0.44; 1.38) 0.4
Peripheral vascular disease (yes) – – 1.76 (1.23; 2.51) 0.002
Dysrhythmia (yes) – – 1.95 (1.34; 2.84) <0.001
Hypertension (yes) – – 0.70 (0.45; 1.09) 0.1
Congestive heart failure (yes) – – 1.00 (0.65; 1.53) 0.9
Models 1 and 2 adjusting for age, gender and study centre. Sample size n = 339. CI, confidence interval; HR, hazard ratio.
C
LIN
IC
A
L
K
IDNE
Y
J
OURNA
at Bibliothèque Universitaire de médecine - Nîmes on February 3, 2016
http://ckj.oxfordjournals.org/
BW trajectory is likely due to removal of excess water, which in turn has a BP lowering action. The persistence of BP decrease could be attributed to other dialysis effects such as removal of uraemic toxins. Observations lasting up to 1 year after dialysis initiation confirmed that BW slightly increased, which could be related to improved nutrition, while reported BP changes were inconsistent [16–19].
Dialysis helps to restore the altered cardiovascular state of CKD patients, notably by removing extracellular volume excess. However, not all patients display a beneficial haemodynamic sponse to the treatment. We hypothesized that individual re-sponses to therapy were associated with long-term prognosis and found that higher BP level and change in BW (less BW reduc-tion or higher BW increase) were associated with survival, adjust-ing for other comorbidities. The protective effect of lower BP was
consistent in patients without concomitant diseases and less clear in those with other diseases. Interestingly, the effect seemed reversed, although non-significant, in those with SBP ex-ceeding 157 mmHg, supporting a U-shaped association between BP and mortality. This association has been described previously [4,20,21], and it was criticized as being biased towards early deaths [22]. We found similar results when avoiding survival bias and early deaths by selecting incident patients surviving thefirst 3 months of dialysis. Interestingly, the link between BP level and mortality was clear in thefirst weeks on dialysis only, which suggests that once elevated BP has been corrected by dia-lysis, it may not be as powerful for predicting survival. We did not find a link between BP changes and mortality, although larger studies have reported that increasing or stable BP was associated with better survival [7,16,23].
Fig. 3. Effect on mortality of SBP and BW slope stratified by subgroup. Hazard ratio (HR) of mortality for a 10 mmHg higher SBP (left panel) and a 1 kg/month higher BW slope (right panel) estimated within each subgroup using the adjustment Model 1 (age, gender, venous access, emergency start, diabetes, active malignancy, chronic respiratory disease, coronary disease, cerebrovascular disease and myocardial infarction). Arrows represent confidence intervals (CI) larger than depicted on the graph. P-values for interactions are displayed.
6 | F. Duranton et al.
C
LIN
IC
A
L
K
IDNE
Y
J
OURNA
L
at Bibliothèque Universitaire de médecine - Nîmes on February 3, 2016
http://ckj.oxfordjournals.org/
Our study showed that a decrease in BW occurring in thefirst months on dialysis was associated with mortality. We report that the association was consistent across subgroups, including pa-tients starting dialysis in an emergency, therefore expanding pre-vious knowledge [17]. Reproducing analyses with relative BW change and change in BMI, we observed the same protective ef-fects of increasing BW. Different studies in prevalent patients have shown that declining BMI was associated with increased mortality [5,24,25]. In patients incident to dialysis, a marked BW loss in the weeks before dialysis initiation or during the first year on dialysis was also associated with mortality [17,26]. In general, BW loss is the result of decreased food intake (anorexia, malnutrition and depression) and/or increased energetic expend-iture (protein-energy wasting, inflammation and catabolic stress). In dialysis patients, additional factors exist, most importantly re-moval of excess water and catabolic stress induced by dialysis pro-cedures. Interestingly, a study on muscle and fat mass indicators showed that lower values of either compartment were associated with increased mortality [27]. However, a recent study showed that the protective effect of BMI on survival almost exclusively occurred in patients with inflammation [28]. These two results to-gether suggest that patients at high risk of wasting are those who would benefit the most from dietary interventions. Further studies should be performed to address specifically this question.
We found that different comorbid diseases significantly influenced mortality, which shows that the cohort was well adapted to the aims of the study. In particular, the risk of death was almost doubled in patients starting dialysis with dysrhyth-mia, active malignancy or peripheral vascular disease. In a study based on the REIN registry, these pathologies, as well as diabetes and low BMI, have been reported to predict 6-month mortality in elderly patients starting on dialysis [29]. In our study, chronic respiratory disease was also found to be associated with outcome. We further studied the influence of emergency dialysis start and of dialysis access, assessed generally at 3 months, to evaluate the influence of the dialysis initiation con-text on mortality. We found that patients being dialysed on cath-eter were at higher risk of all-cause mortality, confirming the importance of preparing for the terminal state with the creation of an arteriovenousfistula [30,31]. In France, while almost 80% of patients are dialysed on arteriovenousfistula, more than half of patients started dialysis on catheter [1]. Furthermore, there has been an increase in catheter use over the past years that was ob-served in France as well as in other European countries [1,32].
We used linear mixed models to estimate individual and population longitudinal changes, since this approach has the advantage of allowing simultaneously modelling of intra- and interindividual change over time [33]. Linear mixed models ac-count for correlations between repeated measures from the same patient and they can handle between-patient differences in time intervals and in number of observations. These models provide summary measures of change (intercepts and slopes) for each patient, which were associated with mortality in a se-cond step, using the appropriate time-to-event approaches, simi-lar to the recently reported analysis of intradialytic BP changes [34]. Although indirect, this approach prevents the loss of infor-mation that would occur if we simply modelled different trends of change for patients who presented the outcome or not.
Still, our study has some limitations, the major one being that it is observational, and therefore, we can neither exclude the pres-ence of unmeasured confounding factors, conclude on any causal relationship nor confirm the efficacy of possible interventions. Fur-thermore, the‘sample size’ did not allow us to see the link between baseline BMI and mortality, which has been well established in
larger studies [6,25]. We studied BP measured before dialysis and pre-dialysis weight, with no additional information on body com-position. Although it would have been very interesting to have pre-cise information the level of muscle mass, fat mass andfluid retention, and to have a more representative measure of the BP burden such as ambulatory BP, the variables that we analysed are available to most clinicians, and our results are applicable to everyday practice. We were interested in the period directly follow-ing dialysis initiation and arbitrarily chose to limit our analysis to a 3-month period. This choice is arguable but was made to maintain a balance between sufficient time to observe a change and the number of patients at risk at the end of this observation period.
In conclusion, in a time when much research is devoted to identifying biomarkers for non-invasive diagnosis or to precisely evaluating prognosis, the identification of the prognostic value of clinical parameters that are routinely measured and recorded is of great interest. We found that studying the changes of clinical parameters over thefirst 3 months on dialysis enabled us to iden-tify patients at higher risk of mortality. These are the patients with low BP (SBP or DBP), and those with severe early weight loss or weight loss that is maintained past thefirst month. Our results suggest that in patients new to dialysis, apparently normal or low levels of BP and weight loss may be associated with higher risk of mortality. We believe that clinicians should pay great atten-tion to BP level in patients reaching thefinal stage of CKD, perhaps even more if it is in the‘normal range’. Once dialysis therapy has started, a maintained decrease in BW without a clear haemo-dynamic improvement (persistent orthopnoea or dyspnoea with low BP) should be seen as an alert; the underlying reasons should be sought and therapy adapted to improve haemodynamic state with measures such as longer dialysis treatments, lower ultrafil-tration rates and introducing convective therapies, among others.
Supplementary data
Supplementary data are available online at http://ckj.oxford journals.org.
Con
flict of interest statement
None declared. The results presented in this paper have not been published previously in whole or part, except in abstract format. Parts of this manuscript have been presented at the European Renal Association–European Dialysis and Transplant Association (ERA-EDTA) Congress in London 2015.
Acknowledgements
We thank the Agence de la biomedicine for thefinancial support (grant REIN2012). We also thank Dr François de Cornelissen and the REIN registry. P.B. and A.A. are members of the European Ur-aemic Toxin working group of the European Society of Artificial Organs (ESAO), endorsed by the ERA-EDTA.
References
1. Réseau Epidémiologie et Information en Néphrologie. Rapport Annuel 2012. Saint Denis La Plaine Cedex, France: Agence de la biomédecine, 2012.
2. Saran R, Li Y, Robinson B et al. US Renal Data System 2014 annual data report: epidemiology of kidney disease in the United States. Am J Kidney Dis 2014; 63: e263–e270
C
LIN
IC
A
L
K
IDNE
Y
J
OURNA
at Bibliothèque Universitaire de médecine - Nîmes on February 3, 2016
http://ckj.oxfordjournals.org/
3. O’Donnell CJ, Elosua R. Cardiovascular risk factors. Insights from Framingham Heart Study. Rev Esp Cardiol Engl Ed 2008; 61: 299–310
4. Zager PG, Nikolic J, Brown RH et al.‘U’ curve association of blood pressure and mortality in hemodialysis patients. Kidney Int 1998; 54: 561–569
5. Pifer TB, Mccullough KP, Port FK et al. Mortality risk in hemo-dialysis patients and changes in nutritional indicators: DOPPS. Kidney Int 2002; 62: 2238–2245
6. Johansen KL, Young B, Kaysen GA et al. Association of body size with outcomes among patients beginning dialysis. Am J Clin Nutr 2004; 80: 324–332
7. Brunelli SM, Thadhani RI, Lynch KE et al. Association between long-term blood pressure variability and mortality among incident hemodialysis patients. Am J Kidney Dis 2008; 52: 716–726
8. Argilés A, Lorho R, Servel M-F et al. Seasonal modifications in blood pressure are mainly related to interdialytic body weight gain in dialysis patients. Kidney Int 2004; 65: 1795–1801 9. Miskulin DC, Meyer KB, Martin AA et al. Comorbidity and its change predict survival in incident dialysis patients. Am J Kidney Dis 2003; 41: 149–161
10. Chazot C, Jean G. The dynamics of prognostic indicators: to-ward earlier identification of dialysis patients with a high risk of dying. Kidney Int 2013; 84: 19–21
11. Vidal. Classification pharmacothérapeutique / Cardiologie - Angéio-logie / Antihypertenseurs.https://www.vidal.fr/classifications/ vidal/(20 November 2015, date last accessed)
12. Couchoud C, Stengel B, Landais P et al. The renal epidemi-ology and information network (REIN): a new registry for end-stage renal disease in France. Nephrol Dial Transplant 2006; 21: 411–418
13. Cnaan A, Laird NM, Slasor P. Using the general linear mixed model to analyse unbalanced repeated measures and longi-tudinal data. Stat Med 1997; 16: 2349–2380
14. Weiss RE. Tools and concepts. In: Modeling Longitudinal Data. New York: Springer, 2005, pp. 143–174
15. Eilers PH, Marx BD. Flexible smoothing with B-splines and penalties. Stat Sci 1996; 11: 89–102
16. Sipahioglu MH, Usvyat L, Liu L et al. Early systolic blood pres-sure changes in incident hemodialysis patients are asso-ciated with mortality in thefirst year. Kidney Blood Press Res 2012; 35: 663–670
17. Chazot C, Deleaval P, Bernollin A-L et al. Target weight gain during thefirst year of hemodialysis therapy is asso-ciated with patient survival. Nephron Clin Pract 2014; 126: 128–134
18. Badve SV, Paul SK, Klein K et al. The association between body mass index and mortality in incident dialysis patients. PLoS One 2014; 9: e114897
19. Mehrotra R, Berman N, Alistwani A et al. Improvement of nu-tritional status after initiation of maintenance hemodialysis. Am J Kidney Dis 2002; 40: 133–142
20. Port FK, Hulbert-Shearon TE, Wolfe RA et al. Predialysis blood pressure and mortality risk in a national sample of mainten-ance hemodialysis patients. Am J Kidney Dis 1999; 33: 507–517 21. Bansal N, McCulloch CE, Rahman M et al. Blood pressure and risk of all-cause mortality in advanced chronic kidney dis-ease and hemodialysis: the chronic renal insufficiency co-hort study. Hypertension 2015; 65: 93–100
22. Charra B, Chazot C, Laurent G. Hypertension/hypotension in dialysis. Kidney Int 1999; 55: 1128–1130
23. Raimann JG, Usvyat LA, Thijssen S et al. Blood pressure stabil-ity in hemodialysis patients confers a survival advantage: re-sults from a large retrospective cohort study. Kidney Int 2012; 81: 548–558
24. Cabezas-Rodriguez I, Carrero JJ, Zoccali C et al. Influence of body mass index on the association of weight changes with mortality in hemodialysis patients. Clin J Am Soc Nephrol 2013; 8: 1725–1733
25. Molnar MZ, Streja E, Kovesdy CP et al. Associations of body mass index and weight loss with mortality in transplant-waitlisted maintenance hemodialysis patients: body mass and waitlisted outcomes. Am J Transplant 2011; 11: 725–736 26. Stack S, Chertow GM, Johansen KL et al. Pre-ESRD changes in
body weight and survival in nursing home residents starting dialysis. Clin J Am Soc Nephrol 2013; 8: 1734–1740
27. Huang CX, Tighiouart H, Beddhu S et al. Both low muscle mass and low fat are associated with higher all-cause mortality in hemodialysis patients. Kidney Int 2010; 77: 624–629
28. Stenvinkel P, Gillespie IA, Tunks J et al. Inflammation modi-fies the paradoxical association between body mass index and mortality in hemodialysis patients. J Am Soc Nephrol 2015; doi: 10.1681/ASN.2015030252
29. Couchoud C, Labeeuw M, Moranne O et al. A clinical score to predict 6-month prognosis in elderly patients starting dialy-sis for end-stage renal disease. Nephrol Dial Transplant 2009; 24: 1553–1561
30. Ravani P, Palmer SC, Oliver MJ et al. Associations between hemodialysis access type and clinical outcomes: a systemat-ic review. J Am Soc Nephrol 2013; 24: 465–473
31. Ravani P, Gillespie BW, Quinn RR et al. Temporal risk profile for infectious and noninfectious complications of hemodi-alysis access. J Am Soc Nephrol 2013; 24: 1668–1677
32. Noordzij M, Jager KJ, van der Veer SN et al. Use of vascular access for haemodialysis in Europe: a report from the ERA-EDTA Registry. Nephrol Dial Transplant 2014; 29: 1956–1964
33. Holden JE, Kelley K, Agarwal R. Analyzing change: a primer on multilevel models with applications to nephrology. Am J Nephrol 2008; 28: 792–801
34. Flythe JE, Inrig JK, Shafi T et al. Association of intradialytic blood pressure variability with increased all-cause and car-diovascular mortality in patients treated with long-term hemodialysis. Am J Kidney Dis 2013; 61: 966–974
8 | F. Duranton et al.
C
LIN
IC
A
L
K
IDNE
Y
J
OURNA
L
at Bibliothèque Universitaire de médecine - Nîmes on February 3, 2016
http://ckj.oxfordjournals.org/