HAL Id: hal-01312323
https://hal.archives-ouvertes.fr/hal-01312323
Submitted on 5 May 2016HAL is a multi-disciplinary open access archive for the deposit and dissemination of sci-entific research documents, whether they are pub-lished or not. The documents may come from teaching and research institutions in France or abroad, or from public or private research centers.
L’archive ouverte pluridisciplinaire HAL, est destinée au dépôt et à la diffusion de documents scientifiques de niveau recherche, publiés ou non, émanant des établissements d’enseignement et de recherche français ou étrangers, des laboratoires publics ou privés.
Longitudinal strain of systemic right ventricle correlates
with exercise capacity in adult with transposition of the
great arteries after atrial switch
Magalie Ladouceur, Alban Redheuil, Gilles Soulat, Christophe Delclaux,
Michel Azizi, Mehul Patel, Gilles Chatellier, Antoine Legendre, Laurence
Iserin, Younes Boudjemline, et al.
To cite this version:
Magalie Ladouceur, Alban Redheuil, Gilles Soulat, Christophe Delclaux, Michel Azizi, et al.. Lon-gitudinal strain of systemic right ventricle correlates with exercise capacity in adult with transpo-sition of the great arteries after atrial switch. International Journal of Cardiology, Elsevier, 2016, �10.1016/j.ijcard.2016.04.166�. �hal-01312323�
Longitudinal strain of systemic right ventricle correlates with exercise capacity in adult
with transposition of the great arteries after atrial switch
Magalie Ladouceur (1, 2, 3), Alban Redheuil (4), Gilles Soulat (1, 4), Christophe Delclaux (5),
Michel Azizi (6), Mehul Patel (7), Gilles Chatellier (8), Antoine Legendre (2,3), Laurence
Iserin (2,3), Younes Boudjemline (2,3), Damien Bonnet (2), Elie Mousseaux (1,4): STARS
Investigators.
(1)INSERM U970, PARCC, Université Paris-Descartes.
(2) Department of PaediatricCardiology, Centre de référence des Malformations Cardiaques
Congénitales Complexes, M3C, Hôpital Necker Enfants malades,Assistance Publique—
Hôpitaux de Paris, Université Paris-Descartes, Paris, France.
(3) AdultCongenitalHeartDisease Unit, CardiologyDepartment, Hôpital Européen Georges
Pompidou, Assistance Publique—Hôpitaux de Paris, Université Paris-Descartes.
(4) Department of CardiovascularRadiology, HôpitalEuropéen Georges Pompidou, Assistance
Publique—Hôpitaux de Paris, Université Paris-Descartes.
(5) Service de Physiologie - Clinique de la Dyspnée, Hôpital Européen Georges Pompidou,
Assistance Publique—Hôpitaux de Paris, Université Paris-Descartes.
(6) Assistance Publique—Hôpitaux de Paris, Hôpital Européen Georges Pompidou, Centre d’Investigation Clinique, Assistance Publique—Hôpitaux de Paris, Université Paris-Descartes,
F-75015 Paris, France.
(7)Baylor College of Medicine, Houston, TX, USA.
(8)ClinicalResearch Unit, Hôpital Européen Georges Pompidou, Assistance Publique—
All the authors listed take responsibility for all aspects of the reliability and freedom from bias
of the data presented and their discussed interpretation.
Corresponding author:
Dr MagalieLadouceur
INSERM 970 &Adult Congenital Heart Disease Unit
Department of Cardiology
HôpitalEuropéen Georges Pompidou
20 rue Leblanc
75015 Paris
Tel: +33156093043
Fax:+33156092664
Abstract:
Background: Systemic right ventricle (sRV) dysfunction in d-transposition of the great
arteries following atrial switch (d-TGA) is associated with increased mortality. We aimed to
characterize maladaptive sRV mechanisms in d-TGA patients, analyzingrelation of
echocardiographic parameters of sRV systolic functionto objective measurements of exercise
capacity.
Methods: Forty-seven adult patients with d-TGAand atrial switch(mean age 31.6±4.2
years)underwent conventional echocardiography, bidimensional strain (2D-strain), cardiac
magnetic resonance (CMR) imaging and cardiopulmonary exercise evaluation on the same
day. Those with median peak oxygen uptake (VO2)>64.5% (n=23) constituted group A,those with VO2≤64.5% (n=24) constituted group B and 23 healthy age and gender matched subjects (n=23) constituted the control group.
Results: In group A, global longitudinal peak systolic 2D-strain (GLS) of sRV was
significantly reduced compared to GLS of normal RV and LV in the healthy control group
(p< 0.01), however peak longitudinal 2D strain was similar at basal and mid-segment of sRV
free wall than normal LV. In group B, GLS was significantly reduced compared to group A
(-10.9±2.9% vs -13.1±2.3%,p<0.05), mostly due tosignificant decrease of interventricular
septum longitudinal strain. Other echocardiographic systolic parameters were not significantly
different between group A and B.Only sRV GLS showed significantcorrelation with
functional capacity as measured by VO2 (r=0.42, p<0.01), while CMR RVEF did not.
Conclusion:GLS of sRV predicts functional capacity and may be more sensitive than CMR
RVEFin detecting early myocardial damage of sRV in patients with d-TGA and atrial switch.
Keywords:Transposition of the great arteries;systemicright ventricle; magnetic resonance
Introduction:
In patients with transposition of the great arteries (d-TGA) with a Mustard or Senning
procedure, the morphological right ventricle (RV) serves as the systemic ventricle (sRV).The
native trabeculated RV myocardium undergoes extensive trabecular hypertrophy as an
adaptive mechanism to enable pumping in the systemic circuit. However over time
maladaptation ensues and long-term follow-up of these patients shows that reduced function
of the sRV is associated with increased cardiovascular events and mortality1, 2. The evaluation
of the sRVsystolic function by using conventional ejection fraction indices continues to pose
major challenges.
Cardiac magnetic resonance (CMR) is now considered the gold standard for the assessment
and follow-up of sRV volumes and ejection fractionin d-TGApatients after atrial switch
operation3. The complexity of the shape and dynamic physiology of the sRV raise the need
for validation of additional echo derived sensitiveparameters to obtain periodic quantitative
estimatesof RVfunction. The longitudinal arrangement of the deep RV myocardial fibers from
the tricuspid valve annulus to theapex, make the longitudinal shortening of the RV greater
than the radial4. Therefore, measurement of the RV longitudinal shortening could be a
valuable adjunct to estimate sRV systolic function in patients after atrial switch. We
hypothesized that sRV longitudinal 2D-strain could bemore sensitive in detecting early
myocardial dysfunction comparedtoconventional measuressuch as ejection fractionin this
specific population.
Subjective functional assessment of patients with congenital heart disease is often flawed
because these patients present themselves as being asymptomatic while objective
measurements show strong limitations at exercise. Moreover, correlation between peak
oxygen consumption and sRV ejection fraction are controversial5, 6. Considering the potential
2D-strain of sRV with exercise capacity, in a population of adult patients after atrial switch for
transposition of the great arteries.
Methods:
We conducted a single-center, prospective, case-control study that included patients
with d-TGA following atrial switch, and age- and sex-matched healthy volunteers. The study
was performed in accordance with the principles set out in the declaration of Helsinki and was
approved by the local ERB(Comité de Protection des Personnes, Paris, Ile de France). All
patients and healthy volunteers provided written, informed consent to participate in the study.
From February 2011 to March 2012, 49 patients with d-TGA after atrial switch (32±4 years
old, 12 women) were studied. Patients with contraindication for CMR, gadolinium injection,
and cardiopulmonary exercise test (CPET), patients with residual ventricular septal defect,
prosthetic systemic atrioventricular valve, and pregnant women were not included in the study.
All eligible patients werefurther divided in 2 groups according to the median percent
predicted peak VO2 value, which was found to be 64.5%. Patients with predicted peak VO2 >
64.5% formed the group A, and patients with predicted peak VO2 ≤ 64.5% formed the group
B. To characterize adaptive mechanisms of sRV functionwe compared group Ato 23 healthy
subjects matched for age and sex (control group), and to determine sensitive
echocardiographic parameters of sRV function dysfunction, group A was compared to group
B. Group A, with the highest VO2 values, was considered as the patients group with the best
adaptive mechanisms of sRV to systemic afterload, and the group B, with the lowest VO2,
was considered as the patients group with maladaptive mechanisms of sRV function to
systemic afterload. Healthy subjects were recruited at the ClinicalInvestigationCenter of the
institution via a press release after d-TGA patient inclusion. Each subject provided their
evaluation, including an electrocardiogram. All patients and healthy subjects had
echocardiography, CMR and CPET all within 24 hours.
Transthoracic echocardiography was performed using a GE-VingmedVivid 7 system (Horten,
Norway) with high frame rate (60-90 Hz). Echocardiograms were examined by one of the
investigator (M.L.), who was blinded to CMR and CPET data. Complete two-dimensional,
Doppler color-flow, spectraland Tissue Doppler studies were performed, and tricuspid
regurgitation (TR) was graded as mild, moderate,or severe, according to the guideline of the
American Society of Echocardiography7, 8, 9.Systolic RV function indices were measured
according to recent American Society of Echocardiography guidelines8. Right ventricle
fractional area change (FAC) and tricuspid annular plane systolic excursion (TAPSE) were
measured in the apical 4-chamber view. Doppler method was used to measuredP/dTas the
time required for the systemic auriculo-ventricular valve regurgitation jet to increase velocity
from 1 to 3m/s, from the ascending limb of the TR continuous-wave Doppler signal. Velocity
time integral (VTI) was measured from pulsed-wave Doppler signal of the right outflow tract.
Systolic excursion velocity (S),isovolumic acceleration(IVA) and Tei index10were measured
using pulsed Doppler Tissue Imaging, with Doppler sample volume placed in the tricuspid
annulus of the RV free wall.
Using a dedicated software package designed for LV strain measurement (Echopac PC; GE
Healthcare, Waukesha, Wisconsin), 2D strain was measured by using standard bidimensional
acquisitions. The RVand the LV, visualized from the apical 4-chamber view, weredivided into
6 segments and each segment was individually analysed. By tracing endocardial contours on
end-diastolic frames, the software automatically tracked the contour on subsequent
frames.End systole was defined by aortic valve closure. Adequate tracking was verified in
contour to ensure optimal tracking.Two-dimensional longitudinal and transverse peak systolic
strains (i.e. radial strain) were assessed in apical 4 chamberview(Figure 1). Average
longitudinal and transverse peak systolic strains were globally calculated for the right and left
ventricles, regionally forRV free wall, interventricular septum and lateral left ventricle wall,
at basal, mid and apical level. Two-dimensional longitudinal and transverse peak systolic
strains were measured on the same consecutive cycles by analysing offline 2D acquisitions.
Measurements were repeated three months apart by the same observer (ML) and by a second
blinded observer (AL). Each observerindependently performed the measurements for 13
randomly selected patients,corresponding to 78 segments(78longitudinal and 78 transverse
strains). The reader was allowed to select the best cardiac cycle to perform the measure each
time.
All CMR examinations were performed on a 1.5 T system(SignaHDx, GEMS, Waukesha, WI,
USA)using a dedicated 8-channel phased array surface cardiac coil.For volumetric and
functional imaging, breathhold standard cine steady-state free-precession (SSFP)sequences
inshort-axis, 4- and 3-chamber views and RV vertical long-axis orientation were
acquired.CMR image analysis was performed by aninvestigator (E.M.), using QMASS
platform and software (Medis, the Netherlands), resulting in RV diastolic (ED) and
end-systolic (ES) volumes, and RVEF (%).Measurements were repeated apart by the same
observer (EM) and by a second blinded observer (GS) in 23 randomly selected patients.
Each patient had to perform an exercise stress test on a bicycle ergometer (Sensor Medics,
Yorba Linda, CA) with measurements of oxygen consumption (VO2). After a 2 min warm-up
period the workload was increased by 10–20 Watts/minute (according to the level of fitness)
using a ramp protocol until exhaustion.Patients were encouraged to perform maximal exercise.
Testing was terminated after the patient reached the target heart rate (based on age) or because
tachycardia, or ischemic electrocardiographic changes. Respiratory quotient during exercise
testing (target 1.1) was used to indicate whether maximum work had been achieved. Peak
oxygen consumption (peak VO2), oxygen pulse (VO2/heart rate), and the minute
ventilation-carbon dioxide production relationship (VE/VCO2 slope) were assessed from gas exchange
measurements. Maximal exercise and peak circulatory power were assessed to estimate the
level of maximal exercise capacity.
Statistical Analysis:
Datawere presented as mean value ± SD when variables were normally distributed, and
median value with 95% of confidence interval when they were not. The group A and Bof
d-TGA and the control group of healthy subjects were compared by 2-sample t tests or
Mann-Whitney when appropriate.Correlations between echocardiographic parameters, CMR RVEF
and CPET measurements were tested by Spearman correlation, and adjustments were
madeusinga multiple regression. If the r-value<0.4, the correlation wasconsidered weak;
0.4<r<0.5: moderate and if r> 0.5, then the correlation is strong.A 2-tailed p value ≤0.05 was
considered to be statistically significant. The repeatability (intraobserver variability) and
reproducibility (interobserver variability) of the CMR and echocardiographic parameters were
observed by calculating the variability coefficient as the difference between the two
observations divided by the means of the observations, expressed as percentage, and analyzed
using intraclass correlation coefficients. For the interobserver study, the mean of the two
measures by the first observer was used. Alldata were analysed using MedCalc Statistical
Software version 12.7.7 (MedCalc Software bvba, Ostend, Belium; http://www.medcalc.org;
Results:
Study population
Patient and control characteristics are summarized in Table 1. Two patients were excluded
because sRV free wall could not be adequately visualized during standard echocardiography.
Of the remaining 47 patients(32±4 years old, range 22-39 years, 12 women), 13 were
operated on using Mustard procedure and 34 usingSenning procedure, combined with
ventricular septal defect closure in 2 patients, at a median age of 6.6 months of age, 95%CI
[3.8 – 12.2]. The average length of time between the initial surgery and the study was 31.4±7
years. Two patients were in junctional rhythm during the study. Only one patient had
undergone additional cardiac surgery after the initial operation to treat a pulmonary venous
pathway stenosis. Five patients were in NYHA functional class II, one in class III and the
remaining in class I. Only 2 patients had moderate to severe tricuspid regurgitation, and one
patient had severe pulmonary stenosis.Twenty three d-TGA patients with peak VO2>64.5%
formed group A, and 24 with peak VO2 ≤ 64.5% formed group B.No difference in age and
sex was found between group A, B and controls. Blood pressure and heart rate were not
different between the 3 groups.
Relation between parameters of sRV function and NYHA functional class
There was no significant difference of peak oxygen uptake between patients with NYHA=1
(n=41, predicted peak oxygen uptake=62.3±10.1%) and patients with NYHA>1(n=6,
predicted peak oxygen uptake=58.7±10.8%, p=0.2). Among standard echocardiographic
parameters of systemic RV function, only peak S wave and IVA were significantly lower in
patients with NYHA>1 compared to patients with NYHA=1 (respectively, p=0.02 and
systemic RV which was significantly lower in patients NYHA>1 (-12.6±2.7% vs -9.5±3.8%,
p=0.01). CMR RVEF was also significantly lower in d-TGA patients with NYHA>1 (42±17.8 vs 50.3±8.3%, p=0.03), with RVEF ≤30% in half of these patients.
Echocardiography parameters of sRV function:
Echocardiography and exercise test outcomes of group A and B compared to controls are
summarized in Table 2 and 3.
Percent predicted peak oxygen uptake value was significantly lower in group A than in
controls (74% vs 96%, p<0.01, table 2). CMR RVEF was similar in d-TGA patients of group
A and of healthy subjects (50±8% vs 50±11%, p=0.9), and was lower than CMR LVEF of
healthy subjects (59±5%, p<0.01). All standard echocardiography indices of sRVlongitudinal
function (IVA, TAPSE, peak S wave and Tei index) weredecreased in d-TGA patients of
group A, compared to RV and LV controls. Only outflow tractVTIand dP/dT of systemic
ventricle were not different. Longitudinal peak systolic 2D strains of each sRV segment of
d-TGA patients in group Awere significantly reducedcompared to corresponding strains
estimated in normal RV. Global longitudinal peak systolic 2D strain of sRV was lower than
those of normal LV, however peak systolic 2D strain of the basal and mid segments of sRV
free wall in d-TGAwere not different than basal and mid segment of LV lateral wallin
controls. Global longitudinal peak systolic 2D strain of the pulmonary LV was not different
than those of the RV in controls. Globaltransverse peak systolic 2D strain of sRVin group A
wasnot different to normal RV, but was significantly reduced compared to normal LV. This
reduction mainly touched interventricular septum.Transverse peak systolic 2D strain values of
RV free wall were higher in sRV than in normal RV, reaching values of theLV lateral wall
from the controls. This increase mainly concerned the basal sRV free wall.
When we compared group A and B, systemic RVEF was not different (group A=50±8% vs
significant reduction of global peak systolic 2D strain and of septal longitudinal peak systolic
2D strain compared to d-TGA patients of group A. There was no difference in global
longitudinal peak systolic 2D strain of the pulmonary LV,global transverse peak systolic 2D
strain of sRV and longitudinal strain rate of sRVbetween the 2 groups.
Relation between parameters of sRV function and peak oxygen uptake:
In univariate analysis, only GLS (r=0.42, p<0.01) and basal longitudinal peak systolic 2D
strain (r=0.40, p=0.02) correlated moderately with peak oxygen uptake expressed as a
percentage of predicted values(table 4, Figure 2). This correlation was not observed in the
healthy subjects (r=0.12, p=0.6, Figure 2). None of the volumetric CMR parameters of sRV
(indexed ED RV volume, indexed ES RV volume, indexed mass, andRVEF) correlated with
exercise capacity, in d-TGA. Furthermore, no association was found between peak oxygen
uptake and either tricuspid regurgitation grade, sRV standard echocardiographic parameters,
pulmonary LV global longitudinal peak systolic 2D strain orsystemic RV transverse strain
derived from speckle imaging parameters (table 4). GLS remained significantly correlated
with peak oxygen uptake as percentage of predicted value, after adjusting for systolic BP, age,
sex, complexity of d-TGA, and treatment of cardiac failure(r=0.41,p=0,01). Systemic RVEF
as well asGLS and GTS were not correlated with anaerobic threshold, oxygen
pulse,VE/VCO2 slope and peak circulatory power. No correlation was found between GLS
and systemic RVEF.
Reproducibility:
Intra-class correlation coefficient for intra observer and inter observer reproducibility of
GLSwere respectively 0.95, 95%CI [0.82-0.98] and 0.93 [0.75-0.98], and the coefficient of
variation was 6.7% and 8.6% respectively for GLS.Feasibility of this measurement was
observer=0.73 [0.52-0.86] and inter observer reproducibility=0.65|0.49-0.80], and coefficients
of variation were23.1% and 26.4% respectively.
Intra-class correlation coefficient for intra and inter observer reproducibility of CMR
sRVEFwere respectively 0.96, 95%CI [0.90-0.98] and 0.94, 95%CI [0.85-0.98], and the
coefficient of variation was 2.8%and 3.4%respectively.
Discussion
Global longitudinal peak systolic 2D strain of sRV is the only echocardiographic parameter of
sRVsystolic functionwhich is moderately related to peak oxygen uptakein our study.
SystolicRVEF decrease is associated with NYHA functional class impairment. However,
NYHA functional class underestimates exercise limitations of patients with d-TGA, and
systemic RVEF is not related to peak oxygen uptake. GLS seems to be more sensitive for
detectingsRV dysfunction than the gold standard, CMR RVEF, which is not predictive of
exercise performance.
Echocardiographic parameters of sRV function in patients according functional tolerance:
All standard echocardiographic parameters of longitudinal sRV function (TAPSE, peak S,
IVA and longitudinal strain) in the group of d-TGA patients with the highest VO2 are
significantly reduced, compared to healthy controls with anatomic LV as systemic ventricle.
Like in previous studies, we confirm that there is a significant reduction of longitudinal
strainin sRV of d-TGA following atrial switch11, 12, 13. A decrease in RV longitudinal strain is
well described when afterload increases14. Longitudinal RV deformation was mainly impaired
by increased RV afterload, because RV myocytes arrangement is predominantly longitudinal,
wall toward the septum15. From our results, 2adaptive mechanisms of RVchronically and
congenitally submitted to systemic afterload may be drawn: 1/ longitudinal strain values at
basal and mid segmentsofsRV free wall are preserved in group A compared to basal and mid
segments strain values of normal LV at lateral wall;2/ transverse 2D strain valuesat the basal
segment of sRV free wall increase compared to values at corresponding segments of normal
RV,so that they reachthose of normal LV. This shift in the sRV free wall from longitudinal to
transverse deformation was already observed in sRV11, 12. It mainly concerns basalsegment
ofsRV free wall. We also observe a correlation between longitudinal strain of this segmentand
peak oxygen uptake, unlike the other segments of sRV free wall.Inward movement of the RV
free wall is very important during early phase of RV contraction, inducing the peristalsis like
bellows effect. So, deformation of the basal segment of sRV free wall may be preserved or
increased to maintain a normal cardiac output. GLS is decreased in patients with lower VO2
as well as symptomatic patients (NYHA>1), whereas sRVEF is only impaired in patients with
NYHA>1, and is no related to VO2. GLS seems to be more sensitive than sRVEF to detect
myocardial dysfunction in sRV.
Relations between parameters of sRV function and exercise performance.
A decrease in the functional capacityofd-TGApatients after an atrial switch is above all
related to an impairment of longitudinal function with a decrease of TAPSE, peak S wave and
longitudinal 2D strain, while RVEF does not change. Interventricular septum longitudinal
deformation is moreimpaired than sRV free wall deformationsuggesting the probable role of
LV interdependence in exercise limitationof d-TGApatients following atrial switch.
RV-LV relationship was also shown in the Diller et al study with a systemic and pulmonary
A decrease in systemic RVEF of group B compared to group A is not statistically significant,
whereas all longitudinal function parameters (TAPSE, peak S wave and GLS) are reduced in
group B compared to group A. The preservation of transverse deformation (GTS) mayexplain
the absence of sRVEFdifference between the 2 groups. Previous data on the relation of RVEF
at rest and exercise capacity in patients with sRV have been conflicting. Lack of correlation
betweenexercise capacity and indices of left ventricular performances at rest in acquired heart
failure has been previously reported17.Here we have shown that longitudinal strain of sRV
correlates moderately with peak oxygen uptake, but thatsystemic RVEF does not correlate
with exercise parameters. Similarly, Donal etal.18 have shown that global longitudinal strain
of LV correlated better than LVEF with exercise performances in chronic heart failure.As
previously described, no correlation was foundbetween GLS and RVEF, meaning that GLS
and RVEF do not definitely provide the same information about systemic RV function19,
mainly because RV myofiber arrangement is predominantly longitudinal15,20.
Limitations: The group A and B were formed by finding the median VO2, a value intrinsic to
this specific set of patients, rather than clinically meaningful cut-off as NYHA functional
class. This was explained by the limit of subjective functional assessment in patients with
congenital heart disease illustrated by patients with low peak oxygen uptake in NYHA 1
(19/24, 79%). We only studied systolic function, but abnormal diastolic function due to
restrictive atrial baffles can also restrict a rise in stroke volume at exercise21. Transverse strain
measured from apical view has got a poor reproducibility.This result could be explained by
off-plane radial displacements of sRV tissue in the apical view.Because of the shape of the
RV, most of parameters of function could not include the RV outflow tract. The population
included here is a selected one for methodology reasons, limiting the number of study patients.
However, atrial switch population is likely to contain patients with pacemakers, often with
Conclusion
In patients with d-TGAafter atrial switch, longitudinal and transverse deformations are
significantly reduced compared to controls, except in basal and mid regions of the systemic
ventricular free wall. This adaptive response may allow sRV to support normal cardiac output,
even if the systemic RVEF is lower than healthy subjects. Measurement of RV longitudinal
2D strain is better correlated to exercise intolerance thansRVEF which is the gold standard to
evaluate sRV function. RV longitudinal 2D strain should be part in evaluation of sRV
function.
Acknowledgement: This study was fully supported by Grant CRC P080609 from the French
References
1. Cuypers JA, Eindhoven JA, Slager MA, et al. The naturalandunnaturalhistory of
theMustard procedure: long-term outcome up to 40 years. EurHeart J. 2014;35(25):1666–74.
2. Schwerzmann M, Salehian O, Harris L, et al.Ventriculararrhythmiasandsuddendeath in
adultsafter a Mustardoperationfortransposition of thegreat arteries. EurHeart J.
2009;30(15):1873-9.
3. Baumgartner H, Bonhoeffer P, De Groot NM, et al; Task Force on the Management of
Grown-up CongenitalHeartDisease of the European Society of Cardiology (ESC);
Association for European PaediatricCardiology (AEPC); ESC
CommitteeforPracticeGuidelines (CPG). ESC Guidelinesforthe management of grown-up
congenitalheartdisease (new version 2010). EurHeart J. 2010;31(23):2915-57.
4. Ho SY, Nihoyannopoulos P. Anatomy, echocardiography, andnormal right
ventriculardimensions. Heart. 2006; 92 (suppl 1): i2–i13.
5. Winter MM1, van der Plas MN, Bouma BJ, Groenink M, Bresser P, Mulder BJ.
Mechanismsforcardiac output augmentation in patientswith a systemic right ventricle. Int J
Cardiol. 2010;143(2):141-6.
6. Benson LN, Bonet J, McLaughlin P, et al. Assessment of right
ventricularfunctionduring supine bicycleexerciseafterMustard'soperation. Circulation.
7. Douglas PS, DeCara JM, Devereux RB, et al; American Society of Echocardiography
Standards; American College of Cardiology Foundation..Echocardiographic imaging in
clinical trials: American Society of Echocardiography Standards
forechocardiographycorelaboratories: endorsedbythe American College of
CardiologyFoundation.J Am SocEchocardiogr. 2009;22(7):755-65.
8. Rudski LG, Lai WW, Afilalo J, et al. Guidelinesfortheechocardiographic assessment
of the right heart in adults: a report fromthe American Society of
Echocardiographyendorsedbythe European Association of Echocardiography, a
registeredbranch of the European Society of Cardiology, andthe Canadian Society of
Echocardiography.J Am SocEchocardiogr. 2010;23(7):685-713.
9. Zoghbi WA, Enriquez-Sarano M, Foster E, et al; American Society of
Echocardiography. Recommendationsforevaluation of theseverity of native
valvularregurgitationwithtwo-dimensionaland Doppler echocardiography. J Am
SocEchocardiogr. 2003;16(7):777-802.
10. Salehian O, Schwerzmann M, Merchant N, Webb GD, Siu SC, Therrien J. Assessment
of systemic right ventricularfunction in patientswithtransposition of thegreat arteries
usingthemyocardial performance index: comparisonwithcardiacmagneticresonanceimaging.
Circulation. 2004;110(20):3229-33.
11. Pettersen E, Helle-Valle T, Edvardsen T, et al. Contractionpattern of thesystemic right
ventricle shift fromlongitudinaltocircumferentialshorteningand absent
12. Di Salvo G, Pacileo G, Rea A, et al. Transverse strainpredictsexercisecapacity in
systemic right ventriclepatients. Int J Cardiol. 2010;145(2):193-6.
13. Grewal J, Crean A, Garceau P, et al.Subaortic right
ventricularcharacteristicsandrelationshiptoexercisecapacity in
congenitallycorrectedtransposition of thegreat arteries. J Am SocEchocardiogr.
2012;25(11):1215-21.
14. Jamal F, Bergerot C, Argaud L, Loufouat J, Ovize M.
Longitudinalstrainquantitatesregional right ventricularcontractilefunction. Am J
PhysiolHeart Circ Physiol. 2003;285(6):H2842-7.
15. Geva T, Powell AJ, Crawford EC, Chung T, Colan SD. Evaluation of
regionaldifferences in right
ventricularsystolicfunctionbyacousticquantificationechocardiographyand cine
magneticresonance imaging. Circulation. 1998;98:339–345
16. Diller GP, Radojevic J, Kempny A, et al. Systemic right ventricularlongitudinalstrain
is reduced in adultswithtransposition of thegreat arteries,
relatestosubpulmonaryventricularfunction, andpredicts adverse clinicaloutcome. Am Heart J.
17. Franciosa JA, Park M, Levine TB. Lack of
correlationbetweenexercisecapacityandindexes of restingleftventricular performance in heart
failure. Am J Cardiol. 1981;47(1):33-9.
18. Donal E, Coquerel N, Bodi S, et al. Importance of ventricularlongitudinalfunction in
chronicheart failure.Eur J Echocardiogr. 2011;12(8):619-27.
19. Iriart X, Horovitz A, van Geldorp IE, et al.The role of echocardiography in the
assessment of right ventricularsystolicfunction in patientswithtransposition of thegreat
arteries andatrialredirection. ArchCardiovasc Dis. 2012;105(8-9):432-41.
20. Sanchez-Quintana D, Anderson RH, Ho SY. Ventricularmyoarchitecturein tetralogy of
Fallot. Heart 1996;76:280–6.
21. Fratz S, Hager A, Busch R, et al. Patientsafteratrial switch operationfortransposition of
thegreat arteries cannotincreasestroke volume under dobutamine stress as
opposedtopatientswithcongenitallycorrectedtransposition. Circ J. 2008;72(7):1130-5.
22. Vejlstrup N, Sørensen K, Mattsson E, et al. Long-Term Outcome of
Mustard/SenningCorrectionforTransposition of the Great Arteries in Sweden and Denmark.
Figures legends
Figure 1: Global longitudinal peak systolic 2D strain (panel A), and transverse peak systolic
2D strain (panel B) of sRV in a d-TGA patient from group A on the left, and of normal
sub-pulmonary RV in a healthy subject on the right.
Figure 2: Regression curve between peak oxygen uptake and global longitudinal peak systolic
Tables: Global d-TGA population (n=47) group A (n=23) group B (n=24) controls (n=23)
Age, mean±SD, years 31.6±4.2 33.0 ± 4.9 33.5 ± 6.0 32.6 ± 7.0
Sex ratio (M/F) 12/35 17/6 18/6 17/6 BSA, mean±SD, m² 1.8±0.2 1.9 ± 0.2 1.8 ± 0.2 1.9 ± 0.2 Systolic BP, mean±SD, mmHg 114.6 ± 12.0 114.7 ± 12.4 114.6 ± 11.8 115.9 ± 7.5 Diastolic BP,mean±SD,mmHg 70.8 ± 11.0 70.1 ± 10.9 71.5 ± 11.2 68.7 ± 6.1
Heart rate, mean±SD, bpm 66.9 ± 11.2 65.8 ± 8.9 66.4 ± 11.8 63.2 ± 10.2
History of heart failure, n
(%) 3 (6.2) 1(4) 2 (8) _ History of arrhythmia, n (%) 10 (21.3) 5 (21.7) 5 (20.8) _ NYHA I/II/III/IV, n 41/5/1/0 23/0/0/0 19/4/1/0 23/0/0/0 Sinus rythm, n (%) 45 (95.7) 22 (96) 23 (96) 23 (100) QRS duration, mean±SD, ms 97±25 105±52 97±39 _
Treatment
ARA2- ACEinhibitors
Β-blockers Diuretics 5 7 1 1 4 0 4 3 1 _ CMR RVEDV, mean ±SD, ml/m² RVESV, mean ±SD, ml/m² RVEF, mean ±SD, % 93±31 50±26 47±9 89 ± 12 43 ±14 50 ± 9 98 ± 40 57 ± 34 45 ± 10 85 ±16 40 ± 8 50±11
Table 1: Demographic, clinical and CMR characteristics in d-TGA (global population, group
A and B) and controls. ARA2: angiotensin receptor antagonist 2- ACE inhibitors: antagonist
conversion enzymeinhibitors, CMR: cardiac magnetic resonance imaging, RVEDV: right
ventricle end-diastolic volume, RVESV: right ventricle end-systolic volume, RVEF: RV
Variable Healthy subjects (n=23) Global d-TGA population (n=47) Group A (n=23) Group B (n=24) p-value Exercise duration (sec) 666 [601-744] 599 [483-672] 551 [480-660] 486 [412-559] <0.001 Peak systolic BP (mmHg) 176 [158.5-195] 160 [140-179] 153[140-165] 147 [133-178] 0.02 Peak diastolic BP (mmHg) 86 [78-94] 85 [75-93] 81 [71-93] 83 [75-90] 0.3
Peak heart rate,
(bpm) 176 [170-183] 166 [154-176] 166 [157-171] 154 [145-161] <0.001 Peak VO2 (%) 96[79-106] 74 [63-90] 74 [70-79] 60 [52-62] <0.001 Peak VO2, L/min 2.6 [2.1-2.8] 1.9 [1.5-2.5] 1.8 [1.4-2.0] 1.6 [1.2-1.9] <0.001 Anaerobic threshold (%) 52 [45-62] 41 [34-49] 42 [35-46] 32 [29-36] <0.001 VE/VCO2 slope 27 [26-29] 30 [27-35] 31 [30-36] 35 [31-40] <0.001
Table 2: Results of exercise test in group A, B and controls. Values are medians [interquartile
range].p values were given for the comparison between global d-TGA population and controls.
Systolic parameters d-TGA (n=47) Control n=23 group A (n=23) systemic RV group B (n=24) systemic RV RV LV S tanda rd pa ra mete rs
FAC, median 95%CI, % 38 [33 – 42] 36.8 [32-39] 61 [51-66]§ _
dP/dT, median 95%CI, mmHg/s 868 [723-1111] 1220 [723 – 1263] 273 [186-333]§ 947 [735-1114]
outflow tract TVI, median
95%CI, cm
19 [17-23] 18 [15-20] 21±5 21±4
IVA, median 95%CI, m/s² 0.9 [0.7-1.2] 0.8 [0.7-1.1] 2.0[1.6-2.8]§ 3.2 [2.7-3.6]¥
APSE, mean±SD, mm 12.5 ±2.9 10.3±3.5* 23.2±3.7§ 15.3±3.0¥
Peak S wave, median 95%CI,
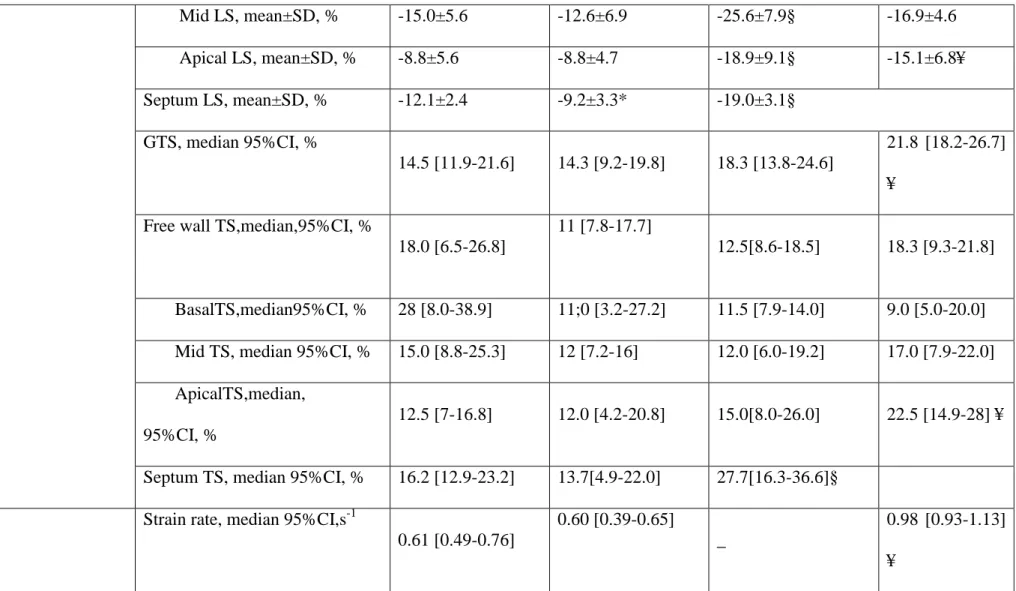
cm/s 8.0 [7.0-9.0] 6.0 [5.0-7.0]* 13.9±2.2§ 12.2±2.5¥ Tei, mean±SD 0.41±0.12 0.46±0.12 0.40±0.16§ 0.26±0.16¥ S pe ckle tra cking pa ra mete rs GLS, mean±SD, % -13.1±2.3 -10.9±2.9* -19.5[-19.9- -21.1]§ -18.1±2.6 ¥
Free wall LS, mean±SD, % -14.6±3.4 -11.7±5.2* -23.1±9.3§ -17.3±3.6¥
Mid LS, mean±SD, % -15.0±5.6 -12.6±6.9 -25.6±7.9§ -16.9±4.6 Apical LS, mean±SD, % -8.8±5.6 -8.8±4.7 -18.9±9.1§ -15.1±6.8¥ Septum LS, mean±SD, % -12.1±2.4 -9.2±3.3* -19.0±3.1§ GTS, median 95%CI, % 14.5 [11.9-21.6] 14.3 [9.2-19.8] 18.3 [13.8-24.6] 21.8 [18.2-26.7] ¥
Free wall TS,median,95%CI, %
18.0 [6.5-26.8]
11 [7.8-17.7]
12.5[8.6-18.5] 18.3 [9.3-21.8]
BasalTS,median95%CI, % 28 [8.0-38.9] 11;0 [3.2-27.2] 11.5 [7.9-14.0] 9.0 [5.0-20.0]
Mid TS, median 95%CI, % 15.0 [8.8-25.3] 12 [7.2-16] 12.0 [6.0-19.2] 17.0 [7.9-22.0]
ApicalTS,median,
95%CI, %
12.5 [7-16.8] 12.0 [4.2-20.8] 15.0[8.0-26.0] 22.5 [14.9-28] ¥
Septum TS, median 95%CI, % 16.2 [12.9-23.2] 13.7[4.9-22.0] 27.7[16.3-36.6]§
Strain rate, median 95%CI,s-1
0.61 [0.49-0.76]
0.60 [0.39-0.65]
_
0.98 [0.93-1.13]
¥
Table 3: Comparison of standard echocardiographic parameters and peak systolic 2D strain of systemic ventricle function between d-TGA
systolic 2D strain, GTS: global transverse peak systolic 2D strain, LS: longitudinal peak systolic 2D strain, TS: transverse peak systolic 2D strain.
TVI: time velocity integral, IVA: isovolemic acceleration, APSE: annular plane systolic excursion.*: significant difference between RV
parameters of group A and group B, §: significant difference between RV parameters of group A and controls; ¥: significant difference between
variables Correlation coefficient r 95% confidence interval for r p value GLS 0.424 0.129-0.649 0.0065 GTS -0.070 -0.970-0.243 0.7 dP/dT 0.047 0.389-0.307 0.8 Peak S wave 0.254 -0.055-0.518 0.3 CMR RVEF 0.214 -0.096-0.487 0.2 FAC 0.092 -0.218-0.385 0.6 Aortic VTI 0.260 -0.052-0.526 0.3 IVA 0.054 -0.254-0.353 0.7 TAPSE 0.264 -0.052-0.532 0.1 Tei 0.025 -0.288-0.334 0.9
Table 4:Correlation between standard echocardiographic and speckle tracking measurements
of sRV function and percent predictive value of peak oxygen uptake. CMR RVEF: right
ventricle ejection fraction by cardiac magnetic resonance imaging. FAC: fractional area
change, GLS: global longitudinal peak systolic 2D strain, GTS: global transverse peak
systolic 2D strain, VTI: velocity time integral, IVA: isovolumic acceleration, TAPSE: