HAL Id: hal-02989489
https://hal.inria.fr/hal-02989489
Submitted on 7 Nov 2020HAL is a multi-disciplinary open access archive for the deposit and dissemination of sci-entific research documents, whether they are pub-lished or not. The documents may come from teaching and research institutions in France or abroad, or from public or private research centers.
L’archive ouverte pluridisciplinaire HAL, est destinée au dépôt et à la diffusion de documents scientifiques de niveau recherche, publiés ou non, émanant des établissements d’enseignement et de recherche français ou étrangers, des laboratoires publics ou privés.
Reinforcement Learning Enables Resource-Partitioning
in Foraging Bats
Aya Goldshtein, Michal Handel, Ofri Eitan, Afrine Bonstein, Talia Shaler,
Simon Collet, Stefan Greif, Rodrigo Medellín, Yuval Emek, Amos Korman, et
al.
To cite this version:
Aya Goldshtein, Michal Handel, Ofri Eitan, Afrine Bonstein, Talia Shaler, et al.. Reinforcement Learning Enables Resource-Partitioning in Foraging Bats. Current Biology - CB, Elsevier, 2020, 30 (20), pp.4096-4102.e6. �10.1016/j.cub.2020.07.079�. �hal-02989489�
Reinforcement Learning Enables Resource-Partitioning in
1
Foraging Bats
2
Aya Goldshtein1, Michal Handel1, Ofri Eitan1, Afrine Bonstein1, Talia Shaler1, Simon Collet2,
3
Stefan Greif3, Rodrigo A. Medellin4, Yuval Emek5, Amos Korman2* & Yossi Yovel1,3*.
4 5
1 School of Zoology, Faculty of Life Sciences, Tel Aviv University, Tel Aviv 6997801, Israel
6
2 CNRS and University of Paris, The Institute for Research in Fundamental Information
7
Technology (IRIF), Paris, 75013, France 8
3 Sagol School of Neuroscience, Tel Aviv University, Tel Aviv 6997801, Israel
9
4 Departamento de Ecología de la Biodiversidad, Instituto de Ecología, Universidad, Nacional
10
Autónoma de México, Ciudad de México 04510, México 11
5 Faculty of Industrial Engineering and Management, Technion - Israel Institute of
12
Technology, Haifa 3200003, Israel 13
* Correspondence: yossiyovel@gmail.com and amos.korman@irif.fr 14
Lead Contact: Yossi Yovel (yossiyovel@gmail.com)
15 16
Summary
17
Every evening, from late spring to mid-summer, tens of thousands of hungry lactating female 18
Lesser long-nosed bats (Leptonycteris yerbabuenae) emerge from their roost and navigate 19
over the Sonoran Desert seeking for nectar and pollen [1,2]. The bats roost in a huge maternal 20
colony which is far from the foraging grounds, but allows their pups to thermoregulate [3] 21
while the mothers are foraging. Thus, the mothers have to fly tens of kilometers to the 22
foraging sites - fields with thousands of Saguaro cacti [4,5]. Once at the field, they must 23
suggested for this classical foraging task of exploiting a resource composed of many 25
renewable food-sources whose locations are fixed. Some animals randomly visit the food 26
sources [6], some actively defend a restricted foraging territory [7–11], or use simple forms 27
of learning such as ‘win-stay lose-switch’ strategy [12]. Many species have been suggested to 28
follow a trapline, that is, to re-visit the food sources in a repeating ordered manner [13–22]. 29
We thus hypothesized that lesser long-nosed bats would visit cacti in a sequenced manner. 30
Using miniature GPS devices, aerial imaging and video recordings, we tracked the full 31
movement of the bats and all of their visits to their natural food-sources. Based on real data 32
and evolutionary simulations, we argue that the bats use a reinforcement learning strategy, 33
that requires minimal memory, to create small non-overlapping cacti-cores and exploit nectar 34
efficiently, without social communication. 35
36
Keywords: Nectar feeding bats, reinforcement learning, resource partitioning, trapline,
37
behavioral ecology, movement ecology. 38
39
Results and Discussion
40
The foraging task of the Lesser long-nosed bat is particularly complex. Saguaro fields 41
(Carnegiea gigantea) in the northern Sonora contain many hundreds of cacti per square 42
kilometer [23]. The cactus flowers open in the evening and start producing nectar ca.1.5 43
hours after sunset at a constant rate of 0.1±0.004 ml/h per flower (Figure S1A, STAR 44
Methods). The quality of a specific cactus can vary dramatically according to the number of 45
flowers it opens on a given night, which translates linearly to its total rate of nectar 46
production (flowers produce nectar at similar rates and sugar concentration is similar, see 47
STAR Methods). Moreover, there is little correlation between the quality of neighboring cacti 48
(Figure 1A). 49
Energetic estimates (see STAR Methods) suggest that a lactating female needs to drink 14.1-50
18.9 ml of nectar per night. Because a single cactus provides no more than 0.65 ml during the 51
hours that a bat spends in the field, a bat must visit many cacti. As high-quality cacti are rare 52
and most cacti have 0-1 open flowers (Figure 1A and Figure S1B), it is worthwhile for a bat 53
to invest time in exploring the field. Moreover, bats have to re-map the field every night. 54
Although we found a significant correlation between the number of flowers on a cactus on 55
consecutive nights, there was much inter-night variability (Spearman correlation test: r=0.6, 56
P<0.001, Figure S1C-D). Importantly, even if the exploration is effective, the corresponding 57
exploitation might not be trivial. In theory, a bat could memorize when it last visited a 58
profitable cactus [24] and plan to revisit it after some time interval, but it cannot be certain it 59
will find the expected nectar, since a conspecific might deplete it in the meanwhile (the bats’ 60
behavior suggests that they do not know if a flower was recently visited, Figure S1E-F). We 61
thus set out to examine how bats make foraging decisions under such uncertainty. 62
We used miniature GPS devices to track bats’ movement. We employed drone and aerial 63
imaging (of ~3600 cacti) to identify all resources available to the bats, that is, the positions of 64
the cacti that they visited and the estimated distribution of flowers. To complete our 65
understanding at the population level, we video-monitored tens of cacti over full nights, 66
recording all bat (and other pollinator) activity. Finally, all of these data were used to develop 67
a mathematical model that aims to explain the bats’ foraging strategy. 68
In total, we GPS tracked 17 lesser long-nosed females. We then used aerial imaging to 69
reconstruct the location of all cacti at the foraging sites of eight bats (STAR Methods). 70
Henceforward, unless stated otherwise, all foraging analyses were conducted for these n=8 71
bats, with a mean of 2.9±2.1 nights per bat. Tracking revealed extreme commutes of tens of 72
kilometers, from the colony to the cacti fields (the average one-way commute was 55.4±17.2 73
km, Mean±SD, n=17 bats, with a record-holding bat that flew ~104 km to reach the field, 74
Figure 1A). On consecutive nights, bats typically returned to the same field (in 25 out of the 75
28 consecutive nights that we monitored for 8 bats, Figure 1B). 76
77
Commuting to the foraging fields took 1.6±0.8 hours, in which bats flew at a mean ground 78
speed of 8.7±0.8 m/s, mean air speed of 9.1±0.9 m/s, and a mean altitude of 126±75 m above 79
ground (Mean±SD, n=17 bats, maximum ground speed was 18.3 m/s and maximum altitude 80
was ~1045 m). These long commute flights account for an average of ~46% of the total time 81
a bat spends out-doors, implying that the bats should use the remaining time for exploiting 82
the field efficiently. 83
Foraging dynamics throughout the night
84
Once in the field, bats spent 2.2±0.7 hours foraging (n=11, Mean±SD). Even though a single 85
Saguaro field in this region can spread over a few square kilometers, each bat concentrated its 86
foraging on a relatively small area (0.14±0.09 km2, the convex hull of all locations defined as
87
foraging, STAR Methods). Moreover, even within this restricted site, the bat did not visit all 88
cacti uniformly, but clearly preferred some cacti over others (Figure 2A). We defined a cactus 89
that was visited by a specific bat at least five times throughout the night as belonging to this 90
bat’s core cacti (see STAR Methods and Figure S1G-H for the reasoning behind this 91 definition). 92 93 94
The bats combined exploitation of their core cacti with exploration of new unvisited cacti 95
(Figure 2B-C and insert in Figure 2A), and they gradually increased the exploitation to 96
exploration ratio at a steady rate throughout the night (Figure S1I). By the end of the night, a 97
bat visited an average of 86±48 cacti, out of which, 28±26 (~33%) cacti were part of its core 98
cacti (Mean±SD, Figure 2B-C, Figure S1J). This accounts for drinking ~18 ml of nectar per 99
night, approximately the amount required by a lactating female (see STAR Methods). 100
101
Information-based foraging
102
Bats clearly did not visit cacti in the field in a deterministic ordered sequence, as a trapline 103
strategy would suggest (see Figure S1K-L for more details). However, the bats also did not 104
visit the cacti at random. Indeed, video analysis revealed that cacti with more flowers were 105
visited significantly more often (Spearman correlation test, r=0.40, P=0.02, n=33 cacti, 106
Figure S1M), suggesting that some kind of a reinforcement mechanism underlies the bats’ 107
behavior. 108
In order to unravel the bats’ visitation strategy, we developed a mathematical model that 109
simulates a single night of foraging under competition in a space with multiple replenishing 110
food-sources, using a rule inspired by reinforcement learning [25]. In the simulations, bats 111
start without prior knowledge on cacti quality, and remember the value (‘nectar-weight’) and 112
positions of the ten best cacti they experienced (see Figure S1J). At each visit, the bat updates 113
the nectar-weight of the cactus depending on the cactus’ nectar yield as experienced by the 114
bat in previous visits and according to a learning rate a. Then the bat samples its next visit 115
from the set of cacti that includes the ten remembered best cacti and the other cacti around it 116
(STAR Methods). The probability to pick a cactus in this set is proportional to its nectar-117
weight, i.e., to the amount of nectar it provides, and inverse-proportional to its distance from 118
the current location of the bat. 119
Importantly, we did not fit the data in order to find the learning-rate ⍺. We ran evolutionary 120
simulations, in which multiple bats with different individual learning-rates competed with 121
each other. Bats that accumulated more nectar had higher chances to reproduce; and the 122
learning-rates in each generation were slightly mutated. After many generations, the 123
simulated bats converged to a learning-rate of 4.6, see STAR Methods. The simulated bats 124
with this ⍺ behaved very similarly to the real bats (compare the red and black lines in Figure 125
2B-F). 126
Similar to the real bats, the simulated bats showed a strong preference for specific core cacti, 127
but they also continued exploring other cacti (Figure 2B-C). The simulated bats increased the 128
exploitation to exploration ratio in a similar rate as the real bats and they showed a similar 129
preference for cacti with more flowers (Figures S1I and S1M, respectively). The simulated 130
bats hopped between cacti with a similar distance distribution as the real bats (Figure 2E), 131
and they revisited cacti after similar time-intervals (Figure 2F). Our model was also able to 132
predict the nectar consumption per visit of the actual bats, as we observed in the video 133
(Figure S1N). All the above suggests that our simple model, which assumes little memory 134
and a single free parameter can well-approximate the bats’ behavior. 135
We also compared our model to two other models. The first, had no learning and bats visited 136
the cacti uniformly at random. The second model, a version of a trapline-model, is similar to 137
our model, except that cacti at the core are visited in an ordered manner that minimizes the 138
distance to the next cactus (Figure 3A-E, and STAR Methods). Both of these alternative 139
models performed worse in terms of their fit to the actual data (Figure 3F), and were also 140
significantly less efficient in terms of nectar consumption (One-way ANOVA: F(2)=28.5, 141
P<0.001, Figure 3G). 142
We conclude that learning is a key feature of the bats’ behavior. Because bats rarely 143
encounter conspecifics at the cacti (see below), the main way in which a bat experiences 144
competition is through depletion of cacti. We thus hypothesized that learning is particularly 145
useful in the face of competition. To examine this, we ran another simulation comparing the 146
model, in which cacti are visited uniformly at random in each step, to our reinforcement 147
algorithm strategy, under two circumstances: (1) when the forager is alone in the field and (2) 148
when it forages with conspecifics - unlike the simulations above, here we tested a situation 149
where half of the bats use the first strategy (i.e., random) and the other half use the second 150
strategy (i.e., learning). In the case of a sole forager, a purely random model was as good as 151
the learning model (Permutation-based t-test: P=0.3, n=10,000 simulations). This 152
phenomenon was reversed in the case of many competing bats, where the simulated bats that 153
used reinforcement learning consumed 43% more nectar than the randomly-visiting bats 154
(17.2 ml vs 11.9 ml in the learning and random models respectively, Permutation-based t-155 test: P<0.0001, n=10,000). 156 157 158 159
Individual foraging cores with little overlap emerge from reinforcement learning
160
A prominent feature of our model is the formation of foraging cores with little overlap 161
between individuals (Figure 3H, we prefer the term “core” to “home range” [26] because 162
their important feature is the set of cacti they are composed of and not their area). The 163
sharing of core cacti by multiple bats in our simulations was significantly lower than 164
expected if the bats randomly visited the cacti (see STAR Methods, Permutation-based t-test: 165
P=0.0001, n=10,000 simulations). Data suggests that in reality bats also form disjoint cores 166
with little overlap - video analysis revealed an estimated overlap of 1.3 bats per cactus, while 167
in the simulations it was 1.5 bats per cactus, (Figure S2A-B). 168
Importantly, foraging cores are unlikely to be a result of territorial behavior: bats’ core cacti 169
spread over 0.04 km2, an area far too large for a bat to defend - flying from one side to the
170
other would require ~40 seconds while a visit of a conspecific to one of the bat’s cacti 171
requires less than a second (Video S1). Moreover, the range from which a bat could detect a 172
conspecific based on its echolocation is limited [27], and visual detection range is even more 173
limited, reaching only ~50 m [27,28]. 174
To further understand the potential impact of interference competition, we added to the 175
simulation a component of aggressive defense where a bat deters conspecifics it encounters at 176
its core cacti (Figure 3A-E, blue lines, see STAR Methods). Consistent with our hypothesis 177
that core formation is not a result of territorial defense, this aggressive model did not differ 178
from the previous non-aggressive model. 179
Moreover, the formation of foraging cores was also not a result of the limited memory of the 180
simulated bats (10 remembered cacti). We ran the model with unlimited memory where the 181
bats remember the positions and weights of all cacti in the field, and the same type of core 182
cacti evolved (Figure S2C-F). In fact, what appears to determine the size of a foraging core is 183
the learning rate ⍺, where a larger ⍺ generates smaller cores (Figure S2G-J). This is intuitive 184
as a larger ⍺ drives more exploitation of previous profitable cacti at the expense of exploring 185
new cacti. 186
The little overlap between neighboring cores in the simulation appears to result from a 187
combination of two factors. First, bats initially visit cacti randomly, and then a positive 188
feedback effect enhances the profitable initial discoveries through reinforcement learning. 189
Second, the nectar-weights of profitable cacti are reinforced accumulatively, increasing their 190
weight in the eyes of the owner bat and, at the same time, decreasing their nectar-weights in 191
the eyes of occasional visitors that are likely to find the cacti empty. When this reinforcement 192
learning strategy is employed in parallel by many bats, it enables the partitioning of the 193
resources in the field without active communication and reduces the number of conflicts. 194
Indeed, very few social agonistics interactions were observed - only in 5% of the 1123 visits 195
documented on video. 196
The efficiency of core formation
197
Despite its simplicity, the proposed reinforcement learning strategy results in highly efficient 198
foraging: as a group, the simulated bats consumed 91% of the total amount of nectar that was 199
accumulated in the field during the night (14.9±0.8 ml per bat). This means, in particular, that 200
any other foraging algorithm could not improve nectar consumption by more than 10% on
201
average. 202
In principle, one might expect that a more sophisticated (non-realistic) algorithm, that, e.g., 203
maintains a complete memory of the qualities of all cacti and visits them accordingly, would 204
perform significantly better than one that only selects a small subset of core-cacti. However, 205
an analytic analysis of a simplified model suggests that this intuition is wrong (see [29]). We 206
mathematically analyzed a simplified setting in which a (single) bat aims to exploit a set of n 207
cacti with different refill rates (ri is the rate of the i'th cactus). Competition is modeled as
208
uncertainty, i.e., a cactus i is emptied at each round with some “depleting probability” 0<si
<1. Furthermore, distances between cacti are neglected, and in each round a new cactus can 210
be visited. We restrict attention to purely-stochastic strategies that are characterized by a 211
probability vector p = (p1, ..., pn), determining the probability pi that the bat visits cactus i in
212
each round. We prove analytically that when cacti are visited often by other bats (modeled by 213
higher depleting probabilities) a purely-stochastic strategy based on exploiting a relatively 214
small core will be almost as good as the best strategy. In our simulations, smaller cores can 215
be achieved by increasing α. Indeed, the reinforcement learning literature shows that α can be 216
tuned by an animal, based on the environment [30]. 217
Another interesting result of our analytical analysis (mentioned above) is that the cacti bats 218
should choose for the core are those that have higher refill rates ri relative to low depletion
219
probabilities si. In the analytical model, those cacti with higher ri/si ratios are expected to
220
accumulate larger amounts of nectar. This nicely corresponds to the reinforcement learning 221
algorithm in our simulations, that assigns a large weight to a cactus that contains much nectar 222
upon our bat’s visit. 223
Conclusions
224
Foraging is a fundamental task which entails many decisions. In this study, we used 225
comprehensive continuous tracking of lesser long-nosed bats in parallel to estimating their 226
available resource to study their foraging decisions as they explore and exploit food resources 227
in their natural environment. Interestingly, a single parameter model based on reinforcement 228
learning was able to closely reproduce the bats’ behavior. 229
This model has three main characteristics: 1. The emergence of individuals foraging cores 230
through reinforcement learning and competition. 2. Exploitation of the cores through 231
stochastic sampling that is dependent on the cacti quality and distances. 3. Exploration of the 232
field in search of new profitable cacti and update of the core accordingly, in parallel to 233
exploitation. 234
Another foraging strategy that is adopted by many species including insects and birds is 235
trapline [31]. In our system, however, we do not see evidence for trapline. In principle, the 236
bats could have used a reinforcement-learning component to identify a core with high quality 237
cacti and then exploit the core using a trapline. However, as we show, it turns out that this 238
combined strategy is inferior to the reinforcement-learning strategy (Figure 3G). Perhaps the 239
reason for this, is that distances between cacti in a core are small and their qualities still vary. 240
Hence, a strategy that specializes in minimizing traversal lengths such as trapline would be 241
less effective than the reinforcement-learning strategy that effectively incorporates both 242
qualities and distances despite being memoryless. 243
Due to the simplicity and effectiveness of the reinforcement-based strategy, we hypothesize 244
that other species facing similar foraging tasks also adopt a similar strategy. A key 245
characteristic of which would be dividing the resources between individuals without direct 246
communication and without a need for aggressive territoriality. 247
248
Acknowledgments
249
We thank all members of El Pinacate and Gran Desierto de Altar Biosphere Reserve for their 250
generous hospitality, guidance and help. We thank Rodrigo Medellin’s lab members for 251
logistics coordination, and Tamir Reuveni, Ruty Goldshtein, Denise Chazan, Isabelle Kains, 252
Tomer Halevi and Duaa Anabosi for helping processed the data. We thank Jonathan Chazan 253
for field assistance, Israel Goldshtein for Engineering support and Bosmat issahary for 254
graphic assistance. We thank Ofer Feinerman, Ehud Fonio, Inon Scharf and Eran Amihai for 255
reading and commenting on the manuscript. Funding: This research was partially supported 256
by Lev-Zion Scholarship for Outstanding Ph.D. Students from Peripheral Areas, The 257
Minerva Center for Movement Ecology, the Mexican Agency for International Development 258
Cooperation (AMEXCID) and the European Research Council (ERC) under the European 259
Union's Horizon 2020 research and innovation program (grant agreement No 648032). The 260
work of Y.E was supported in part by an Israeli Science Foundation grant number 1016/17. 261
Author Contributions
262
A.G., Y.Y. and R.A.M., designed the experiments; A.G., M.H., O.E., A.B., T.S., S.C., S.G. 263
and Y.Y. conducted the experiment; A.G. conducted the analysis, carried out drone imaging 264
and analysis. A.K., S.C., Y.Y. and A.G. designed the model and A.G. implemented the 265
model. A.K and Y.E conducted the analytic analysis of the simplified model. A.G, Y.Y. and 266
A.K. wrote the manuscript. 267
Declaration of Interests
268
The authors declare no competing interests. 269
Figure Legends
270
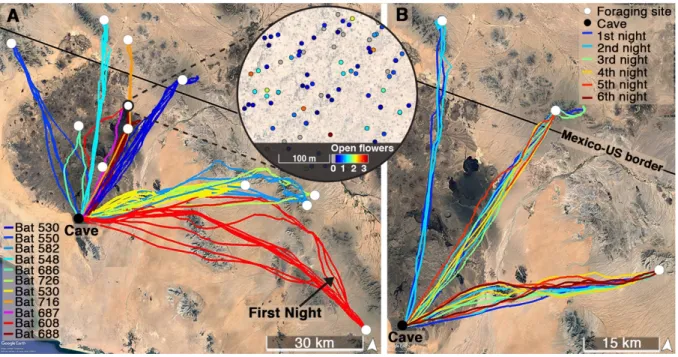
Figure 1. Typical movement of lactating nectar-feeding bats. (A) Bats fly tens of
271
kilometers from the cave to their foraging site (colors represent different individuals, n=11 272
bats for which we had at least one full night). The bat that flew farthest (red) flew a one-way 273
distance of ~104 km on her first night (depicted by a black arrow) to her foraging site (white 274
circle). The zoomed in circle panel shows how the cacti quality - the number of open flowers 275
- differ greatly within one of the Saguaro fields, with 0-4 open flowers on an average night (0 276
flowers are presented as grey circles and 1-4 flowers are presented as blue to red circles). See 277
also Figure S1. (B) Bats typically visited the same Saguaro field on consecutive nights 278
(colors from blue to red depict different nights for each bat, three bats with a mean of 4.3±2.0 279
nights per bat are shown). When returning to the same site, the bats visited ~75% of the cacti 280
that they visited on the previous night (n=8 bats, see also STAR Methods and Table S1). 281
Figure 2. Nectar-feeding bats foraging dynamics. (A) Flight trajectory of one bat is shown
cacti are not presented). Top left insert shows hops between cacti, where the width of the 284
black lines represents the number of hops between cacti and colored circles represent only the 285
core cacti that were visited more than 5 times at different hours throghout the night. In all 286
panels B-F colors are as follows: grey - real bats data; black - Mean±SE of 8 real bats; red - 287
Mean±SE of 45 simulated bats (30 simulations). (B) The accumulated number of visited cacti 288
and (C) core cacti throughout the night (see also Figure S1J). (D) The proportion of visits per 289
cactus are sorted according to cactus ID, i.e., cactus 1 is the cactus that received most visits. 290
(E) The distribution of distances between consecutive visited cacti. (F) The distribution of 291
time lags between revisits to the same cactus. Core cacti were close to each other (25.1±13.6 292
m apart) and bats revisited them very often (consecutive visits to core cacti were on average 293
8.9±3.5 minutes apart, Figure 2E-F). 294
Figure 3. Comparison of different models. (A-E) Foraging behavior of real bats (black),
295
and simulated bats using different foraging models: reinforcement learning (red), 296
reinforcement learning with aggression (blue), trapline (yellow) and random (purple). (A) 297
Accumulated number of visited cacti and (B) core cacti (first 2.5 hours). (C) Sorted 298
proportion of visits per cactus (in the 20 most visited cacti). (D) The distribution of distances 299
between consecutive visited cacti (30 meters bins). (E) The distribution of time lags between 300
revisits to the same cactus (first 20 minutes). (F) The fit of different foraging models 301
(normalized mean distance from real data, data was normalized to a max of 1 before fitting). 302
(G) Bats’ nectar consumption in different foraging models. (H) Core cacti of five simulated 303
bats in the reinforcement learning model. Cacti of different individuals are depicted by 304
different colors and circle size represents the number of visits (accumulated over a full night). 305
Cacti that were in the core of more than one bat appear in multiple colors according to the 306
relative number of visits of each bat; and cacti that were in the core of a single bat are circled 307
by a black line. See also Figure S2. 308
309
STARMethods
310
Lead Contact
311
Further information and requests for resources should be directed to and will be fulfilled by 312
the Lead Contact, Yossi Yovel (yossiyovel@gmail.com). 313
Materials Availability
314
This study did not generate new unique reagents. 315
Data and Code Availability
316
The datasets and code generated during this study are available at Mendeley, doi: 317
10.17632/jxghjjsttw.1 318
EXPERIMENTAL MODEL AND SUBJECT DETAILS
319
All experiments were conducted under permit number 443 # 04019/15, 03946/15 14509/16 320
from the Dirección General de Vida Silvestre (=Wildlife Service). All experiments on L. 321
yerbabuenae and C. gigantea has been conducted in El Pinacate Biosphere Reserve and in
322
the surrounding Saguaro fields (in the Sonoran Desert in northwest Mexico). 323
METHOD DETAILS
324
Tracking bats’ movement
325
During May-June 2015-2017, we successfully monitored the movement of a total of 17 326
lactating female lesser long-nosed bats (Leptonycteris yerbabuenae). We used miniature GPS 327
data-loggers (Lucid Ltd., Israel) combined with a synchronized ultrasonic microphone (FG-328
23329, Knowles) [27] to tag bats roosting in a maternity colony with more than 50,000 329
lactating bats in El Pinacate Mexico [32]. A telemetry unit (either LB-2X 0.3 g, Holohil 330
Systems Ltd. Carp, Ontario, Canada or Pico pip Ag379 0.37 g, Biotrack Ltd, Dorset, UK) 331
was attached to the GPS, to enable its recovery after falling off the bat. Tracking bats’ 332
movement for up to eight days in a row revealed fundamental aspects of their foraging 333
strategy. 334
The device’s total weight was 4.1±0.1g (mean±SD), which accounted for less than 14% of 335
the average body mass of the bats (the average mass of the bats was: 30.0±2.7g, n=17). We 336
have already mounted these tags on similar sized bats (e.g., Rhinopoma microphyllum, 337
Myotis vivesi and Myotis myotis) for which we performed several control experiments to test
338
the effect of the extra loading on their well-being and behavior (see detailed information in 339
Cvikel et al. [27] and Egert-Berg et al. [33]). Here too, we made sure that this additional 340
weight did not affect foraging: all tagged bats left the cave and flew to remote foraging sites, 341
sometimes as far as ~100 km from their roost where they exhibited vast foraging. We also 342
conducted several control experiments ensuring that flight and foraging abilities of the bats 343
were maintained. To test bats’ ability to forage, we captured three non-lactating females, 344
mounted the same GPS tags on their backs, and recorded their behavior while feeding on 345
flowers on a cut Saguaro branch placed inside a flight tent. All bats were able to approach the 346
flowers, hover in front of them and drink (See Video S2). Bats were allowed to feed ad-lib 347
and were released in good condition at the cave at the end of the experiment. To test the 348
effect of the additional weight on the overall flight duration, we tagged 10 bats with 349
lightweight (1g) telemetry unit (without GPS). The bats that were tagged with heavier GPS 350
devices spent a similar amount of time outside the cave (6.3±1.4 hours, n=9) as the bats that 351
were tagged with light tags (5.9±1.3 hours, n=10, Wilcoxon rank sum test, P=0.84). 352
Additionally, one bat that we tagged and was caught a week later (at the same time of the 353
night), was found in a very good condition and gained 1.3g during this period when it carried 354
the extra tag-weight. 355
Movement analysis
GPS positions were sampled every 2, 5, 15 or 30 seconds for different bats (Table S1 357
summarizes which bats were used in which of the analyses). GPS positioning standard 358
deviation was estimated to be 8 m in the horizontal plane and 11 m in height [27]. Bats’ 359
ground speed was estimated as the derivative of distance over time between GPS points that 360
were 15s apart, and outliers with ground speed above 30 m/s were removed. Bats’ airspeed 361
was calculated by subtracting the estimated wind speed in the direction of the flight from the 362
bat’s ground speed. Wind data was collected from a weather station located between the cave 363
and the foraging sites (31.679985, -113.304831). The bats’ height above the surface was 364
estimated by subtracting the geoid and the elevation above the surface from the altitude 365
above the ellipsoid (provided by the GPS). The geoid height was estimated to an accuracy of 366
0.001 m using the EGM2008 Geopotential Model and surface elevation was extracted using 367
Google Maps Elevation API. The height over-time was smoothed using the ‘LOESS’ local 368
regression smoothing filter [34]. Bats’ movement was divided to commute and foraging using 369
the straightness index that measures the ratio between the actual path length and the direct 370
distance between two points [35]. The straightness index was calculated for segments of five 371
minutes and revealed a bimodal distribution with a trough at 0.4 separating the two modes. 372
hence, GPS positions with a straightness index lower than 0.4 were considered as foraging 373
and GPS positions with straightness index greater than 0.4 were considered as commute 374
(Figure S2K-L). Short flights inside the foraging sites were considered as foraging even if 375
their straightness index was higher than the threshold (0.4). 376
Foraging behavior analysis
377
Some of the bats briefly visited secondary foraging sites on the way to the main one 378
(spending no more than 10 minutes in these sites). We restrict our analyses to foraging in the 379
main site. 380
A visit. A visit to a cactus was defined as flying at a distance of less than 15 meters from a 381
cactus, in an altitude of less than 20 meters. The video analysis revealed that bats typically 382
lingered in the area of a cactus for a few seconds before visiting it which made GPS-based 383
visit recognition easier. We also validated our visit detection method using the video 384
recordings (See Video S1 and Figure S2M). Notably, all of our analyses are based on the 385
proportions of visits and not the absolute number of visits, so even if our method for 386
detecting visits under- or over-estimated their number, this should not have affected our 387
results. 388
Consecutive visits to the same cactus less than 60 seconds apart were considered as one visit 389
since the video recordings (below) showed that bats tend to fly around the cacti and approach 390
it repeatedly during a visit. In cases where a bat visited a patch with several cacti less than 15 391
m apart, one of the cacti in the patch was chosen randomly and considered as the visited 392
cactus. For every visited cactus, number of visits, visits duration, distance and time past 393
between consecutive visits were calculated. 394
We examined the influence of the lower GPS sampling rates on the results, by reducing the 395
sample rate of bats that were sampled every two seconds to five, 15 and 30 seconds. We 396
found no difference between the bats’ behavior using sample rates of every two and five 397
seconds, and corrected the results for only three bats that were sampled at a lower rate (one 398
bat that was sampled every 30 seconds and two bats that were sampled every 15 seconds). 399
The definition of core cacti. Cacti that were visited more than five times during the night by 400
a specific bat were defined as the bat’s core cacti. We used a criterion of five revisits to the 401
same cactus because the distribution of revisits drops rapidly above five visits (Figure S1G-402
H). 403
Cacti locations and number of open flowers
Several approaches were used to assess cactus and flower distribution: (1) cacti locations in 405
specific areas where the tagged bats foraged were identified using (a) drone-imaging (using a 406
DJI Phantom 3 advanced drone with its built-in camera 12.4M pixel, DJI Science and 407
Technology Co. Ltd., Guangdong, China); (b) Google Earth satellite and aerial images (in 408
cases where flying a drone in the area was prohibited). In total, we managed to map the cacti 409
in the foraging sites of eight bats. (2) The flowering of 414 cacti from three cacti fields 410
around El Pinacate biosphere reserve were characterized: 327 cacti (121 flowering cacti) in 411
an area of ~84 m2 were monitored over 8.3±2.8 days per cactus (22/5/2016-7/6/2016) by
412
remote-imaging using the same drone and camera as above. The drone was flown above the 413
field early in the morning when the flowers are still open. A 3D model of the field was 414
created using Pix4Dmapper Pro version 2.2.25 allowing to count the number of open flowers. 415
Additional cacti were monitored every morning in a manual census during 10.7±3.4 days per 416
cactus (26/5/2015-11/6/2015 n=48 cacti, 6/5/2016-28/5/2016 n=23 cacti, 25/4/2017-2/5/2017 417
n=6 cacti, 13/5/2017-27/5/2017 n=10 cacti). 418
Video observations
419
33 saguaro cacti were videoed for an average of 1.8±1.2 nights (n=62 nights in total) during 420
the flowering season (11/5-1/6/2016, 12/5-18/6/2017) using IR video cameras (Full Spectrum 421
POV Cam, GhostStop, Florida, USA or Panasonic Action Cam HX-A1, H.264 1920x1080, 422
30fps). Each camera was placed on a two m pole at a distance of two m from the cactus for a 423
period of nine hours (starting at sunset). Bats’ echolocation and social calls were recorded in 424
45% of these observations using Ultrasonic recorders (Song meters SM4BAT, Wildlife 425
Acoustics Inc., Massachusetts, USA) that were placed <50 cm below the flowers. In cases 426
where the cactus had more than one branch with flowers, we used a separate camera for each 427
branch, so that all approaching bats to all of the cactus flowers could be observed. The videos 428
were fully analyzed and all visits of all pollinators (bats, moths and birds) were denoted. 429
Social interactions between conspecifics were also noted (based on the video or based on the 430
detection of social calls in the audio recordings). 431
Nectar refill rate and nectar consumption
432
To estimate the nectar refilling rate throughout the night, the upper part of eight cacti were 433
covered with mesh (20D nylon tulle) to prevent access to their flowers. During two 434
consecutive nights (20-21/5/2017), nectar was extracted from the flowers every 90 minutes 435
(from 21:00 at least until 03:00, during the bats’ presence in the field) using a 1 ml syringe, 436
and the amount of nectar was measured (n=17 flowers, 1.4+0.8 flowers per cactus per night). 437
Sugar concentration was measured using Bellingham-Stanleylow-volume Eclipse 438
refractometers (0–50 Brix). We found little variation in sugar concentration (24.5±2.7%), in 439
nectar rate and in the accumulative nectar quantity (0.73±0.13 ml) at the end of the night, and 440
no correlation between the accumulative nectar quantity at the end of the night and the 441
number of open flowers (Pearson correlation test: r=0.1, P=0.6). The amount of nectar in a 442
flower (ml) can thus be predicted according to the time passed since 21:00 (~1.5 hours post-443
sunset) using a linear equation: 0.13 + 0.102 × time (hours), R2=0.89, P<0.001, n=40 flowers
444
(Figure S1A). To assure that repeated nectar depletion does not affect nectar secretion, we 445
conducted another experiment where we measured the nectar quantity throughout the night in 446
different flowers (each flower was depleted and measured only once). When comparing the 447
two experiments, with and without repeated depletion, we found that nectar secretion rate 448
throughout the night is not affected by repeated nectar depletion (Generalized linear mixed-449
effects model: P=0.381, n=202 flowers that were measured once, 20 flowers that were 450
repeatedly depleted throughout the night, and depletion status as fixed effect). 451
To examine how much nectar a bat drinks in a visit, five bats were released in a flight tent for 452
four nights (21:00-03:00), and video-recorded while feeding ad libitum on 25% sugar water 453
from 1-ml tubes which were placed inside 10 Saguaro flowers that were mounted on the top 454
of two 20 liter water bottles (mimicking the cylinder structure of a Saguaro cactus). After 455
every feeding event, the amount of nectar was measured, and the tube was refilled. Drinking 456
duration of each drinking event was measured from the tube. We found that drinking amount 457
per feeding event could be predicted by the feeding duration, according to a linear equation: 458
nectar feeding amount (ml)=0.052 + 0.44 × feeding duration (s) R2=0.36, P<0.001, n=187,
459
Figure S2N-O). Based on this equation, we concluded that a bat in the field drinks 0.04±0.04 460
ml (mean±SD, n=2492 observations) in an average visit. 461
Estimating the bats’ energy consumption
462
In order to examine whether the nectar consumed by our bats is enough to cover their 463
energetic demands, we used literature estimates of their energetics. According to Horner et al. 464
[36], a 23g non-reproductive lesser long-nosed bat spends 1.05, 0.97, 0.32 Watts during 465
commute, foraging and day roosting, respectively. Converting these values to kJ according to 466
the average duration our bats spent in each activity (commuting for 3.1±1.2 hours, foraging 467
for 2.2±1.0 hours and day roosting for 18.7±1.5 hours, n=11) results in a mean energy 468
demand of 40.9 kJ per day. Kunz & Nagy [37] estimated the energy consumption of lactating 469
bats as 50-100% higher than non-reproductive individuals, hence we estimate the energy 470
consumption of a lactating lesser long-nosed bats as 61.4-81.8 kJ. Since 0.1 ml of Saguaro 471
nectar provides 0.43 kJ [36], lactating bats need to drink between ~14-19 ml of nectar and 472
non-reproductive bats need to drink ~9.5 ml of nectar per night. 473
Based on our GPS monitoring and video analysis, the lactating bats conducted ~450 feeding 474
visits on average throughout the night, drinking 0.04 ml on an average visit (according to our 475
video observation and nectar model, Figure S1N). That accumulates to drinking 18 ml of 476
nectar during a full night, nicely corresponding to the calculation above. 477
478
The foraging model
In order to unravel the bats’ visitation strategy, we developed a mathematical model that 480
simulates a single night of foraging under competition in a space with multiple replenishing 481
food-sources. At each step, each agent (bat) in our model decides which cactus to visit next 482
based on its previous experience and current location. To capture the fact that bats visited 483
profitable cacti more often (Figure S1M), we modeled this decision process using a rule 484
inspired by reinforcement learning [25], in which the agent learns to prefer rewarded stimuli. 485
In the simulation, each bat associates each cactus with two parameters: a ‘nectar-weight’ and 486
a ‘score’. The nectar-weight of a cactus depends on the cactus’ nectar yield as experienced by 487
the bat in previous visits, and the score of a cactus depends on both the nectar-weight and the 488
distance of the cactus from the current location of the bat. After every visit to a cactus, the bat 489
updates its nectar-weight (see below) and it then visits the next cactus with probability that is 490
proportional to its score. If higher nectar is found in a cactus, it will have more nectar-weight 491
and hence a higher score, which means that the probability of returning to it can only 492
increase. 493
In the simulations, the bats start without prior knowledge on cacti quality. At any point in 494
time, bats remember the nectar-weights and positions of only 10 cacti (we chose this number 495
because this is the number of cacti we observed in the core in time slots of 30 minutes (see 496
Figure S1J). Moreover, nectar feeding bats have been shown to have an immense spatial 497
working memory [24]). “In the eyes” of a bat, the nectar-weights of all other cacti are set to 498
1. Cacti scores are proportional to their nectar-weights and inversely proportional to their 499
distance, that is, the score Sb(c,t) that a bat ‘b’ associates with cactus ‘c’ at time ‘t’ is:
500
Eq 1. 𝑆!(𝑐, 𝑡) =("!($,&)
!($,&)) + ,
501
where Wb(c,t) is the nectar-weight that bat ‘b’ gives to cactus ‘c’ at time ‘t’ (see below),
502
Tb(c,t) is the duration of flight to cactus ‘c’ from the current location of bat ‘b’ (which is
503
proportional to the corresponding distance) and t is the time duration of a visit. 504
Similarly to the reinforcement learning framework [25], bats update nectar-weights at each 505
visit based on how much nectar they drank (relative to an average expectation). At time ‘t’, 506
the nectar-weight of the last visited cactus ‘c’ is updated: 507
Eq 2. 𝑊!(𝑐, 𝑡) = 𝑊!(𝑐, 𝑡 − 1) + [𝑁 − 𝐴𝑣𝑔] × 𝛼 , 508
where Wb(c,t) is the nectar-weight of cactus ‘c’ at time ‘t’ in the eyes of bat ‘b’, N is the
509
volume of nectar consumed during the visit, Avg is the average consumed volume (set to 510
0.04ml based on field observations) and a is a scaling parameter equivalent to the learning 511
rate in reinforcement learning. 512
The list of remembered cacti is updated as follows: if the nectar-weight of a visited cactus 513
exceeds the nectar-weight of at least one of the 10 remembered cacti, it will replace the 514
remembered cactus with the lowest score. In turn, the latter cactus will go out of the list and 515
its nectar-weight will be set to 1. In order to keep exploring, the bats can also visit 516
unremembered cacti (i.e., with nectar weights = 1) but since they do not remember the 517
location of these cacti, they will only visit unremembered cacti within their visual sensing 518
range [28,38]. 519
The fixed parameters of the model, namely, the numbers of bats and cacti (45 bats with a 520
ratio of 1 bat per 12 flowering cacti), cacti locations, flower distribution and nectar filling 521
rate, were all set based on our field measurements (see below). 522
The model thus has one free parameter, ⍺ - the learning rate. We used an evolutionary 523
algorithm [39] in order to predict the value of ⍺ (an evolutionary algorithm searches for a 524
solution that is at equilibrium under the modeled conditions). The value of ⍺ in our 525
evolutionary simulations converged to an average of 4.6, with all individuals converging to a 526
range around it (4.6±4.8 Mean±SD). Importantly, although we did not fit the data to the 527
model (⍺ was determined evolutionary) the simulated bats with this ⍺ behaved very similarly 528
to the real bats (compare the red and black lines in Figure 2B-F). 529
The Fix factors of the model A bat in our simulation arrives at a field with a fixed number of 530
cacti that are distributed over a plane according to an actual field whose cacti-positions have 531
been reconstructed. The simulated field has 1125 cacti and 45 bats. This agrees with our 532
observed bats-cacti ratio estimations: ~200,000 bats are estimated to roost in the El Pinacate 533
cave using annual bats counting and ~5,700,000 cacti were estimated to be in a radius of 100 534
km from the cave based on satellite imaging analysis, see sensitivity analysis for this parameter 535
in Figure S3A-F). Each cactus has a certain number of open flowers that are sampled from a 536
real distribution (Figure S1B) and it refills all of them in a constant rate according to our field 537
measurements (Figure S1A). 538
Initial nectar weight Bats start at random positions in the field (real bats can fly from one 539
side of the field to the other in ~40 seconds), without prior knowledge on cacti quality (all 540
cacti receive initial equal nectar-weights = 1). We chose the value of 1, since if we choose 541
any other positive constant instead of 1, say c, the system will behave the same by replacing 542
alpha with c times alpha. Since we are aiming to evolve and learn alpha, we will get the same 543
result, only named differently. At any point in time the bats remember the values (i.e., nectar-544
weights) and positions of only 10 cacti and can visit these remembered cacti and other cacti 545
within their vision detection range. Because a bat always sees additional cacti in its range it 546
will never hold in its memory a cactus with weight smaller than the default value (1), 547
therefore we don't have to worry about negative weights. 548
Remembered cacti The number 10 was chosen because on average, the bats visited 10 core 549
cacti at every moment throughout the night. We divided the night into time period of 30 min 550
and during this period real and simulated bats visited 9.6±0.5 (n=8) and 10.2±1.1 (n=45) core 551
cacti, respectively. Figure S1J). We also show that there is no advantage in remember more 552
than 10 cacti, since even bats that remembering all cacti in the field perform very similar to 553
bats that remember only 10 cacti (Figure S2C-F). 554
Bats’ detection range In the simulation, we assumed that the bats’ detection range of a cactus 555
is 50 meters. There is very little behavioral data on bats’ vision. In a previous study we found 556
that the night vision of Rousettus aegyptiacus is similar to humans’ [38]. Lesser long-nosed 557
bats have smaller eyes (ca. 0.23 diameter of those of Rousettus aegyptiacus) and should thus 558
be less sensitive. To estimate their visual detection range of a cactus, we first estimated 559
humans’ detection range and we used this as an over estimation for the bats’ detection range. 560
Four humans (adjusted to scotopic vision) were able to detect cacti (n=10) from a distance of 561
55±9 m. To estimate this, we had them move towards a cactus from a distance of 100 m and 562
report when they first detected it. On the one hand, as explained above, the bats are less 563
sensitive, but on the other hand, their task should have been easier since they observe the 564
cacti from above (unlike the humans) and can search for white flowers. We thus estimated 565
the bats’ detection range to be within a range of 30-70 m. To validate that our results are not 566
sensitive to an error of up to 40% in this parameter, we ran our model with cacti detection 567
range of 30, 50 and 70 meters (Figure S3G-J). 568
Maintaining core cacti on consecutive nights Notably, our model assumes that bats are 569
naïve at the beginning of the night, while in reality bats’ foraging cores on consecutive nights 570
heavily overlap (on a certain night, bats visited ~97% of the core cacti that they visited on 571
previous nights, Figure S3K). This suggests that bats incorporate information gathered on 572
previous nights when forming their foraging core on a given night. Relying on information 573
over consecutive nights probably reduces the costs of finding and mapping the positions of 574
flowering cacti. We also observed that bats reused the same flying pathway between cacti on 575
consecutive nights (Figure S3L), a strategy which could ease navigation in the field. One of 576
the bats that we tracked switched the field it visited while we were tracking it, allowing us to 577
examine its movements in a new field over time. In contrast to all other bats we tracked, in its 578
first nights in the field, this bat spent more time scanning the field and less time foraging, in 579
comparison to the other bats. Over several consecutive nights, it gradually increased the 580
proportion of foraging (Figure S3M). In order to account for this knowledge, we allowed our 581
simulated bats to scan quickly for a short period at the beginning of the night. Thus, at the 582
beginning of the night, our simulated bats explored cacti with a detection range of 250 m. 583
This exploration phase lasts ~10 minutes, until each bat acquires 10 remembered cacti. 584
Despite the fact that we neglect this issue of information transfer across nights, our 585
approximated model well captures the general characteristics of bat foraging dynamics. 586
Learning rate (⍺) We used an evolutionary algorithm (using Matlab’s Global Optimization 587
Toolbox) in order to predict the value of ⍺. We ran 30 simulations with 100 generations each 588
and took the average ⍺. We used a population size of 45 bats, with initial values of ⍺ that are 589
randomly distributed between 0 and 100. At each generation, 20% of the bats best fitted ⍺ 590
(i.e., bats) survived, out of the rest remaining 80%, 62% randomly survived and 18% were 591
crossed with mutation. The values of ⍺ always converged within 100 simulations. Nectar 592
consumption was used to estimate fitness. 593
Modeling aggressive response A similar model with an aggressive response (aggressive 594
model) provided us the ability to estimate whether social interactions play a role in shaping the 595
foraging behavior of the bats. In this model, simulated bats foraged in the same manner as in 596
the non-aggressive model, except for when two bats simultaneously chose the same cactus. In 597
this case the dominant bat (the bat that has a higher nectar-weight for this cactus) drank from 598
the cactus, and the subordinate bat drinks nothing and is moved near a random cactus 200-500 599
m from its current location mimicking the result of a territorial agonistic interaction. 600
Alternative models We compared the real bats’ behavior to two additional models (random and 601
trapline) using the same fixed parameters as in the reinforcement learning model, except for 602
the following changes: In the random model ⍺=0, and thus the bats did not learn from previous 603
experience. In the trapline model, bats used reinforcement learning during ~10 minutes at the 604
beginning of each simulation to acquire the first 10 remembered cacti (with ⍺=6.1 that was 605
found using a genetic algorithm). Once the remembered set was established, the simulated bats 606
exploited the core in an ordered manner – always flying to the next closest cactus (as in a 607
trapline). They still occasionally explored additional cacti (according to the same rules of the 608
original model). Finally, we also ran the exact same foraging model with a single bat (and 125 609
cacti) to compare the nectar consumption of a learning (⍺=4.6) and a random (⍺=0) simulated 610
bat. 611
Estimating the overlap of cores We used the results of 100 simulations to compute how 612
many bats shared each of the core cacti. For each simulation, we collected the core cacti of all 613
bats into one set S, and then randomly selected a core for each bat, while maintaining the 614
number of core cacti per bat the same as in the specific simulation. That is, if a bat had x cacti 615
in its core in the simulation, we now randomly select x cacti in S to be in its random core. We 616
used a permutation test to compare the overlap in a typical core cactus in these two situations. 617
QUANTIFICATION AND STATISTICAL ANALYSIS
618
All statistical analysis conducted using MATLAB R2018a unless stated otherwise. 619
Comparison between groups were conducted using two tailed tests, unless stated otherwise. 620
Non-parametric Wilcoxon rank sum tests were used to examine the influence of the GPS 621
weight on the time bats spent outside the cave because of the small sample size. One-Way 622
ANOVA was used to compare bats’ nectar consumption in different foraging models and all 623
other comparisons between models were conducted using Permutation based t-test, to avoid 624
influencing the power of our analysis by changing the sample size (i.e., the number of 625
simulations). We used Linear regression to find the equation of nectar secretion throughout 626
the night and nectar feeding quantity according to feeding duration, and GLM test used to 627
estimate the influence of depletion status (as a fixed factor) on nectar secretion rate 628
throughout the night. Monte-Carlo test conducted using R 3.6.1, ade4 package. 629
Supplemental videos legends
630
Video S1. Bats foraging behavior. Related to STAR Methods. Bats typically lingered in the
631
area of a cactus for a few seconds: they fly near the cactus, approach it, approach a specific 632
flower and drink from it. Most foraging behavior is solitary, and social interactions are seldom. 633
Video S2. GPS weight control. Related to STAR Methods. Bats successfully maneuver and
634
feed on Saguaro’s flowers in a flight tent – a comparison of feeding behavior of a bat with and 635
without GPS device attached to its back. Related to Tracking bats’ movement in STAR 636
Methods. 637
References
639
1. Howell, D.J. (1974). Acoustic behavior and feeding in glossophagine bats. J. Mammal. 640
55, 293–308.
641
2. Herrera M., L.G., and Martínez Del Río, C. (1998). Pollen digestion by New World 642
bats: effects of processing time and feeding habits. Ecology 79, 2828–2838. 643
3. Arends, A., Bonaccorso, F.J., and Genoud, M. (1995). Basal Rates of Metabolism of 644
Nectarivorous Bats (Phyllostomidae) from a Semiarid Thorn Forest in Venezuela. J. 645
Mammal. 76, 947–956. 646
4. Sahley, C.T., Horner, M.A., and Fleming, T.H. (1993). Flight speeds and mechanical 647
power outputs of the nectar-feedint bat, Leptonycteris curasoae (phyllostomidae: 648
glossophaginae). J. Mammal. 74, 594–600. 649
5. Medellin, R.A., Rivero, M., Ibarra, A., Torre, J.A. de la, Gonzalez-Terrazas, T.P., 650
Torres-Knoop, L., and Tschapka, M. (2018). Follow me: foraging distances of 651
Leptonycteris yerbabuenae (Chiroptera: Phyllostomidae) in Sonora determined by 652
fluorescent powder. J. Mammal. 99, 306–311. 653
6. Zimmerman, M. (1979). Optimal foraging: A case for random movement. Oecologia 654
43, 261–267.
655
7. Giuggioli, L., Potts, J.R., and Harris, S. (2011). Animal interactions and the emergence 656
of territoriality. PLoS Comput. Biol. 7. 657
8. Stiles, F.G. (1971). Time, energy, and territoriality of the Anna Hummingbird (Calypte 658
anna). Science (80-. ). 173, 818–821. 659
9. Wolf, L.L. (1970). The impact of seasonal flowering on the biology of some tropical 660
hummingbirds. Condor 72, 1–14. 661
10. Feinsinger, P. (1976). Organization of a tropical guild of nectarivorous birds. Ecol. 662
Monogr. 46, 257–291. 663
11. Linhart, Y.B. (1973). Ecological and behavioral determinants of pollen dispersal in 664
hummingbird-pollinated Heliconia. Am. Nat. 107, 511–523. 665
12. Kadmon, R., and Shmida, A. (1992). Departure rules used by bees foraging for nectar: 666
A field test. Evol. Ecol. 6, 142–151. 667
13. Gill, F.B. (1988). Trapline foraging by hermit hummingbirds: competition for an 668
undefended, renewable resource. Ecology 69, 1933–1942. 669
14. Lihoreau, M., Raine, N.E., Reynolds, A.M., Stelzer, R.J., Lim, K.S., Smith, A.D., 670
Osborne, J.L., and Chittka, L. (2012). Radar tracking and motion-sensitive cameras on 671
flowers reveal the development of pollinator multi-destination routes over large spatial 672
scales. PLoS Biol. 10, 1001392. 673
15. Janzen, D.H. (1971). Euglossine bees as long-distance pollinators of tropical plants. 674
Science (80-. ). 171, 203–205. 675
16. Gilbert, L.E. (1975). Ecological consequences of a coevolved mutualism between 676
butterflies and plants. Coevol. Anim. plants, 210–240. 677
17. Janson, C.H., Terborgh, J., and Emmons, L.H. (1981). Non-flying mammals as 678
pollinating agents in the Amazonian forest. Biotropica, 1–6. 679
18. Garber, P.A. (1988). Foraging decisions during nectar feeding by tamarin monkeys 680
(Saguinus mystax and Saguinus fuscicollis, Callitrichidae, Primates) in Amazonian 681
Peru. Biotropica, 100–106. 682
19. Janson, C.H. (1998). Experimental evidence for spatial memory in foraging wild 683
capuchin monkeys, Cebus apella. Anim. Behav. 55, 1229–1243. 684
20. Watts, D.P. (1998). Long-term habitat use by mountain gorillas (Gorilla gorilla 685
beringei). 2. Reuse of foraging areas in relation to resource abundance, quality, and 686
depletion. Int. J. Primatol. 19, 681–702. 687
21. Lihoreau, M., Chittka, L., and Raine, N.E. (2011). Trade‐off between travel distance 688
and prioritization of high‐reward sites in traplining bumblebees. Funct. Ecol. 25, 689
1284–1292. 690
22. Thomson, J.D., Slatkin, M., and Thomson, B.A. (1997). Trapline foraging by bumble 691
bees: II. Definition and detection from sequence data. Behav. Ecol. 8, 199–210. 692
23. Schmidt, J.O., and Buchmann, S.L. (1986). Floral biology of the saguaro (Cereus 693
giganteus) - I. Pollen harvest by Apis mellifera. Oecologia 69, 491–498. 694
24. Winter, Y., and Stich, K.P. (2005). Foraging in a complex naturalistic environment: 695
Capacity of spatial working memory in flower bats. J. Exp. Biol. 208, 539–548. 696
25. Niv, Y., Joel, D., Meilijson, I., and Ruppin, E. (2002). Evolution of reinforcement 697
learning in uncertain environments: A simple explanation for complex foraging 698
behaviors. Adapt. Behav. 10, 5–24. 699
26. Börger, L., Dalziel, B.D., and Fryxell, J.M. (2008). Are there general mechanisms of 700
animal home range behaviour? A review and prospects for future research. Ecol. Lett. 701
11, 637–650.
702
27. Cvikel, N., Levin, E., Hurme, E., Borissov, I., Boonman, A., Amichai, E., and Yovel, 703
Y. (2015). On-board recordings reveal no jamming avoidance in wild bats. Proc. R. 704
Soc. B Biol. Sci. 282. 705
28. Danilovich, S., Krishnan, A., Lee, W.J., Borrisov, I., Eitan, O., Kosa, G., Moss, C.F., 706
and Yovel, Y. (2015). Bats regulate biosonar based on the availability of visual 707
information. Curr. Biol. 25, R1124–R1125. 708
29. Korman, A., Emek, Y., Collet, S., Goldshtein, A., and Yovel, Y. (2020). Exploitation 709
of multiple replenishing resources with uncertainty. http://arxiv.org/abs/2007.09640 710
30. Behrens, T.E.J., Woolrich, M.W., Walton, M.E., and Rushworth, M.F.S. (2007). 711
Learning the value of information in an uncertain world. Nat. Neurosci. 10, 1214– 712
1221. 713
31. Ohashi, K., and Thomson, J.D. (2009). Trapline foraging by pollinators: its ontogeny, 714
economics and possible consequences for plants. Ann. Bot. 103, 1365–1378. 715
32. Tellez, G., MedellÍn, R.A., Mora, C., and McCracken, G. (2000). Evidence of 716
migration of Leptonycteris curasoae in the Mexican tropics. Bat Res. News 41, 143. 717
33. Egert-Berg, K., Hurme, E.R., Greif, S., Goldstein, A., Harten, L., Herrera M., L.G., 718
Flores-Martínez, J.J., Valdés, A.T., Johnston, D.S., Eitan, O., et al. (2018). Resource 719
Ephemerality Drives Social Foraging in Bats. Curr. Biol. 28, 3667-3673.e5. 720
34. Hen, I., Sakov, A., Kafkafi, N., Golani, I., and Benjamini, Y. (2004). The dynamics of 721
spatial behavior: How can robust smoothing techniques help? J. Neurosci. Methods 722
133, 161–172.
723
35. Benhamou, S. (2004). How to reliably estimate the tortuosity of an animal’s path: 724
Straightness, sinuosity, or fractal dimension? J. Theor. Biol. 229, 209–220. 725
36. Horner, M.A., Fleming, T.H., and Sahley, C.T. (1998). Foraging behaviour and 726
energetics of a nectar-feeding bat, Leptonycteris curasoae (Chiroptera: 727
Phyllostomidae). J. Zool. 244, 575–586. 728
37. Kunz, T.H., and Nagy, K.A. (1988). Methods of energy budget analysis (Washington: 729
Johns Hopkins University Press). 730
38. Boonman, A., Bar-On, Y., Yovel, Y., and Cvikel, N. (2013). It’s not black or white— 731
on the range of vision and echolocation in echolocating bats. Front. Physiol. 4, 248. 732
39. Frenzel, J.F. (1993). Genetic algorithms. IEEE Potentials 12, 21–24. 733