Angewandte
International Edition
www.angewandte.org
Chemie
Accepted Article
Title: A Room-Temperature Formation Pathway for CdTeSe Alloy
Magic-Size Clusters
Authors: Hai Zhang, Chaoran Luan, Dong Gao, Meng Zhang,
Nelson Rowell, Maureen Willis, Meng Chen, Jianrong Zeng,
Hongsong Fan, Wen Huang, Xiaoqin Chen, and Kui Yu
This manuscript has been accepted after peer review and appears as an
Accepted Article online prior to editing, proofing, and formal publication
of the final Version of Record (VoR). This work is currently citable by
using the Digital Object Identifier (DOI) given below. The VoR will be
published online in Early View as soon as possible and may be different
to this Accepted Article as a result of editing. Readers should obtain
the VoR from the journal website shown below when it is published
to ensure accuracy of information. The authors are responsible for the
content of this Accepted Article.
To be cited as: Angew. Chem. Int. Ed. 10.1002/anie.202005643
Link to VoR: https://doi.org/10.1002/anie.202005643
A Room-Temperature Formation Pathway for CdTeSe Alloy
Magic-Size Clusters
Hai Zhang, Chaoran Luan, Dong Gao, Meng Zhang, Nelson Rowell, Maureen Willis, Meng Chen,
Jianrong Zeng, Hongsong Fan, Wen Huang, Xiaoqin Chen,* Kui Yu*
Abstract: Little is known about the pathway of room-temperature
formation of ternary CdTeSe magic-size clusters (MSCs) obtained via mixing binary CdTe and CdSe induction period samples containing binary precursor compounds (PCs) of MSCs, monomers (Ms), and fragments (Fs). Also, unestablished are dispersion effects that occur when as-mixed samples (without incubation) are placed in toluene (Tol) and octylamine (OTA) mixtures. The resulting ternary MSCs, exhibiting sharp optical absorption peaking at 399 nm, are labelled “CdTeSe MSC-399”, and their particular PCs are “CdTeSe PC-399”. It is shown that when the amount of the primary amine (OTA) was relatively small, single-ensemble MSC-399 evolved without binary CdTe or CdSe MSCs. When the OTA amount was relatively large, CdTe MSC-371 appeared initially and then disappeared, while single-ensemble MSC-399 developed more deliberately. The larger the OTA amount was, the more slowly these changes proceeded. The substitution reaction of CdTe PC + CdSe
M/F CdTeSe PC-399 + CdTe M/F is proposed to be rate-determining for the MSC-399 formation in a Tol and OTA mixture. The present study provides further understanding regarding the transformation pathway between MSCs.
Introduction
Semiconductor binary II-VI metal chalcogenide (ME) magic-size clusters (MSCs) in a single-ensemble form, which are present without the complication of the coexistence of corresponding binary ME quantum dots, have recently been synthesized at room temperature from induction period samples of the binary ME
quantum dots.[1-13] The induction period precedes the time when
quantum dots would have nucleated and grown, which is also called the pre-nucleation stage. In the two-pathway model
proposed for binary ME quantum dots and MSCs,[3,9]
semiconductor ME induction period samples are posited to contain particular precursor compounds (PCs) of ME MSCs, together with monomers (Ms) and fragments (Fs). And the mass of the former seems to be the largest (among the PC, M, and F); for II-VI ME, the respective composition of the latter two could be
literally assumed to be M2E2 and MnEn (with n > 2).[14] The PC to
MSC transformation (via intra-molecular reorganization) has been
demonstrated for CdTe MSC-371,[4-6] CdSe MSC-415,[1,7] CdS
MSC-311,[2,8-11] CdS MSC-322,[10,11] ZnSe MSC-299,[12] and ZnS
MSC-269.[13] The MSCs are denoted in reference to their optical
absorption peak positions in wavelength (nanometers). Also, small-size CdS quantum dots with enhanced particle yields have been synthesized using a CdS induction period sample via the
fragmentation of the CdS PC which had formed.[2] The advance in
the synthesis of quantum dots,[2] resulting in an in-depth
understanding of the induction period described by the
two-pathway model,[3,9] facilitates the control of size and particle yield
of quantum dots, and thus embraces the promise of colloidal
semiconductor quantum dots in various application areas.[15-20]
Furthermore, this two-pathway model reinforces the multi-step nucleation model which has been proposed for several other
material systems including organics,[21-23] polymers,[24-26]
inorganics,[27-31] and metals.[32-34]
Ternary semiconductor MSCs have received scant attention.
For reported ZnCdSe and CdTeSe MSCs,[35,36] their syntheses were
performed with corresponding metal and chalcogenide precursors placed together in reaction flasks. The resulting ZnCdSe and CdTeSe MSCs exhibit optical absorption with electronic transitions in the range of 300 to 350 nm for the former and at 464 and 520 nm for the latter. Recently, we reported a room-temperature approach to engineering alloy ternary CdTeSe MSCs in a single-ensemble form, without the coexistence of quantum dots and
binary MSCs.[1] Such alloy MSCs exhibit sharp optical absorption
peaking at 399 nm and are symbolized as CdTeSe MSC-399. The preparation of CdTeSe MSC-399 involved the mixing of binary [*] Hai Zhang, Chaoran Luan, Hongsong Fan, Xiaoqin Chen, Kui Yu
Engineering Research Center in Biomaterials, Sichuan University Chengdu, Sichuan, 610065, P. R. China
E-mail: [email protected] E-mail: [email protected] Dong Gao, Meng Zhang, Kui Yu Institute of Atomic and Molecular Physics
Sichuan University, Chengdu, Sichuan, 610065, P. R. China Nelson Rowell
Metrology Research Centre, National Research Council Canada, Ottawa, Ontario K1A 0R6, Canada
Maureen Willis
School of Physical Science and Technology, Sichuan University Chengdu, Sichuan, 610065, P. R. China
Meng Chen
School of Chemical Engineering, Sichuan University, Chengdu, Sichuan, 610065, P. R. China
Jianrong Zeng
Shanghai Synchrotron Radiation Facility, Shanghai Advanced Research Institute, Chinese Academy of Sciences, Shanghai, 201204, P. R. China
Jianrong Zeng
Shanghai Institute of Applied Physics, Chinese Academy of Sciences, Shanghai, 201800, P. R. China
Wen Huang
Laboratory of Ethnopharmacology, West China School of Medicine Chengdu, Sichuan, 610065, P. R. China
Wen Huang
West China Hospital, Sichuan University Chengdu, Sichuan, 610065, P. R. China Kui Yu
State Key Laboratory of Polymer Materials Engineering, Sichuan University
Chengdu, Sichuan, 610065, P. R. China
Accepted
Scheme 1. Schematic explanation for the room-temperature evolution
of CdTeSe MSC-399 from mixtures of binary CdTe and CdSe induction period samples. Steps 1/2 denote the equilibrium between CdTe PC-371 and CdTeSe PC-399. Steps 3/4 and Steps 5/6 symbolize the reversible transformations between CdTeSe PC-399 and CdTeSe MSC-399 and between CdTe PC-371 and CdTe MSC-371, respectively. Step 3 facilitates shifting the PC-371 and PC-399 equilibrium to the right, the forward direction of Eq. 1. The relative rates of Steps 1 versus 3
vary. When a mixture is incubated, CdTeSe MSC-399 evolves via Steps 1 and 3, with Step 3 being rate-determining. When an as-mixed sample is dispersed in a Tol and OTA mixture, Step 1 becomes rate-determining. The model proposed is in agreement with that proposed for the transformations among four types of CdTe MSCs, particularly in that the transformations involve MSC corresponding PCs.[6]
oleylamine (OLA) for 30 min during their respective induction period. The resulting mixture was incubated for a length of time (such as for 43 h) at room temperature, and CdTeSe MSC-399 evolved without the co-production of CdTe MSC-371 and CdSe MSC-415. The product identification was performed by optical absorption spectroscopy with a toluene (Tol) dispersion only.
We proposed that the evolution of CdTeSe MSC-399 does not follow the combination of CdTe MSC-371 and CdSe MSC-415, but results from a particular CdTeSe PC via an intra-molecular
transformation, CdTeSe PC → CdTeSe MSC-399.[1] This PC to MSC
transformation resembles that of those binary ME MSCs.[1-13] We
also proposed that CdTeSe PC-399 does not form by an addition reaction of CdTe PC-371 and CdSe PC-415 or by a partial anion exchange reactions (CdTe PC-371 + SeTOP (tri-n-octylphosphine selenide) and CdSe PC-415 + TeTOP (tri-n-octylphosphine telluride)); it evolves via the substitution reactions represented by Equations(Eqs) (1) and (2).[1] However, it has not been established which of the two possible substitution reactions (below) better describes the actual phenomena.
CdTe PC + CdSe M/F CdTeSe PC + CdTe M/F (1)
CdSe PC + CdTe M/F CdTeSe PC + CdSe M/F (2)
Here, we report progress towards a fundamental understanding of the formation pathway of CdTeSe PC-399 at room temperature. From the results of our experiments, we are led to the conclusion that only the formation pathway described by Eq 1 is active. Scheme 1 depicts our understanding of the formation process of CdTeSe PC-399; in the following discussion,
any reference to a specific step, such as Step 1, implicitly refers to
Scheme 1. It is possible that the relative rates of the CdTeSe
PC-399 formation (Step 1) and the CdTeSe PC-399 to CdTeSe
MSC-399 transformation (Step 3) vary. When a mixture made from
binary CdTe and CdSe induction period samples is incubated, the
formation of CdTeSe PC-399 (Step 1) occurs relatively rapidly.
However, when a mixed sample is dispersed in a Tol and octylamine (OTA) mixture, the CdTeSe PC-399 to CdTeSe MSC-399
transformation (Step 3) becomes faster. The present findings
introduce a new approach to synthesizing alloy MSCs at room temperature via mixing binary induction period samples, and enable further insight into the pathway for the room-temperature formation of CdTeSe MSC-399 with and without the complication of CdTe MSC-371. Also, the present study provides a more complete understanding of the evolution of MSCs and the
transformations among them.[4-7,10,11,35-50] Similar to the
fabrication of small-size CdS quantum dots with enhanced particle yield from a CdS induction period sample, the room-temperature synthesis of single-ensemble CdTeSe MSC-399 via mixing CdTe and CdSe induction period samples assists in the advance of
non-classical nucleation theory.[3,9,21-34]
Results and Discussion
For the present study, we used two binary induction period samples of CdE (E = Te and Se), which were prepared from two reactions of Cd(OAc)2/OLA and ETOP in OLA with a feed molar ratio of 4 to 1 and a feed E concentration of 30 mmol/Kg. The reactions were heated to 130 C and 140 C for the CdTe and CdSe batches, respectively, and were held at these temperatures for 30 min. The resulting two induction period samples, CdTe 130 C/30 min and CdSe 140 C/30 min, were then mixed at room temperature in equal volumes. Such mixed samples were used in the present work. We show that when a mixed sample was incubated at room temperature for 24 hours and was then dispersed in 2.3 mL of Tol, CdTeSe MSC-399 in a single-ensemble form evolved at first, but disappeared later. Upon the addition of 0.7 mL of OTA into the Tol dispersion, CdTe MSC-371 developed first, then vanished, while single-ensemble CdTeSe MSC-399
returned (Figure 1). When an as-mixed sample (with just a one
min incubation) was dispersed in a mixture containing 2.5 mL of Tol and 0.5 mL of OTA, CdTeSe MSC-399 alone was obtained (Figure 2). When an as-mixed sample was dispersed in 3.0 mL of a Tol and OTA mixture but with relatively high OTA amounts of 0.7 and 1.0 mL, the appearance then disappearance of CdTe MSC-371
correlated with the evolution process of CdTeSe MSC-399 (Figure
3). With the increase in the OTA amount, the rate of the CdTe
MSC-371 to CdTeSe MSC-399 transformation decreased. The effect of the relative OTA amount was tested further by changing the amount of a single as-mixed sample dispersed in a mixture of
2.0 mL of Tol and 1.0 mL of OTA (Figure 4).
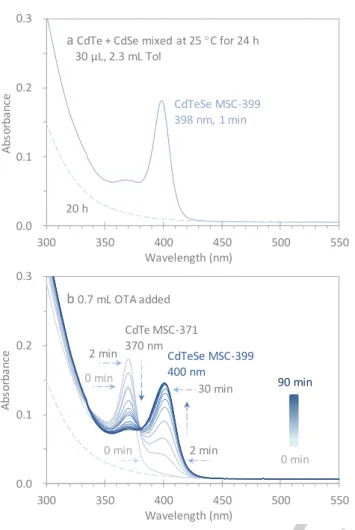
In Figure 1, we show the optical absorption spectra collected from such a mixture. The mixture was incubated (prior to dispersion) at room temperature for 24 h, and then 30 μL of the
incubated mixture was dispersed in 2.3 mL of Tol (Figure 1a, solid
trace). After 20 h (Figures 1a and 1b, dashed traces), 0.7 mL of
OTA was added to the dispersion and in situ spectra were
collected during the subsequent 90 min (Figure 1b, solid traces).
The 15 spectra presented were collected with a time interval of 2 min in the first 12 min, at 15 and 30 min, and then with a time interval of 10 min from 30 to 90 min.
Accepted
Figure 1. Presence and disappearance (a) and recovery (b) of alloy CdTeSe MSC-399 monitored by optical absorption spectroscopy. (a) Binary induction period samples of CdTe and CdSe were mixed with equal volumes at room temperature and incubated for 24 hours (Steps 1 and 3). An aliquot of 30 μL of the incubated mixture was dispersed in 2.3 mL Tol. Immediately, alloy CdTeSe MSC-399 was detected (1 min, solid trace); after 20 h, CdTeSe MSC-399 disappeared completely (Steps 4 and 2) (dashed trace). (b) 0.7 mL OTA was added to the dispersion, and optical absorption spectra were in-situ collected for times up to 90 min. Immediately, CdTe MSC-371 was observed (0 min) and increased to 2 min (Step 5); afterwards, it monotonically decreased and disappeared at 40 min (Step 6). Simultaneously, CdTeSe MSC-399 recovered and increased in strength (Step 3). From 40 to 90 min, MSC-399 evolved in a single-ensemble form and remained constant in strength. An isosbestic point at 380 nm appeared.
After a 24 h incubation (Figure 1a, solid trace), the mixture
displayed a sharp absorption peaking at 399 nm in Tol, which
suggests that ternary alloy CdTeSe MSC-399 is present.[1] After 20
h in Tol (Figures 1a and b, dashed traces), the strength of the
absorption peak declined to zero; as therefore, did the amount of MSC-399. After the addition of 0.7 mL of OTA to the dispersion (Figure 1b, solid traces), a characteristic absorption appeared immediately peaking at 371 nm (0 min), indicating that CdTe
MSC-371 had formed.[4-6] The strength of this CdTe MSC-371 absorption
increased for 2 min; afterwards, it declined and disappeared almost entirely after 40 min. At the same time, a monotonic
increase of an absorption peaking around 400 nm was observed from 0 to 40 min, which is indicative of a continuous evolution of CdTeSe MSC-399. From 40 to 90 min, this absorption strength was constant, suggesting that the quantity of CdTeSe MSC-399 in the dispersion was not changing further.
The solid trace in Figure 1a demonstrates that CdTeSe
MSC-399 was present and CdTe MSC-371 and CdSe MSC-415 were not. For this reason, it appears that during the 24 h room-temperature
incubation, the CdTeSe PC formed first (Step 1) and then
transformed to CdTeSe MSC-399 (Step 3) in the mixture of the
two binaries. Meanwhile, the CdTe PC to CdTe MSC-371 (Step 5)
and CdSe PC to CdSe MSC-415 transformations did not take place. Accordingly, the production of the ternary CdTeSe PCs was likely related to the consumption of the binary CdTe and CdSe PCs.
From the result presented in Figure 1b, we are led to propose that
the CdTeSe PC formation follows only the forward direction of Eq
1 (Step 1) without any direct involvement of CdSe PC-415, Eq 2. We further propose that the consumption of the binary CdSe PC happened via the CdSe PC to M/F fragmentation, driven by the
depletion of the CdSe M/F, a process described by Eq 1 in the
forward direction (Step 1).
The identical two dashed traces in Figures 1a and 1b suggest
that the CdTeSe MSC-399 to CdTeSe PC transformation (Step 4)
took place in the Tol dispersion. After the OTA addition (Figure 1b,
solid traces), both CdTe MSC-371 and CdTeSe MSC-399 increased in the first 2 min. In several examples, a primary amine only such as OTA (and not a secondary amine) has been shown to facilitate
the binary PC to binary MSC transformation.[4-7,12] The immediate
appearance of CdTe MSC-371 upon the addition of OTA demonstrates that CdTe PCs had been present in the Tol dispersion. The formation of the CdTe PC is proposed to be via Step 2, the backward direction of Eq 1. Step 5 represents the CdTe PC-371 to CdTe MSC-371 transformation. At the same time, the
evolution of CdTeSe MSC-399 (Step 3) following the addition of
OTA indicates that CdTeSe PC-399 was also present in the Tol dispersion. From 0 to 40 min, the monotonic increase of CdTeSe
MSC-399 (Step 3) is accompanied by a simultaneous, continuous
reduction in CdTe MSC-371 (Step 6). This behavior was related to
the consumption of CdTeSe PC-399 (Step 1), which shifted the
equilibrium of Eq 1 to the right. We, therefore, surmise that the
apparent CdTe MSC-371 to CdTeSe MSC-399 transformation
occurs via Steps 3, 1, and 6 in sequence.
In a side note, we have reported similar transformations from one type of CdTe MSCs to another, which include the CdTe MSC-371 to CdTe MSC-417 transformation when one induction period
sample was dispersed in 3.0 mL of Tol and OTA mixtures.[6]
Basically, a relatively large (such as 1.0 mL) or small (such as 0.5 mL) amount of OTA favors CdTe MSC-371 or CdTe MSC-417, respectively. And the amount of OTA affects the CdTe MSC-371 to CdTe MSC-417 transition, which occurs via their corresponding
PCs but with an isosbestic point at 384 nm.[6] Here, with an
isosbestic point at 380 nm, the disappearance of CdTe MSC-371 accompanied by a concurrent increase of CdTeSe MSC-399 appears to be quite similar to the CdTe MSC-371 to CdTe MSC-417
transition.[6]
It is significant that after the addition of OTA, there was no indication that CdSe MSC-415 had formed. This is an important observation, which indicates a nearly complete absence of CdSe PC-415 in the Tol dispersion (prior to the addition of OTA). To investigate the assumption that there was little CdSe PC in the Tol
dispersion, we increased the OTA amount to 1.0 mL. Figure S1-1
shows absorption spectra collected from the same binary mixture
0.0 0.1 0.2 0.3 300 350 400 450 500 550 A b so rb a n ce a elen th nm d e e 3 3 nm min 0 h
a
d e d e mixed at for h 30 μL .3 mL ol 0.0 0.1 0.2 0.3 300 350 400 450 500 550 A b so rb a n ce a elen th nm d e 3 3 0 nm d e e 3 00 nm 0 min 0 minb
0. mL A added 0 min min min 0 min 30 minAccepted
Manuscript
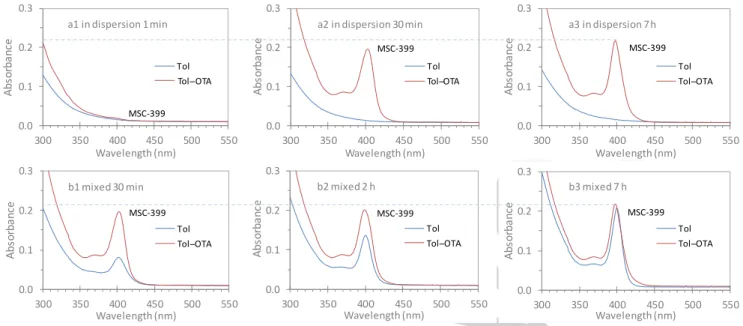
Figure 2. Optical absorption spectra collected from eight identical mixtures of the two binary CdTe and CdSe induction period samples
(but with different incubation times after mixing). After a room-temperature incubation of 1 min (top panel a1 to a3), 30 min (b1), 2 h b and h b3 bottom panel each mixture 30 μL was dispersed in 3.0 mL of ol blue traces and in a mixture of . mL Tol and 0.5 mL OTA (red traces). In the top panel, the spectra were collected after dispersion for 1 min (a1), 30 min (a2), and 7 h (a3), and in the bottom panel for 1 min only. The two horizontal dashed lines are visual guides. As suggested by the blue and red traces for the as-mixed
samples in the top panel, the evolution of CdTeSe PC-399 occurred (Step 1) in the Tol and OTA mixture and immediately transformed to
CdTeSe MSC-399 (Step 3), with Step 1 being rate-determining. For the incubated samples in the bottom panel, CdTeSe PC-399 had
evolved almost completely at room temperature prior to dispersion and a portion transformed to CdTeSe MSC-399 (Step 3), with the
rate-determining step of the latter (Step 3).
but dispersed first in 2.0 mL of Tol. After the disappearance of CdTeSe MSC-399 at 30 min, 1.0 mL of OTA was added and an in-situ optical absorption spectra were collected with a time interval of 5 min for times up to 60 min. Similar results were obtained, including CdSe MSC-415 not being observed, the evolution and later disappearance of CdTe MSC-371, the development of CdTeSe
MSC-399, and the isosbestic point at 380 nm. Figure S1-2 presents
two expanded views for the two isosbestic points shown in Figures
1b and S1-1b. Thus, for the formation of CdTeSe PC in a mixture of
two binary CdTe and CdSe induction period samples, we conclude
that the pathway followed is solely that described by Eq 1 (the
forward direction, Step 1); furthermore, the consumption of the
CdSe M/F leads to the fragmentation of CdSe PC-415. The room-temperature formation of CdTeSe PC-399 via the substitution reaction described by Eq. 1 instead of Eq. 2 is thermodynamically favored, due to the fact that the Cd ̶ Te bond energy (100.0 15.1
kJ
·
mol-1) is smaller than the Cd ̶ Se bond energy (127.6 25.1kJ
·
mol-1).[1,51,52]For Scheme 1, it remains to be seen which process is faster,
the CdTeSe PC-399 generation (Step 1) or the CdTeSe PC-399 to
CdTeSe MSC-399 transformation (Step 3). With this question in
mind, we designed experiments using the same mixtures made from the binary CdTe and CdSe induction period samples but with
various incubation periods (Figures 2 to 4). In Figure 2, the
incubation time comprised the periods after (top panel) or before (bottom panel) dispersion in either 3.0 mL of Tol (blue traces) or in a mixture of Tol (2.5 mL) and OTA (0.5 mL) (red traces). The identical mixtures had the incubation periods of only 1 min (so-called as-mixed, top panel a1 to a3), 30 min (b1), 2 h (b2), and 7 h
(b3) (bottom panel). 30 L of each mixed sample was used. The optical absorption spectra were collected after dispersion for about 1 min (a1), 30 min (a2), and 7 h (a3) (top panel), as well as about 1 min (bottom panel b1 to b3). (Figure S2-1 shows the same set of data but in a different way of presentation.)
For the as-mixed sample in Tol from a1 to a3 (blue traces), the absorption was featureless without a characteristic absorption peak being observed. In the Tol and OTA mixture (red traces), a quite small absorption peaking at 399 nm was observed for Trace a1, while Traces a2 and a3 exhibited a much larger absorption peaking at 399 nm with similar optical density. We infer that, there was neither MSC-399 nor PC-399 formed in the as-mixed sample, while at 1 min in the Tol and OTA mixture, a small amount
of PC-399 evolved (Step 1) and instantly transformed into
MSC-399 (a1) (Step 3). At 30 min, CdTeSe PC-399 had formed to a
maximum amount, which also immediately transformed to MSC-399 (a2). Thus, there is no discernible increase of CdTeSe MSC-MSC-399 from 30 min (a2) to 7 h (a3). It is noteworthy that PC-399 was produced in the Tol-OTA dispersion for the as-mixed sample (via Step 1); being rate-determining, the evolution occurred slower
than its transformation to MSC-399 (Step 3).
For the three incubated samples in Tol from b1 to b3 (bottom panel blue traces), a characteristic absorption peaking at 399 nm was observed with an increase of its optical density. In the Tol and OTA mixture (red traces), a similar absorption was also observed, with only negligible differences in the optical density at the absorption peak. Thus, from Samples b1 to b3, the amount of MSC-399 increased in Tol but remained almost the same in the Tol and OTA mixture. For Sample b3 with a relatively long incubation of 7 h, the quantity of MSC-399 in Tol is similar to that in the Tol
0.0 0.1 0.2 0.3 300 350 400 450 500 550 A b so rb an ce Wavelength (nm) Tol ol ̶ A MSC-399 a in dispersion min 0.0 0.1 0.2 0.3 300 350 400 450 500 550 A bs or ba nc e a elen th nm Tol ol ̶ A 3 a in dispersion 30 min 0.0 0.1 0.2 0.3 300 350 400 450 500 550 A bs or ba nc e Wavelength (nm) Tol ol ̶ A 3 a3 in dispersion 7 h 0.0 0.1 0.2 0.3 300 350 400 450 500 550 A bs or ba nc e a elen th nm Tol ol ̶ A 3 b1 mixed 30 min 0.0 0.1 0.2 0.3 300 350 400 450 500 550 A b so rb an ce a elen th nm Tol ol ̶ A 3 b mixed h 0.0 0.1 0.2 0.3 300 350 400 450 500 550 A bs or ba nc e a elen th nm Tol ol ̶ A 3 b3 mixed h
Accepted
Manuscript
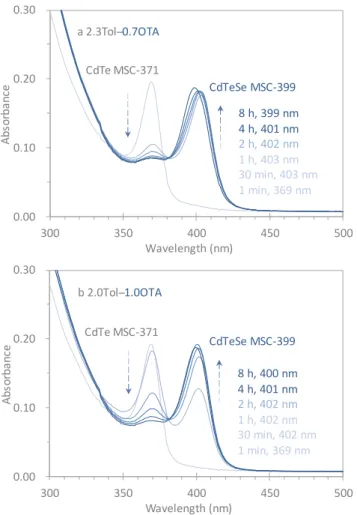
Figure 3. Optical absorption spectroscopy study of the formation of alloy CdTeSe MSC-399 from two as-mixed samples (30 L each) in 3.0 mL of Tol and OTA mixtures with the OTA amounts of 0.7 (a) and 1.0 mL (b). For each of the two dispersions, six spectra were collected after certain periods, as indicated. At 1 min, only CdTe MSC-371 evolved (Step 5). At 8 h, only single-ensemble CdTeSe MSC-399 (Steps 1/5 and 6) existed with amounts that were similar in the two dispersions. The apparent changes, the decrease of CdTe MSC-371 and the increase of CdTeSe MSC-399, were faster in Dispersion a than in Dispersion b. An isosbestic point was observed at 380 nm. The larger the amount of OTA is, the slower the change from CdTe MSC-371 to CdTeSe MSC-399 is. The effect of the OTA amount on the change is probably related to the equilibrium between Steps 5 and 6.
and OTA mixture. For Samples b1 and b2 with relatively short incubation periods, the quantity of MSC-399 is significantly less in Tol than that in the Tol and OTA mixture; also, the difference is larger for Sample b1 than that for Sample b2.
Clearly, when an incubated mixture contains both MSC-399 and PC-399, the quantity of MSC-399 in Tol would be smaller than that in the Tol and OTA mixture. We argue that the magnitude of this difference of MSC-399 amounts is related to the progress in
the CdTeSe PC to CdTeSe MSC transformation (Step 3), which
occurs much more rapidly in the Tol and OTA mixture than in the binary mixture alone (prior to dispersion). Therefore, for the six mixtures used for the bottom panel (from b1 to b3 prior to
dispersion), PC-399 evolved (Step 1), together with MSC-399 (Step
3). Furthermore, during the 30 min incubation (a1), CdTeSe
PC-399 had formed completely (Step 1), but only a portion had
transformed to MSC-399 (Step 3).During the 7 h incubation (a3),
CdTeSe PC-399 had completely transformed to MSC-399. In this regard during incubation prior to dispersion, the formation of
PC-399 (Step 1) occurred faster than its transformation to MSC-399
(Step 3). The rate of the latter (Step 3) was greatly increased when
OTA was present in the Tol dispersions that this step (Step 3)
became even faster than Step 1.
Regarding the incubation periods prior to and after dispersion,
more information is available in Figure S2-2, which shows optical
absorption spectra collected from another six identical mixtures (made from the binary CdTe and CdSe induction period samples) dispersed in a mixture of 2.5 mL of Tol and 0.5 mL of OTA. The incubation periods were 1 min (a), 30 min (b), 1 h (c), 2 h (d), 4 h (e), and 8 h (f). Spectra from each dispersion were collected at points in time of 1 min, 30 min, 1 h, 2 h, 4 h, and 8 h. For the
as-mixed sample in the Tol-OTA mixture, Figures 2a and S2-2a, the
PC-399 → MSC-399 transformation (Step 3) was relatively fast,
compared to the formation of CdTeSe PC-399 (Step 1). It appears
that the presence of OTA facilitated both Steps 1 and 3, with a
greater enhancement for Step 3. For these binary mixtures which
underwent a room-temperature incubation lasting 30 min or
longer, similar results were obtained. As shown in Figures 2b and
S2-2b to S2-2f, the formation of CdTeSe PC-399 (Step 1) had almost finished prior to dispersion. Meanwhile, only a part of the
CdTeSe PC had transformed to CdTeSe MSC-399 (Step 3); in the
Tol-OTA dispersions, this transformation was accelerated to completion.
Next, we would like to address the possibility that the
initial-stage presence (Step 5)and later disappearance (Step 6) of CdTe
MSC-371 is actually involved in the evolution of single-ensemble CdTeSe MSC-399 in a Tol and OTA mixture (with a relatively large
amount of OTA). In Figure 3, we show the optical absorption
spectra collected from an as-mixed sample (30 μL dispersed in two different Tol and OTA mixtures, 2.3 mL of Tol and 0.7 mL of OTA (Mixture a) and 2.0 mL of Tol and 1.0 mL of OTA (Mixture b). The absorption spectra were collected after dispersion for 1 min, 30 min, 1 h, 2 h, 4 h, and 8 h (as represented by the traces which are graded respectively from light blue to dark blue). For Mixtures a and b at 1 min, there was initially only one absorption peak at 371 nm (with similar strength), indicating the presence of CdTe MSC-371 (with similar amounts). After 8 h the longest period monitored, the absorption of CdTe MSC-371 was no longer visible; instead, there was another absorption peaking at 399 nm (of similar strength). Thus, CdTeSe MSC-399 evolved in a single-ensemble form (with similar amounts) in Mixtures a and b. Moreover, the transformation from CdTe MSC-371 to CdTeSe MSC-399 appeared to occur faster in Mixture a than in Mixture b.
In the mixture of 2.5 mL of Tol and 0.5 mL of OTA (Figure S2a), the
transformation was even faster, such that CdTe MSC-371 did not seem to be present at all during the CdTeSe MSC-399 evolution.
Accordingly, in Mixtures a and b, it is noteworthy that CdTe
MSC-371 was formed (Step 5) preferentially in the very initial
stage. When the OTA quantity was relatively small (Mixture a), the
disappearance of CdTe MSC-371 (Step 6) and the evolution of
CdTeSe MSC-399 (Step 3) were both relatively fast. When the OTA
quantity was relatively large (Mixture b), these two processes
were relatively slow. Thus, Step 6 seemed to be driven by Step 3.
As mentioned above, the as-mixed samples contained CdTe PC and M/F, as well as CdSe PC and M/F, but with little PC-399
0.00 0.10 0.20 0.30 300 350 400 450 500 A bs or ba nc e a elen th nm d e 3 CdTeSe MSC-399 8 h, 399 nm 4 h, 401 nm 2 h, 402 nm 1 h, 403 nm 30 min, 403 nm 1 min, 369 nm a .3 ol ̶ 0. A 0.00 0.10 0.20 0.30 300 350 400 450 500 A b so rb a n ce Wavelength (nm) CdTe MSC-371 d e e 3 h 00 nm h 0 nm h 0 nm h 0 nm 30 min 0 nm min 3 nm b .0 ol ̶ .0 A
Accepted
Manuscript
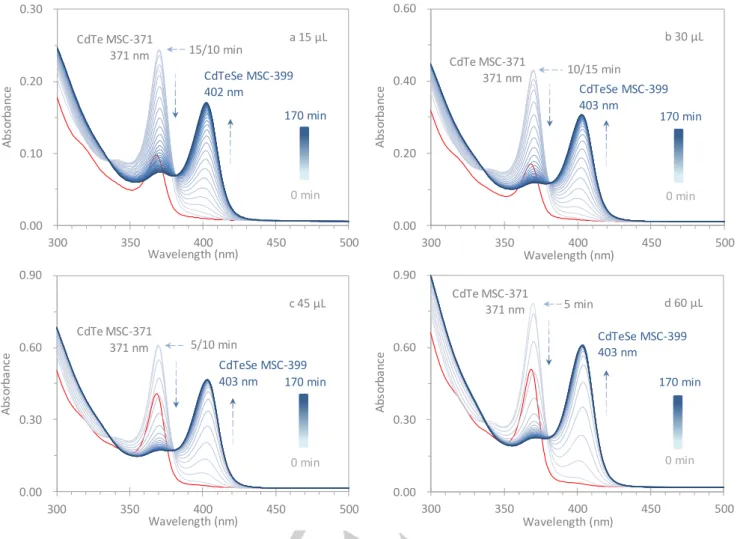
Figure 4. Time-resolved optical absorption spectroscopy done in-situ investigating the apparent change from binary CdTe MSC-371 to alloy CdTeSe MSC-399. Four identical as-mixed samples with olumes of a 30 b c and 0 μL d were dispersed in a mixture of 2.0 mL Tol and 1.0 mL OTA. CdTe MSC-371 evolved immediately (0 min, red traces) but disappeared in the end with CdTeSe MSC-399 present, the absorption peak of which started to be apparent after 5 min. Similar to Figure 3, an isosbestic point at 380 nm was observed; furthermore, from Dispersions a to d with a relative decrease of the OTA amount, the rate of the change from CdTe MSC-371 to CdTeSe MSC-399 increased
.
formed. After 1 min in Mixtures a and b with 0.7 and 1.0 mL OTA,
respectively, CdTe PC rapidly converted into CdTe MSC-371 (Step
5) due to the presence of a relatively large amount of OTA
(compared to the OTA amount of 0.5 mL used for Figures 2 and
S2). Concurrently, the CdTe PC reacted with the CdSe M/F to
generate the CdTeSe PC (Step 1) which transformed to CdTeSe
MSC-399; the continuous depletion of the CdTe PC due to Steps 1
and 3 caused the CdTe MSC-371 → CdTe PC-371 transformation
(Step 6) to take over, as well as the CdSe PC-415 → CdSe M/F fragmentation to occur. Therefore, in the initial stage of an
as-mixed sample in Mixture a or b, Step 5 proceeded faster than Step
1; thus, only CdTe MSC-371 would have been observed, whereas
CdTeSe MSC-399 would have been detected later. This is consistent with the fact that the relatively large amount of OTA
(such as 1.0 mL) favored the formation of CdTe MSC-371.[4-6] In
the 2.5 mL Tol and 0.5 mL OTA mixture (Figures 2a and S2a), it is
reasonable that Step 1 became faster than Step 5; consequently,
only CdTeSe MSC-399 would have been observed without the complication of the presence of CdTe MSC-371, as was seen in the experiment.
In addition to as-mixed samples, we also explored incubated
samples in Mixture b. In Figure S3-1, we show the absorption
spectra collected from four binary mixtures which had been incubated at room temperature for periods of 30 min (a), 1 h (b), 2 h (c), and 4 h (d). These mixtures (30 L each) were then dispersed in Mixture b, whereupon absorption spectra were collected after dispersion for 1 min, 30 min, 1 h, 2 h, 4 h, and 8 h. After 1 min for Dispersions a to d, a decrease of MSC-371 was observed along with an increase of MSC-399; only MSC-399 was observed in Dispersion d and its signal was the strongest. After 8 h in dispersion, CdTeSe MSC-399 evolved into a single-ensemble form with the final amount essentially the same in all cases. These experimental observations can be readily understood from our
model proposed (Scheme 1). During the incubation prior to
dispersion, Steps 1 and 3 took place mostly; the former finished
after 2 h (with almost no CdTe PC-371 remaining at 4 h) and the latter at about the 4 h mark (with an almost maximum amount of MSC-399 evolved). For Samples a to d, the consumption of the
CdTe PC increased via Steps 1 and 3, which resulted in a
population increase for both CdTeSe PC-399 and MSC-399. In the
0.00 0.10 0.20 0.30 300 350 400 450 500 A b so rb an ce a elen th nm d e 3 3 nm d e e 3 0 nm 0 min 0 min a μL 0 min 0.00 0.20 0.40 0.60 300 350 400 450 500 A b so rb a n ce a elen th nm d e 3 3 nm CdTeSe MSC-399 403 nm 0 min 0 min b 30 μL 0 min 0.00 0.30 0.60 0.90 300 350 400 450 500 A b so rb a n ce a elen th nm d e 3 3 nm CdTeSe MSC-399 403 nm 0 min 0 min c μL 0 min 0.00 0.30 0.60 0.90 300 350 400 450 500 A bs or ba nc e a elen th nm d e 3 3 nm d e e 3 03 nm 170 min 0 min d 0 μL min
Accepted
Manuscript
Tol and OTA dispersion, OTA (1.0 mL) facilitated Step 5 to result in
the presence of CdTe MSC-371,[4-6] as well as drove Steps 1 and 3
to lead to the evolution of MSC-399.
Evidently, for the evolution of MSC-399 with the as-mixed and incubated samples, which were dispersed in Tol as well as in Tol and OTA mixtures with relatively small (0.5 mL) and large (1.0 mL)
amounts of OTA, Scheme 1 completely explains the actual
experimental phenomena observed. To test further the inference that CdSe PC-415 is not directly involved in the PC-399 formation, we carried out the experiment at a higher temperature (50 C) with an as-mixed sample dispersed in Mixture b (with 1.0 mL of
OTA). As shown in Figure S3-2, CdSe MSC-415 was not observed,
which supports the conclusion that the room-temperature formation of CdTeSe PC-399 occurs via the pathway described by
the forward direction of Eq 1 only and not by the forward
direction of Eq 2.
Regarding the evolution of CdTeSe MSC-399 into a single-ensemble form, which may actually involve the initial presence (Steps 5) and later disappearance (Step 6) of CdTe MSC-371, further experimental evidence can be obtained via tuning the relative OTA amount by changing the volume of an as-mixed
sample in dispersion. In Figure 4, we show the temporal evolution
of the absorption collected from just a single as-mixed sample but with different volumes of 15 (a), 30 (b), 45 (c and 0 d μL. For each of the four dispersions in the mixture of 2.0 mL of Tol and 1.0 mL of OTA, 49 spectra were in-situ collected for times up to 240 min with intervals of 5 min. The first 35 spectra (from 0 to 170
min) are shown in Figure 4, with the remainder presented in
Figure S4-1a. The time dependences of the apparent absorbance
at 371 and 399 nm for the first 120 min are summarized in Figure
S4-1b. Also, Figure S4-1c presents similar information from a lar er olume 00 μL of the same as-mixed sample dispersed in the same Tol and OTA mixture.
Right after dispersing (0 min, red traces), only CdTe MSC-371 appeared. The strength of the CdTe MSC-371 signal increased to maximum values of 0.23 (a), 0.40 (b), 0.57 (c), and 0.73 (d) at 15 (a), 10 (b), 5 (c), and 5 (d) min, respectively. Thereafter the strength gradually decreased and disappeared completely after 160 (a), 135 (b), 115 (c), and 120 (d) min. As well, from 5 min, the CdTeSe MSC-399 density progressively increased and reached maximum values of 0.16 (a), 0.30 (b), 0.45 (c), and 0.59 (d) at 135 (a), 115 (b), 80 (c), and 55 (d) min, respectively. Taking the instrument uncertainty (0.004) into account, we now report the time when the corresponding optical density value approaches (but is still 0.005 away from) that of CdTe MSC-371 at 240 min and the absolute maximum absorbance value for CdTeSe MSC-399.
Similar to that shown in Figure 3, a transformation from CdTe
MSC-371 to CdTeSe MSC-399 occurred in all these dispersions. Furthermore, the rate of the evolution and disappearance of CdTe MSC-371, as well as that of the development of CdTeSe MSC-399 appeared to increase with the relative amount of the as-mixed sample increased from Dispersions a μL to d 0 μL corresponding to a decrease in the relative concentration of OTA. Thus, this increase in the rate of the CdTe MSC-371 to CdTeSe MSC-399 transformation is in agreement with the results shown in Figures S2a and 3.
In addition to OTA, we studied another primary amine, butyl
amine (BTA). Figure S4-2 shows a similar study of optical
absorption for an as-mixed sample, with various volumes (15, 30, 0 and 00 μL of which were dispersed in a mixture of .0 mL
of Tol and 1.0 mL of BTA. The presence and disappearance of CdTe MSC-371, together with the evolution of CdTeSe MSC-399 was
similar to that shown in Figure 4. For these dispersions, the CdTe
MSC-371 signal increased at the beginning and then gradually disappeared, and the CdTeSe MSC-399 signature progressively increased into a single-ensemble form and ultimately stabilized. Figure S4-3 illustrates the optical density at 399 nm (with the maximum values obtained in the dispersions) versus the volume of the as-mixed sample. A linear relationship is obtained for the two types of dispersions. It appears that the nature and amount of a primary amine, OTA or BTA, did not affect the quantity of
CdTeSe MSC-399 that finally evolved. Figure 3 supports this result
as well. It appears, therefore, that the primary amine might have
played a combination role of catalysis and surface ligands.[13] The
larger the as-mixed sample amount is, the smaller the relative amine amount is; accordingly, the evolution and disappearance of CdTe MSC-371, as well as the evolution and stabilization of CdTeSe MSC-399 become faster. Furthermore, the preliminary
kinetics analysis (as shown by Figure S4-4) indicates that the
evolution of MSC-399 in Tol and amine mixtures did not follow a
simple first-order reaction kinetics behavior.[5,8,13,53] Thus, the
formation of CdTeSe PC-399 (Step 1) may be rate-determining, instead of the CdTeSe PC-399 to MSC-399 transformation (Step 3). Critically, the use of primary amines is important for the development of CdTeSe MSC-399 with as-mixed samples in
dispersion. In Figure S4-5, we show the optical absorption spectra
collected from a CdTe induction period sample, a CdSe induction period sample, and an as-mixed sample, each of which was dispersed in 3.0 mL of the mixture of Tol (2.0 mL) and di-alkylamine (1.0 mL). The data suggests that the evolution of CdTeSe MSC-399 did not take place with the as-mixed sample dispersed in solutions containing a secondary amine (such as di-OTA and di-BTA) instead of a primary amine (such as di-OTA and BTA).
Conclusion
In conclusion, we have provided a comprehensive explanation, Scheme 1, of the fundamental pathway for the room-temperature evolution of CdTeSe MSC-399. The formation of CdTeSe MSC-399 was monitored by optical absorption spectroscopy, when binary CdTe and CdSe induction period samples were mixed and then dispersed in Tol and/or in Tol and OTA mixtures. The mixed sample was left either as-mixed or incubated. For incubated
samples prior to dispersion (Figure 1a), the formation of CdTeSe
PC-399 (Step 1, the forward direction of Eq. 1 only without a
direct involvement of the CdSe PC) proceeds faster than the
transformation from CdTeSe PC-399 to CdTeSe MSC-399 (Step 3)
does. In a Tol-OTA mixture, both Steps 1 and 3 are accelerated,
but in the process Step 3 becomes faster than Step 1. For an
as-mixed sample in a Tol-OTA mixture (Figures 2a, 3, and 4), when
the OTA amount is relatively small (0.5 mL) (Figure 2a), the
evolution of CdTeSe MSC-399 is not complicated by the initial
presence (Step 5) and later disappearance (Step 6) of CdTe
MSC-371. When the OTA amount is relatively large (0.7 or 1.0 mL) (Figures 3 and 4), CdTe MSC-371 (Step 5) is observed to be present prior to CdTeSe MSC-399. In a later stage, CdTe MSC-371
disappears completely (Step 6) and single-ensemble CdTeSe
MSC-399 develops. Moreover, the apparent CdTe MSC-371 to CdTeSe
Accepted
MSC-399 transformation is faster in dispersion with 0.7 mL OTA than that with 1.0 mL OTA. The effect of the amine amount on the absence of CdTe MSC-371 as well as on the transformation rate is
in agreement with Step 5 being favored by relatively large amine
amounts (such as 1.0 mL OTA).[6] The amine amount appears to
play a significant role in the equilibrium between Steps 5 and 6,
namely the stability of CdTe MSC-371 in Tol and OTA mixtures.[6]
Scheme S1-1 focuses on whether CdTe MSC-371 was absent (Figure 2) or present (Figure 3) when the amine amount was relatively small or large, respectively. Although the OTA amount seems to influence the rate of the transformation, it does not greatly influence the final quantity of CdTeSe MSC-399 that evolves. Theoretical effort would be beneficial for a more basic
understanding of Scheme 1 at the molecular level, as well as how
primary amines assists the PC-371 to MSC-371 transformation (Step 5), together with the PC-399 formation (Step 1) and
transformation to MSC-399 (Step 3). It is noteworthy that Figure 1
presents the disappearance (in Tol) and recovery (in a Tol and OTA mixture) of CdTeSe MSC-399, and the latter process involved the
occurrence (Step 5) and vanishing (Step 6) of CdTe MSC-371. Thus,
Figure 1 provides the specific experimental evidence for Steps 3 and 4, which represent the reversible CdTeSe PC-399 CdTeSe
MSC-399 transformation, as well as for Step 2 the backward
direction of Eq 1. It is noteworthy that Scheme 1 is consistent with
the model proposed for the transformations among the four types of CdTe MSCs, CdTe MSC-371, MSC-417, MSC-448, and dMSC-371,
in that these transformations occur through their own PCs.[6] With
relevance to ternary perovskite MSCs,[54] Eq 1 (Steps 1 and 2)
provides a deeper understanding for these transformations
among the various types of binary ME MSCs.[35-50] The present
findings on the room-temperature evolution of CdTeSe MSC-399 with mixed binary CdTe and CdSe induction period samples offer strong evidence support for the two-pathway model proposed for
binary semiconductor quantum dots and MSCs,[3,9] and contribute
to the advance of the non-classical multi-step nucleation
models.[21-34]
Acknowledgements
K. Y. thanks the National Natural Science Foundation of China (NSFC) 21773162, the Fundamental Research Funds for the Central Universities, and the Open Project of Key State Laboratory for Supramolecular Structures and Materials of Jilin University for SKLSSM 202035. M. Z. is grateful to Sichuan University Postdoctoral Research Fund 2019SCU12073 and the Fundamental Research Funds for the Central Universities. H. F. and W. H. are grateful for the National Major Scientific and Technological Special
Project for “ i nificant New Dru s De elopment”
(2019ZX09201005-005-001 and 2019ZX09201005-005-002).
Keywords: Magic-Size Clusters (MSCs) • Semiconductor
Quantum Dots • Cadmium Telluride Selenide (CdTeSe) • Nucleation • Crystal Growth
[1] D. Gao, X. Hao, N. Rowell, T. Kreouzis, D. J. Lockwood, S. Han, H. Fan, H. Zhang, C. Zhang, Y. Jiang, J. Zeng, M. Zhang, K. Yu, Nat. Commun.
2019, 10, 1674.
[2] L. Li, J. Zhang, M. Zhang, N. Rowell, C. Zhang, S. Wang, J. Lu, H. Fan,
W. Huang, X. Chen, K. Yu, Angew. Chem. Int. Ed. 2020, DOI: 10.1002/anie.202001608.
[3] C. Palencia, K. Yu, K. Boldt, ACS Nano 2020, 14 − 3 . [4] M. Liu, K. Wang, L. Wang, S. Han, H. Fan, N. Rowell, J. A. Ripmeester,
R. Renoud, F. Bian, J. Zeng, K. Yu, Nat. Commun. 2017, 8, 15467. [5] C. Luan, Ö . Ö . Gokcinar, N. Rowell, T. Kreouzis, S. Han, M. Zhang, H.
Fan, K. Yu, J. Phys. Chem. Lett. 2018, 9 − .
[6] C. Luan, J. Tang, N. Rowell, M. Zhang, W. Huang, H. Fan, K. Yu, J. Phys.
Chem. Lett. 2019, 10 3 − 3 3.
[7] D. Zhu, J. Hui, N. Rowell, Y. Liu, Q. Y. Chen, T. Steegemans, H. Fan, M. Zhang, K. Yu, J. Phys. Chem. Lett. 2018, 9, 2818–2824.
[8] T. Zhu, B. Zhang, J. Zhang, J. Lu, H. Fan, N. Rowell, J. A. Ripmeester, S. Han, K. Yu, Chem. Mater. 2017, 29 − 3 .
[9] J. Zhang, X. Hao, N. Rowell, T. Kreouzis, S. Han, H. Fan, C. Zhang, C. Hu, M. Zhang, K. Yu, J. Phys. Chem. Lett. 2018, 9 3 0−3 . [10] B. Zhang, T. Zhu, M. Ou, N. Rowell, H. Fan, J. Han, L. Tan, M. T. Dove,
Y. Ren, X. Zuo, S. Han, J. Zeng, K. Yu, Nat. Commun. 2018, 9, 2499. [11] J. Zhang, L. Li, N. Rowell, T. Kreouzis, M. Willis, H. Fan, C. Zhang, W.
Huang, M. Zhang, K. Yu, J. Phys. Chem. Lett. 2019, 10 − 3 . [12] L. Wang, J. Hui, J. Tang, N. Rowell, B. Zhang, T. Zhu, M. Zhang, X. Hao,
H. Fan, J. Zeng, S. Han, K. Yu, Adv. Sci. 2018, 5, 1800632.
[13] S. Liu, Q. Yu, C. Zhang, M. Zhang, N. Rowell, H. Fan, W. Huang, K. Yu, B. Liang, J. Phys. Chem. Lett. 2020, 11, 75–82.
[14] K. Yu, X. Liu, T. Qi, H. Yang, D. M. Whitfield, Q. Y. Chen, E. J. C. Huisman, C. Hu, Nat. Commun. 2016, 7, 12223
[15] C. Chen, L. Ao, Y. Wu, V. Cifliku, M. C. D. Santos, E. Bourrier, M. Delbianco, D. Parker, J. M. Zwier, L. Huang, N. Hildebrandt, Angew.
Chem. Int. Ed. 2018, 57, 13686–13690.
[16] C. Carrillo-Carrion, M. Atabakhshi-Kashi, M. Carril, K. Khajeh, W. J. Parak, Angew. Chem. Int. Ed. 2018, 57, 5033–5036.
[17] Y. Chen, J. M. Cordero, H. Wang, D. Franke, O. B. Achorn, F. S. Freyria, I. Coropceanu, H. Wei, O. Chen, D. J. Mooney, M. G. Bawendi, Angew.
Chem. Int. Ed. 2018, 57, 4652–4656.
[18] J. Yuan, D. Wen, N. Gaponik, A. Eychmüller, Angew. Chem. Int. Ed.
2013, 52, 976–979.
[19] E. C. Hansen, Y. Liu, H. Utzat, S. N. Bertram, J. C. Grossman, M. G. Bawendi, Angew. Chem. Int. Ed. 2020, 59, 860–867.
[20] X. Li, C. Tung, L. Wu, Angew. Chem. Int. Ed. 2019, 58, 10804–10811. [21] E. Wiedenbeck, M. Kovermann, D. Gebauer, H. Colfen, Angew. Chem.
Int. Ed. 2019, 58, 19103–19109.
[22] H. Chen, M. Li, Z. Lu, X. Wang, J. Yang, Z. Wang, F. Zhang, C. Gu, W. Zhang, Y. Sun, J. Sun, W. Zhu, X. Guo, Nat. Commun. 2019, 10, 3872. [23] R. J. Davey, S. L. Schroeder, J. H. Horst, Angew. Chem. Int. Ed. 2013,
52, 2166–2179.
[24] M. Sleutela, A. E. S. van Driessche, Proc. Natl. Acad. Sci. 2014, 111, 546–553.
[25] X. Ma, S. Zhang, F. Jiao, C. J. Newcomb, Y. Zhang, A. Prakash, Z. Liao, M. D. Baer, C. J. Mundy, J. Pfaendtner, A. Noy, C. Chen, J. J. de Yoreo,
Nat. Mater. 2017, 16, 767–774.
[26] X. Tang, W. Chen, L. Li, Macromolecules 2019, 52, 3575–3591. [27] Z. Liu, C. Shao, B. Jin, Z. Zhang, Y. Zhao, X. Xu, R. Tang, Nature 2019,
574, 394–398.
[28] W. J. E. M. Habraken, J. Tao, L. J. Brylka, H. Friedrich, L. Bertinetti, A. S. Schenk, A. Verch, V. Dmitrovic, P. H. H. Bomans, P. M. Frederik, J. Laven, P. van der Schoot, B. Aichmayer, G. de With, J. J. DeYoreo, N. A. J. M. Sommerdijk, Nat. Commun. 2013, 4, 1507.
[29] R. Demichelis, P. Raiteri, J. D. Gale, D. Quigley, D. Gebauer, Nat.
Commun. 2011, 2, 590.
[30] A. Dey, P. H. H. Bomans, F. A. Müller, J. Will, P. M. Frederik, G. de With, N. A. J. M. Sommerdijk, Nat. Mater. 2010, 9, 1010–1014. [31] D. Gebauer, A. Volkel, H. Colfen, Science 2008, 322, 1819–1822. [32] J. Yang, J. Koo, S. Kim, S. Jeon, B. K. Choi, S. Kwon, J. Kim, B. H. Kim,
W. C. Lee, W. B. Lee, H. Lee, T. Hyeon, P. Ercius, J. Park, J. Am. Chem.
Soc. 2019, 141, 763–768.
[33] B. Jin, Y. Wang, Z. Liu, A. France-Lanord, J. C. Grossman, C. Jin, R. Tang, Adv. Mater. 2019, 31, 1808225.
Accepted
[34] N. D. Loh, S. Sen, M. Bosman, S. F. Tan, J. Zhong, C. A. Nijhuis, P. Král, P. Matsudaira, U. Mirsaidov, Nat. Chem. 2016, 9, 77–82.
[35] J. Yang, F. Muckel, W. Baek, R. Fainblat, H. Chang, G. Bacher, T. Hyeon,
J. Am. Chem. Soc. 2017, 139, 6761–6770.
[36] R. Wang, O. Calvignanello, C. I. Ratcliffe, X. Wu, D. M. Leek, M. B. Zaman, D. Kingston, J. A. Ripmeester, K. Yu J. Phys. Chem. C 2009,
113, 3402–3408.
[37] S. F. Wuister, F. van Driel, A. Meijerink, Phys. Chem. Chem. Phys.
2003, 5, 1253–1258.
[38] P. Dagtepe, V. Chikan, J. Jasinski, V. J. Leppert, J. Phys. Chem. C 2007,
111 − 3.
[39] A. D. Dukes, J. R. McBride, S. J. Rosenthal, Chem. Mater. 2010, 22, 0 − 0 .
[40] S. Kudera, M. Zanella, C. Giannini, A. Rizzo, Y. Li, G. Gigli, R. Cingolani, G. Ciccarella, W. Spahl, W. J. Parak, L. Manna, Adv. Mater. 2007, 19, − .
[41] M. Sun, X. Yang, J. Phys. Chem. C 2009, 113, 8701–8709. [42] B. M. Cossairt, J. S. Owen, Chem. Mater. 2011, 23 3 −3 . [43] A. N. Beecher, X. Yang, J. H. Palmer, A. L. LaGrassa, P. Juhas, S. J. L.
Billinge, J. S. Owen, J. Am. Chem. Soc. 2014, 136 0 − 0 3. [44] M. Zanella, A. Z. Abbasi, A. K. Schaper, W. J. Parak, J. Phys. Chem. C
2010, 114 0 − .
[45] C. B. Williamson, D. R. Nevers, A. Nelson, I. Hadar, U. Banin, T. Hanrath, R. D. Robinson, Science 2019, 363 3 − 3 .
[46] Y. Liu, M. Willis, N. Rowell, W. Luo, H. Fan, S. Han, K. Yu, J. Phys.
Chem. Lett. 2018, 9 3 − 3 3.
[47] Y. Wang, Y. Zhou, Y. Zhang, W. E. Buhro, Inorg. Chem. 2015, 54, − .
[48] D. R. Nevers, C. B. Williamson, B. H. Savitzky, I. Hadar, U. Banin, L. F. Kourkoutis, T. Hanrath, R. D. Robinson, J. Am. Chem. Soc. 2018, 140, 3 −3 .
[49] T. E. Hsieh, T. W. Yang, C. Y. Hsieh, S. J. Huang, Y. Yeh, C. H. Chen, Y. H. Liu, Chem. Mater. 2018, 30 − .
[50] N. Kirkwood, K. Boldt, Nanoscale 2018, 10, 18238–18248. [51] J. Li, J. Jia, Y. Lin, X. Zhou, J. Colloid Interface Sci. 2016, 463, 69–74. [52] W. M. Haynes, CRC Handbook of Chemistry and Physics, 97th ed.,
CRC Press Inc., Boca Raton, 2016–2017, 1568.
[53] Y. Wang, Y. Liu, Y. Zhang, F. Wang, P. J. Kowalski, H. W. Rohrs, R. A. Loomis, M. L. Gross, W. E. Buhro, Angew. Chem., Int. Ed. 2012, 51, − .
[54] K. Xu, E. T. Vikers, B. Luo, Q. Wang, A. C. Allen, H. Wang, V. Cherrette, X. Li, J. Z. Zhang, Sol. Energy Mater. Sol. Cells 2020, 208, 110341.
Accepted
Entry for the Table of Contents (Please choose one layout)
Layout 1:
RESEARCH ARTICLE
Text for Table of Contents Author(s), Corresponding Author(s)*
Page No. – Page No.
Title
Single-ensemble CdTeSe magic-size clusters (MSC-399) evolved at room-temperature when binary CdTe and CdSe induction period samples were mixed and dispersed into a mixture of toluene (Tol) and octylamine (OTA). We propose that the OTA amount affected the rate of the apparent transformation from CdTe MSC-371 to CdTeSe MSC-399 through Steps 5/1, 3, and 6.
Layout 2:
RESEARCH ARTICLE
Author(s), Corresponding Author(s)*
Page No. – Page No.
Title
((Insert TOC Graphic here))