HAL Id: hal-00875719
https://hal.archives-ouvertes.fr/hal-00875719
Submitted on 22 Oct 2013
HAL is a multi-disciplinary open access
archive for the deposit and dissemination of
sci-entific research documents, whether they are
pub-lished or not. The documents may come from
L’archive ouverte pluridisciplinaire HAL, est
destinée au dépôt et à la diffusion de documents
scientifiques de niveau recherche, publiés ou non,
émanant des établissements d’enseignement et de
videos
Guanghan Song, Denis Pellerin, Lionel Granjon
To cite this version:
Guanghan Song, Denis Pellerin, Lionel Granjon. Different types of sounds influence gaze differently
in videos. Journal of Eye Movement Research, International Group for Eye Movement Research
-University of Bern, Switzerland, 2013, 6 (4), pp.1-13. �10.16910/jemr.6.4.1�. �hal-00875719�
Journal of Eye Movement Research Song, G., Pellerin, D., Granjon, L. (2013)
6(4):1, 1-13 Sounds influence gaze differently in videos
1
Introduction
In daily life, humans receive a large quantity of in-formation about the environment through sight and hear-ing. The fast processing of this information helps us to react rapidly and properly. Hence, there exists a mecha-nism in the brain to direct attention towards particular regions or events, called salient regions or events. This attentional bias is not only influenced by visual and audi-tory information separately, but is also influenced by audio-visual interaction.
From psychophysical studies, we know that humans react faster to overlapping bimodal audio-visual stimuli than to unimodal (audio or visual) stimuli (Corneil, van Wanrooij, Munoz, & Van Opstal, 2002 ; Sinnett, Faraco, & Spence, 2008). The studies on audio-visual interaction concentrate on two areas: the influence of visual input on
This research is supported in part by the Rhône-Alpes region (France) through the LIMA project. The authors would like to thank their colleagues R. Drouilhet for the advices on statistical analysis, and A. Rahman and K. Wang for the helpful com-ments about this article.
auditory perception and the influence of acoustic input on visual perception.
Early evidence of the influence of visual input on au-ditory perception is the “McGurk Effect”. The “McGurk Effect” is a phenomenon that demonstrates a perceptual fusion between auditory and visual (lip-reading) infor-mation in speech perception. In this experiment a film of a young woman repeating utterances of the syllable [ba] was dubbed on to lip movements for [ga]: normal adults reported hearing [da] (McGurk& MacDonald, 1976). This “McGurk Effect” works with perceivers of all lan-guage backgrounds (Cohen & Massaro, 1994), and it also works on young infants (Rosenblum, Schmuckler, & Johnson, 1997). Another well-known audio-visual inter-action is that visual “lip-reading” helps speech to be un-derstood, when speech is in poor acoustical conditions or in a foreign language (Jeffers & Barley, 1971 ; Summer-field, 1987).
Speech is a special audio stimulus: numerous current studies are focused on audio-visual interaction of speech (Alho et al., 2012). A study from (Tuomainen, Andersen, Tiippana, & Sams, 2005) provided evidence of the exist-ence of a specific mode of multi-sensory speech percep-tion. More recently, some observations of the mecha-nisms of speech stimuli and visual interaction have demonstrated that lip-read information was more strongly
Different types of sounds influence gaze
differently in videos
Guanghan Song
GIPSA-Lab, CNRS UMR 5216 Grenoble University, France
Denis Pellerin
GIPSA-Lab, CNRS UMR 5216 Grenoble University, France
Lionel Granjon
LPP, CNRS UMR 8158 Paris Descartes University, France This paper presents an analysis of the effect of different types of sounds on visual gaze when a person is looking freely at videos, which would be helpful to predict eye position. In order to test the effect of sound, an audio-visual experiment was designed with two groups of participants, with audio-visual (AV) and visual (V) conditions. By using statisti-cal tools, we analyzed the difference between eye position of participants with AV and V conditions. We observed that the effect of sound is different depending on the kind of sound, and that the classes with human voice (i.e. speech, singer, human noise and singers) have the greatest effect. Furthermore, the results of the distance between sound source and eye position of the group with AV condition, suggested that only particular types of sound attract human eye position to the sound source. Finally, an analysis of the fixation duration between AV and V conditions showed that participants with AV condition move eyes more frequently than those with V condition.
paired with speech information than non-speech infor-mation (Vroomen & Stekelenburg, 2011). Other types of sound have been investigated less.
Auditory cues also influence visual perception. Previ-ous studies showed that when auditory and visual signals come from the same location, the sound can guide atten-tion toward a visual target (Perrott, Saberi, Brown, & Strybel, 1990; Spence & J.Driver, 1997). Moreover, other studies demonstrated that synchronous auditory and visu-al events can improve visuvisu-al perception (Vroomen & De Gelder, 2000; Dalton & Spence, 2007). Another study considered the situation in which audio and visual infor-mation do not come from the same spatial place. The result showed that the synchronous sound ``pip'' makes the visual object pop out from its complex environment phenomenally (Van der Burg, Olivers, & Bronkhorst, 2008).
Inspired by these studies of the influence of audio-visual interaction on human behavior, computer scientists have tried to simulate this attentional mechanism to cre-ate a computational attention model, which helps to select important objects from a mass of information. This com-putational attention model provides another way to better understand the attentional mechanism. Furthermore, these computational attention models are useful for applica-tions such as video coding (Lee, Simone, & Ebrahimi, 2011) and video summarizing (Wang & Ngo, 2012).
Studies in cognitive neurosciences show that eye movements are tightly linked to visual attention (Awh, Armstrong, & Moore, 2006). The study of eye move-ments enables a better understanding of the visual system and the mechanisms in our brain to select salient regions. Furthermore, eye movements also represent the influence of audio-visual interaction on human behavior. Quigley and her colleagues (Quigley, Onat, Harding, Cooke, & König, 2008) investigated how different locations of sound source (played by loudspeakers in different loca-tions: left, right, up and down) influence eye movement in static images (Onat, Libertus, & König, 2007). The results showed that eye movements were spatially biased towards the regions of the scene corresponding to the location of the loudspeakers. Auditory influences on visual location also depend on the size of the visual target (Heron, Whitaker, & McGraw, 2004). In videos, during dynamic face viewing, sound influences gaze to different face regions (Võ, Smith, Mital, & Henderson, 2012). Although the interaction of features within audio and visual modalities has been actively studied, the sound effect on human gaze when looking at videos with their original soundtrack has been explored less. Our previous research (Song, Pellerin, & Granjon, 2011) showed that sound affects human gaze differently depending on the type of sound, and the effect is greater for the on-screen
speech class (the speakers appear on screen) rather than the non-speech class (any kind of audio signal other than speech) and the non-sound class (intensity below 40 dB). Recently, (Coutrot, Guyader, Ionescu, & Caplier, 2012) showed that original soundtrack of videos impacts on eye position, fixation duration and saccade amplitude, and (Vilar et al., 2012) using non-original soundtrack also concluded that sound affects human gaze.
In our previous research, we only considered three sound classes and no strict control of sound event over time. In this paper, we provide a deeper investigation of the question of which type of sound influences human gaze with a controllable sound. A preliminary analysis was published in (Song, Pellerin, & Granjon, 2012). We first describe an audio-visual experiment with two groups of participants: with original soundtrack called audio-visual (AV) condition; and without sound called audio-visual (V) condition. Then, we observe the difference of eye position between two groups of participants for thirteen more refined sound classes. The fixation duration be-tween groups with AV and V conditions is also studied.
Method
Participants
Thirty-six human participants (18 women and 18 men, aged from 20 to 34) took part in the experiment. 18 par-ticipants first viewed 5 clips with V condition, then viewed another 5 clips with AV condition. The other 18 participants first viewed 5 clips with AV condition, then viewed another 5 clips with V condition. Each clip ap-peared with AV and V condition in the same number of occurrences. All participants had normal or corrected-to-normal vision, and reported corrected-to-normal hearing. They were ignorant to the purpose of the experiment.
Materials
In this experiment, eighty video excerpts (called clip snippets) were chosen from heterogeneous sources of films (with original soundtrack). Each clip snippet lasted around 200 frames (8 seconds). The sum of all the clip snippets represents 16402 frames (around 11 minutes). In the visual domain, each clip snippet consists of just one shot. In the audio domain, the sound signal is divided into two parts. The first sound lasts to about the middle of the clip snippet, and is then followed by the second sound. In order to prevent the participants from understanding the language in the video, we chose foreign languages for each participant, such as Chinese, Indian, and Japanese etc. An example of a clip snippet is presented in Fig. 1. The 80 clip snippets were then recombined into 10 clips
Journal of Eye Movement Research Song, G., Pellerin, D., Granjon, L. (2013)
6(4):1, 1-13 Sounds influence gaze differently in videos
Figure 1. An example of several frames of a clip snippet (one shot) with the associated soundtrack (time-frequency representation). The soundtrack is a succession of two types of sound. In this example, the first sound is birds singing, and the second sound is the boy in the center talking. Frame 1 corresponds to the beginning of the second sound.
(Carmi & Itti, 2006), each clip being the concatenation of 8 clip snippets from different film sources and different sound classes of the second sound. The sound amplitude of each clip snippet was “normalized” in order to reduce the amplitude transition between two successive clip snippets, so as to partially preserve the original sound amplitude information. Normalization is defined as fol-lows:
( )
where, is the mean amplitude of each clip snippet, and is the mean of the mean amplitude for an entire clip. All the clip snippets were converted in gray level to the same video format (25 fps, 842×474 pixels/frame). Two sets of stimuli were built from these clips, one with AV condition (frames + soundtrack), and the other one with V condition (frames only).
We only observe the behavior of human gaze after the onset of the second sound. The aim is to analyze the effect of an audio change unrelated to the visual changes that occur when a new clip snippet starts. Furthermore, the first sound lasts at least two seconds before the sec-ond sound occurs, which is enough to avoid center bias (Tseng, Carmi, Cameron, Munoz, & Itti, 2009). This so called ``center bias" is the relocation of gaze near the center of the frame to collect information about the new visual scene. It influences eye movement when viewing dynamic scenes (Dorr, Martinetz, Gegenfurtner, & Barth, 2010).
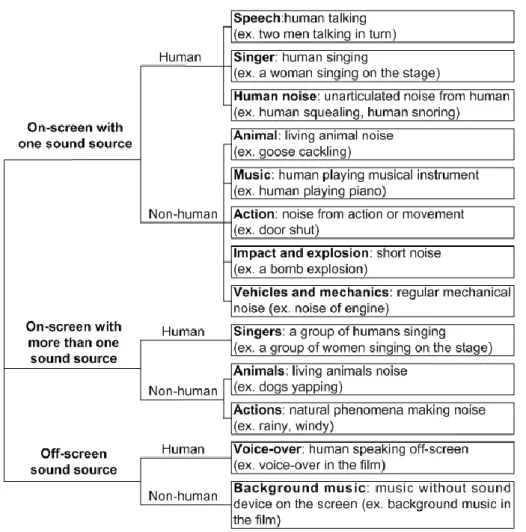
We classify the second sound into thirteen classes (see Fig. 2), based on other research (Niessen, Maanen, & Andringa, 2008). For each class, there are 5 to 11 clip
snippets. The numbers of clip snippets and frames in each class are given in Table 1.
The difference between clusters of classes ``on-screen with one sound source" and ``on-screen with more than one sound source" is the number of sound sources on the screen. Here, we call one sound source a visual event in the scene associated with the soundtrack. In this instance the sound can be associated with a spatial location. The ``off-screen sound source" cluster is different from the other two in that there is no sound source on the screen when the second sound appears.
Table 1
Number of clip snippets and frames in each class
Sound class Snippet number frame number Speech Singer Human noise Animal Music Action
Impact and explosion Vehicles and mechanics Singers Animals Actions Voice-over Background music 11 5 6 5 7 6 8 6 5 5 6 5 5 2729 790 1087 1054 1140 1309 1832 1119 928 898 1110 1352 1054 Total 80 16402
Before this experiment, we did a pre-experiment to validate the classification of the second sound. In this pre-experiment, the participant heard only the second sound from the headphone, then chose the sound class from the proposed list (Fig. 2). If the participants chose the same class as we proposed, we considered it as a
correct recognition. 5 participants took part in this experi-ment. For each class, the minimal correct classification rate is 80%, and the mean correct classification rate is 90%. Hence, we can conclude that the classification is suitable for an audio-visual experiment.
Figure 2. Hierarchical classification of the second sound, including 3 sound clusters, which consist of 13 sound classes.
Procedure
Human eye position was tracked by an Eye tracker Eyelink II (SR Research). The clips were shown by Soft-Eye (a software tool) synchronized with the eye tracker (Ionescu, Guyader, & Guérin-Dugué, 2009). During the experiment, the participants were sitting in front of a 19-inch color monitor (60 Hz refresh rate) with their chin supported. The viewing distance between the participant and the monitor was 57 cm. The usable field of vision was 35°×20°. A headphone carried the stereo sound.
The apparatus did not allow participants to locate the sound source on the small size of the video because of the stereo headphone. A 9-point calibration was carried out every five clips. Before each clip, we presented a drift correction, then a fixation in the center of the screen. Fig. 3 illustrates the time course of this experimental trial. Participants were asked to look at the ten clips without any particular task. All ten clips were presented to each participant in random order. As said above, each partici-pant watched half the clips with AV condition and half the clips with V condition.
Journal of Eye Movement Research Song, G., Pellerin, D., Granjon, L. (2013)
6(4):1, 1-13 Sounds influence gaze differently in videos
5
Figure 3. Time course of two clips with AV condition. To control the gaze of participant, a fixation cross is pre-sented at the center of the screen before each clip. This sequence is repeated for five clips with AV condition and five clips with V condition.
Metrics
Kullback-Leibler divergence. In order to measure the
difference of eye position between two groups (with AV and V conditions) for each frame, a metric named Kull-back-Leibler divergence was calculated. The Kullback-Leibler divergence metric was already adopted to com-pare distributions of eye position between groups by other researchers, such as (Tatler, Baddeley, & Gilchrist, 2005). For a given frame, a 2-D Gaussian was added to each eye position to build the density map of a group of participants with AV condition (Mhav), respectively with V condition (Mhv). The standard deviation of the Gaussi-an was chosen to have a diameter at half the height of the Gaussian equal to 2°of visual angle. Here, we use sym-metric Kullback-Leibler divergence (KL). For each frame, we calculated the following equation:
(∑ ∑ ) where q represents the same size of video frame (842×474 pixels). High KL values represent large differ-ences between two distributions of eye position.
Linear Correlation Coefficient. To confirm the
meas-urement, two other metrics are adopted. One is the linear correlation coefficient, noted as cc. The cc describes the
linear relationship between the respective probability
densities of two data sets. It is defined as follows:
where, Mhav (respectively Mhv) represents the eye position density maps with the AV (respectively V) condition,
cov(Mhav,Mhv) is the covariance value between Mhav and
Mhv.
For cc, a value of zero indicates no linear relationship between the two maps: there is no correspondence be-tween the eye position of the two groups with AV and V conditions, and higher values of cc indicate higher corre-spondence between the eye positions of the two groups.
Median distance. The other metric we adopted is
me-dian distance md. It is defined as:
( )
where, C is the group with AV condition and C’ is the group with V condition. di,j is the Euclidean distance
between eye positions of participants i and j, who belong respectively to the group with AV condition and the group with V condition.
Distance to the sound source. From observation, we
notice that participants with AV condition seemed to move their eye to the sound source after the beginning of the second sound. To verify this assumption, we located the approximate coordinates of the center of the sound source manually. Then, the Euclidean distance between the eye position of each participant with AV condition and the sound source was calculated. The mean of these Euclidean distances gives the D value, which represents the distance of eye position to the sound source. A high D value represents a large distance from the sound source to eye position of participants from one group.
Results
In order to investigate the effect of sound on visual gaze, we analyzed the difference of eye position between participants with AV condition and with V condition. Fig.4 (a) shows an example of the eye positions of two groups of participants. Fig. 4 (b) shows an example of the density map of groups of participants with AV condition (Mhav) and with V condition (Mhv).
Comparison among three clusters of sound classes
We analyzed the Kullback-Leibler divergence (KL) between the eye position of the participants in two groups with AV and V conditions, among three clusters of clas-ses (see Fig. 2): screen with one sound source”, “on-screen with more than one sound source” and “off-“on-screen sound source”.
In this section, for each clip snippet, we investigated one second after the beginning of the second sound (from frame 6 to 30, to eliminate reaction time of about 5 frames). We used the ANOVA test to compare KL among different clusters of classes. This test requires the samples in each cluster to be independent samples. Because we consider continuous measurement over time, the eye position for most participants does not change much between two adjacent frames, they could not be consid-ered as independent samples. To solve this problem, we took the mean of KL values over one second (from frame 6 to 30 after the beginning of the second sound) as one independent sample.
(a) Eye positions of participants
(b) Density map of groups of participants
Figure 4. A sample frame in singer class of eye position of participants in groups with AV (red points) and with V condition (blue points), and corresponding density map of groups of participants with AV condition Mhav (red region) and with V condition Mhv (blue region).
In Fig. 5, with the ANOVA test, “off-screen sound source” presents the lowest KL among the three clusters of classes. The difference is significant between “on-screen with one sound source” and “off-“on-screen sound source” (F(1,63)=4.72, p=0.034), and also significant between “on-screen with more than one sound source” and “off-screen sound source” (F(1,25)=4.67, p=0.041). The difference between “on-screen with one sound source” and “on-screen with more than one sound source” is not significantly different (F(1,69)=0.03, p=0.859). These results indicate that one and more than one localiz-able sound sources lead to a greater distance between the groups with AV and V conditions compared to non-localizable sound source.
The results above were confirmed by two other met-rics: cc and md.
To verify that the effect measured is really due to the second sound, we performed the same calculation for a period of one second (25 frames, from frame -24 to 0) before the transition from first sound to second sound for all the classes. This “pre-transition” cluster (in Fig. 5) can be considered as a baseline, compared to the three other clusters. The difference is significant between “on-screen with one sound source” and “pre-transition” (F(1,133)=9.09, p=0.0031), and also significant between “on-screen with more than one sound source” and “pre-transition” (F(1,95)=4.65, p=0.034). The difference is not significant between “off-screen sound source” and “pre-transition” (F(1,89)=0.01, p=0.915). These results show that one and more than one localizable sound sources for the second sound lead to a greater distance between the groups with AV and V conditions compared to pre-transition (first sound).
Figure 5. Kullback-Leibler divergence (KL) between participants with AV and V conditions in three clusters of classes: “on-screen with one sound source”, “on-screen
Journal of Eye Movement Research Song, G., Pellerin, D., Granjon, L. (2013)
6(4):1, 1-13 Sounds influence gaze differently in videos
7
with more than one sound source” and “off-screen sound source”, and compared to the “pre-transition” cluster. Larger KL values represent greater difference between groups with AV and V conditions.
To complete the previous study, we analyzed entropy variation between before and after sound transition. More precisely, in AV condition (respectively V condition) for each clip snippet, we calculated the mean of entropy for a period of one second after the transition (from frame 6 to 30) and subtracted the mean of entropy for one second before the transition (from frame -24 to 0). Then, we compared the results of entropy variation between the two conditions (AV and V) by using paired t-test. For “on-screen with one sound source” and for “on-screen with more than one sound source” clusters, the mean of entropy variation is significantly larger in AV condition compared to V condition (respectively t(53)=2.95,
p=0.004 and t(15)=2.52, p=0.023) (Fig. 6). Participants
with AV condition are not only attracted by salient re-gions from visual aspect, such as face, motion rere-gions, but also attracted by sound sources from audio aspect. For these two clusters, the entropy variation is negligible in V condition. For “off-screen sound source”, the entro-py variation is not significantly different between AV and V conditions (t(9)=0.84, p=0.42) (Fig. 6). In this case, participants with AV condition modify their behavior slightly compared with V condition.
Figure 6. Entropy variation between AV and V conditions, for “on-screen with one sound source”, “on-screen with more than one sound source”, and “off-screen sound source” clusters.
Analysis of thirteen sound classes
We analyzed the thirteen sound classes separately. We did not analyze sound effect directly through audio
information, but through the eye position of participants which are also based on visual information. In order to reduce the influence of visual information, we created a
baseline for statistical comparison by performing a
ran-domization (Edgington & Onghena, 2007): We fused two groups of participants with AV and V conditions into one set of 36 participants. We extracted 18 participants from this set randomly to create a new group called G1. The rest of the participants formed another new group, called G2. Afterwards, we calculated the KL between G1 and G2 for each frame. We repeated this procedure 5000 times, obtaining for each frame a distribution of 5000 random KL values (KLi , i=1,2,...5000). Then, we took
the mean of the 5000 KL values as the baseline (KLR).
This KLR , which is influenced by image only, is an
esti-mate of the KL that can be expected between two random groups of participants. Finally, we calculated the differ-ence (KLAVV - KLR) where KLAVV represents the difference
between participants with AV and V conditions. Because
KLAVV is caused by the effect of both image and sound,
and KLR is caused by the effect of image only, the
differ-ence (KLAVV - KLR) is mainly caused by the effect of
sound.
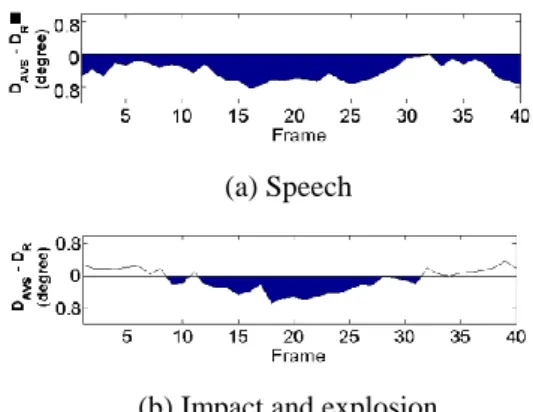
Fig. 7 shows the difference over time between KLAVV
and KLR for two classes: “speech” (human) and “impact
and explosion” (non-human). If (KLAVV - KLR) is above 0,
the difference between AV and V groups is greater than that between two random groups. The behavior over time is different for two presented sound classes.
(a) Speech
(b) Impact and explosion
Figure 7. Average difference (KLAVV - KLR) over time for
“speech” (11 clip snippets) and “impact and explosion” (8 clip snippets) classes. Frame 1 corresponds to the beginning of the second sound. Dark regions represent (KLAVV - KLR) over 0, suggesting that the difference
be-tween AV and V groups is greater than that bebe-tween two random groups.
We tried to find out which classes give a higher dif-ference between KLAVV and KLR. For successive frames,
the (KLAVV - KLR) values have a variance. Hence, to
quan-tify the sound effect, it is better to measure the effect of sound for each sound class over a certain duration rather than for each individual frame. We investigated over a sufficient period of one second (25 frames) from frame 6 to 30 after the beginning of the second sound. We com-pared KLAVV (the temporal mean of KLAVV over the 25
frames) to the distribution of KLi, where KLi is the
temporal mean of KLi between G1 and G2 over the 25
frames for random trial i. To estimate the probability of
i
KLbeing greater than KLAVV, we calculated p=n/5000,
where n is the number of KLi which are greater than AVV
KL .
Table 2 shows the results for frames 6 to 30 after the beginning of the second sound. The high KLAVV values
(therefore low p values) for the marked classes (with ■): speech, singer, human noise, and singers, show that hu-man voice affects visual gaze significantly (p<0.05). Table 2
Probability estimations of KLi values higher than KLAVV
(respectively with metrics of cc and md) from frame 6 to 30 after the beginning of the second sound for all the sound classes. Smaller p value represents a higher possibility that KL between groups with AV and V conditions is larger than KL between random groups. Sound class p (KL) p (cc) p (md) Speech ■ Singer ■ Human noise ■ Animal Music Action
Impact and explosion Vehicles and mechanics
0 0.001 0.001 0.113 0.394 0.215 0.792 0.137 0 0.002 0.006 0.067 0.126 0.088 0.232 0.194 0.011 0.013 0.015 0.698 0.063 0.744 0.993 0.127 Singers ■ Animals Actions 0.002 0.138 0.261 0.010 0.430 0.366 0.006 0.682 0.827 Voice-over Background music 0.779 0.895 0.592 0.558 0.982 0.309 To verify that the effect measured above is really due to the second sound, we perform the same calculation for a period of one second (25 frames) before the beginning of the second sound. Results of probability estimations of
i
KL values higher than KLAVV of all the sound classes
from frame -24 to 0 are higher than 0.1, suggesting that before the second sound, eye position of participants between groups with AV and V conditions are not signif-icantly different for all the sound classes.
The results above were confirmed by other two met-rics: cc and md.
Analysis of distance between sound source and eye
position
In the previous section, we showed that the Kullback-Leibler divergence KL between eye position of partici-pants with AV and V conditions is greater for speech, singer, human noise and singers classes than others. In this section, we want to verify the assumption that partic-ipants with AV condition moved their eye to the sound source after the beginning of the second sound. We only analyzed the ``on-screen with one sound source" cluster of sound classes. We first located the approximate coor-dinates of the center of the sound source manually. Then, we calculated the Euclidean distance between the eye position of each participant with AV condition and the sound source. The mean of these Euclidean distances gives the DAVS value, which is affected by both image and
sound information. Similarly, in order to reduce the influ-ence of visual information, we created a baseline for statistical comparison by performing a randomization (Edgington & Onghena, 2007). We considered the mean Euclidean distance between eye position of participants of G1 (consists of 18 participants, which are randomly selected from the set of all the participants in groups with AV and V conditions) and sound source (Di,
i=1,2...5000). We took the mean of 5000 distance values
as the baseline (DR), which was affected only by image
information. Afterwards, for each frame, we calculated
DAVS - DR for all the classes with one sound source. This
difference reflects the influence of the sound information. Fig. 8 shows the difference over time between DAVS
and DR for “speech” and “impact and explosion” classes.
When the values are negative, the group with AV condi-tion is closer to the sound source than the random group. Again, different sound classes behave differently.
To find out which classes give the higher difference between DAVS and DR and quantify the sound effect, we
investigate the same duration of one second (25 frames) as in previous analysis, from frame 6 to 30 after the be-ginning of the second sound. We compared DAVS (the
Journal of Eye Movement Research Song, G., Pellerin, D., Granjon, L. (2013)
6(4):1, 1-13 Sounds influence gaze differently in videos
9
mean of DAVS over the 25 frames) to the distribution of
i
D (i=1,2,...5000), where Diis the mean of Di between
G1 and sound source over the 25 frames for the random trial i. To estimate the probability of Di being smaller
than DAVS, we calculate p=n/5000, where n is the
num-ber of Di which are smaller than DAVS.
(a) Speech
(b) Impact and explosion
Figure 8. Average difference (DAVS - DR) over time for
“speech” and “impact and explosion” classes. Dark regions represent (DAVS - DR) below 0, suggesting that the
group with AV condition is closer to the sound source than the random group.
In Table 3, Di is smaller than DAVS (p<0.05), from
frame 6 to 30 after the beginning of the second sound, for speech, singer, human noise classes (marked with ■) suggesting that participants tend to move their eyes to the sound source only when they hear human voice.
Table 3
Probability estimation of Di being smaller than DAVS from
frame 6 to 30 after the beginning of the second sound for "on-screen with one sound source'' cluster.
Sound class p Speech ■ Singer ■ Human noise ■ Animal Music Action
Impact and explosion Vehicles and mechanics
0.041 0.039 0.002 0.283 0.058 0.292 0.062 0.849
Analysis of musical instrument subclass
Compared to human voice classes, which have been well discussed in recent decades, music class has been explored less. To better understand the influence of au-dio-visual interaction, we propose a deeper investigation of eye movement behavior of music class. In our music class database, four snippets are humans playing musical instruments. They represent the musical instrument sub-class. In this subclass, there is more than one face in the scene. However, only one person is playing an instrument (piano or guitar), when the corresponding music begins.
In musical instrument subclass, what is more attrac-tive to the participants? There is evidence that faces in the scene are preferred by the visual system compared to other object categories (Rossion et al., 2000 ; Langton, Law, Burton, & Schweinberger, 2008), and can be pro-cessed at the earliest stage after stimulus presentation (Ro, Russell, & Lavie, 2001). From our observation, we as-sume that a particular face -- Face of the player attracts more attention than other faces. In previous calculations, we know that the sound source in the scene was attractive for participants with AV condition in human voice sound classes. In the musical instrument subclass, do partici-pants have a preference for sound source, that is, the Musical instrument?
To measure which region (musical instrument or the face of the player) is more attractive to the participants, we calculate the Euclidean distance between the eye position of participants with AV condition and Musical instrument (DAVM). Respectively, we calculate the
Euclid-ean distance between the eye position of participants with AV condition and the Face of the player (DAVF). Again,
we introduce a baseline DRM, which is the mean
Euclide-an distEuclide-ance between rEuclide-andom group G1 Euclide-and Musical in-strument for 5000 randomization times. Respectively, the baseline DRF is the mean Euclidean distance between
random group G1 and the Face of the player.
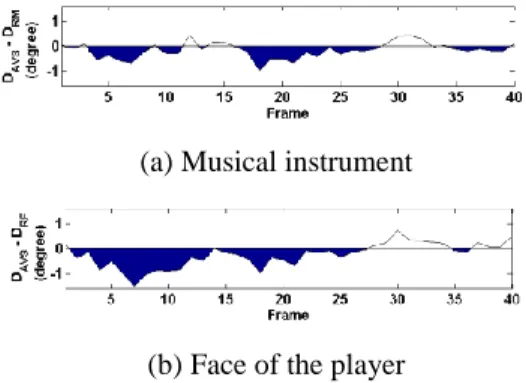
Fig. 9 illustrates the distances from group with AV condition to Musical instrument (a) and to Face of the player (b) over time. Here, the dark regions below zero represent smaller distances from the Face of the player or the Musical instrument. The Face of the player is reached more frequently after the beginning of the music sound until around frame 14. After that, both the Face of the player and the Musical instrument are reached somewhat equally.
To quantify the measurement, we further investigated a period of one second (25 frames), from frame 6 to 30 after the beginning of the second sound. The probability of DRM i (DRMi is the mean Euclidean distance between
p=0.164. The probability of DF i (DFi is the mean
Eu-clidean distance between G1 and Face of the player) being smaller than DAVF is p=0.042. The results indicate
that during this period of one second, participants move their eyes to the Face of the player rather than the Musi-cal instrument.
(a) Musical instrument
(b) Face of the player
Figure 9.Average distances (a) from Musical instrument (DAVM - DRM), (b) from Face of the player (DAVF - DRF) for
4 clip snippets of musical instrument subclass over time.
Fixation duration analysis
We also investigated the effect of sound on the distri-bution of fixation duration for the whole database. It is typical to study such parameters (Tatler, Hayhoe, Land, & Ballard, 2011). For each participant, we calculated the mean of fixation duration for each clip. A traditional method -- paired t-test was adopted. Per clip, AV condi-tion has a shorter average duracondi-tion of fixacondi-tion (6.17 frames, 247 ms) than V condition (6.82 frames, 273 ms), and the difference is significant (t(9)=2.479, p=0.035). Per participant, AV condition still has a shorter average duration of fixation (6.19 frames, 248 ms) than V condi-tion (6.75 frames, 270 ms), and the difference is also significant (t(35)=2.697, p=0.011). This means that the participants with AV condition tend to move their eyes more frequently compared to the participants with V condition. Additionally, this result is confirmed by a more recent method -- mixed effect model (Baayen, Da-vidson, & Bates, 2008).
Discussion
This study demonstrates that not only does human speech have a higher effect on human gaze when looking freely at videos, but also singer(s) and human noise. The Kullback-Leibler divergence (KL) between the groups with AV and V conditions is lower for
``off-screen sound source" cluster than for two ``on-``off-screen sound source" clusters. The result indicates that a change in auditory information affects human gaze, when the information is linked to a visual event in the video (Hida-ka, Teramoto, Gyoba, & Suzuki, 2010) (Gordon & Hib-berts, 2011). The reason is perhaps that synchronized audio-visual events capture attention rather than unpaired audio-visual stimuli (Van der Burg, Brederoo, Nieuwen-stein, Theeuwes, & Olivers, 2010). The entropy variation between before and after sound transition in AV condi-tion (compared to V condicondi-tion) shows that eye posicondi-tions of participants tend to be more dispersed after transition when the sound source(s) is on-screen.
By calculating the difference between KLAVV (the
temporal mean of KL between two groups of participants) and randomization distribution KLi, we conclude that
the difference between participants with AV and V condi-tions is greater for four human classes (speech, singer, human noise, and singers). To explain this difference, we assume that the participants with AV condition move their eyes to the sound source after the beginning of the second sound. The result of DAVS (mean of distance
between participants with AV condition and sound source) is smaller than Di (randomization distribution), and
implies that after the auditory stimuli, participants searched for the sound source, associated with auditory information in the scene. This kind of behavior is obvious when the auditory stimulus is a human voice. This kind of behavior has also been observed by other researchers, but only for speech class. Kim and colleagues (Kim, Davis, & Krins, 2004 ; Tuomainen et al., 2005) provided evidence that acoustic and visual speech is strongly inte-grated only when the perceiver interprets the acoustic stimuli as speech. More recently observations of the mechanisms of speech stimuli and visual interaction demonstrated that lip-read information was more strongly paired with speech information than non-speech infor-mation (Vroomen & Stekelenburg, 2011).
Temporally, reaction time of participants is also ob-served. In Fig. 7 (a), the KL value between participants with AV and V conditions of ``speech" class increases around frame 7. However, in Fig. 8 (a), the eye position of participants with AV condition seems to reach the sound source after frame 14. It takes 7 frames on average (280 ms) for a participant to move their eyes to the sound source after hearing the second sound.
Face in the scene not only influences human voice sound classes, but also influences the musical instrument
Journal of Eye Movement Research Song, G., Pellerin, D., Granjon, L. (2013)
6(4):1, 1-13 Sounds influence gaze differently in videos
11
subclass. In this subclass, the distance between the eye position of participants with AV condition and the Face of the player is smaller than the distance between the eye position of participants with AV condition and the Musi-cal instrument. The visual event linked to the acoustic stimuli is the instrument, not the face. The result shows that after the participants hear music, first they tend to move their eyes to the Face of the player. After a while, both the human face and musical instrument are reached. One possible explanation for this behavior is that partici-pants responded faster to social stimuli (like faces) com-pared to non-social stimuli (like houses) (Escoffier, Sheng, & Schirmer, 2010). This special attractability of the Face of the player among other faces only appears when the music (from a musical instrument) can be heard simultaneously.
The comparison of fixation duration between the groups of participants with AV and V conditions was carried out for the whole database. We observed that the group with AV condition had a shorter fixation duration than the group with V condition. It may be caused by the fact that the responses of the participants to bimodal audio-visual stimuli were significantly faster than uni-modal visual stimuli (Sinnett et al., 2008). Recent re-search from (Zou, Mller, & Shi, 2012) also confirms that synchronous audio-visual stimuli facilitate visual search performance, and have shorter reaction time than visual stimuli only.
In conclusion, our results provide evidence of sound influence on gaze when looking at videos. This sound effect is different depending on the type of sounds. Sound effect can be measured only when the sound is human voice. More precisely, human voice drives participants to move their eyes towards the sound source. In future work, by simulating this eye movement behavior influenced by sound, it would be interesting to add auditory influence to the traditional computational visual saliency model (such as (Itti, Koch, & Niebur, 1998)) to create an audio-visual saliency model. It could help to increase the prediction accuracy when the model is applied to videos with an original soundtrack.
References
Alho, K., Salonen, J., Rinne, T., Medvedev, S. V. Hug-dahl, K., & Hmlinen, H. (2012). Attention related modulation of auditory-cortex responses to speech. sounds during dichotic listening. Brain Research, 1442(9), 47-54.
Awh, E., Armstrong, K. M., & Moore, T. (2006). Visual and oculomotor selection: Links, causes and implica-tions for spatial attention. Trends in Cognitive
Scienc-es, 10(3), 124-130
Baayen, R. H., Davidson, D. J., & Bates, D. M. (2008). Mixed-effects modeling with crossed random effects for subjects and items. Journal of Memory and
Lan-guage, 59, 390-412
Carmi, R., & Itti, L. (2006). Visual causes versus corre-lates of attentional selection in dynamic scenes.
Vi-sion Research, 46, 4333-4345.
Cohen, M. M., & Massaro, D. W. (1994). Development and experimentation with synthetic visible speech.
Behavior Research Methods, Instruments, and Com-puters, 26, 260-265.
Corneil, B. D., van Wanrooij, M., Munoz, D. P., & Van Opstal, A. J. (2002). Auditory-visual interactions sub-serving goal-directed saccades in a complex scene.
Journal of Neurophysiology, 88(1), 438-454.
Coutrot, A., Guyader, N., Ionescu, G., & Caplier, A. (2012). Influence of soundtrack on eye movements during video exploration. Journal of Eye Movement
Research, 5(4), 1-10.
Dalton, P., & Spence, C. (2007). Attentional capture in serial audiovisual search tasks. Perception &
Psycho-physics, 69, 422-438.
Dorr, M., Martinetz, T., Gegenfurtner, K. R., & Barth, E. (2010). Variability of eye movements when viewing dynamic natural scenes. Journal of Vision, 10(28), 1-17.
Edgington, E. S., & Onghena, P. (2007). Randomization tests. Chapman Hall.
Escoffier, N., Sheng, D. Y. J., & Schirmer, A. (2010). Unattended musical beats enhance visual processing.
Gordon, M. S., & Hibberts, M. (2011). Audiovisual speech from emotionally expressive and lateralized faces. The Quarterly Journal of Experimental
Psy-chology, 64(4), 730-750.
Heron, J., Whitaker, D., & McGraw, P. V. (2004). Senso-ry uncertainty governs the extent of audio-visual in-teraction. Vision Research, 44, 2875-2884.
Hidaka, S., Teramoto, W., Gyoba, J., & Suzuki, Y. (2010). Sound can prolong the visible persistence of moving visual objects. Vision Research, 50, 2093-2099.
Ionescu, G., Guyader, N., & Guérin-Dugué, A. (2009). Softeye software.
IDDN.FR.001.200017.000.S.P.2010.003.31235. Itti, L., Koch, C., & Niebur, E. (1998, Sept.). A model of
saliency-based visual attention for rapid scene analy-sis. Transaction on Pattern Analysis and Machine
In-telligence, 20(11), 1254-1259.
Jeffers, J., & Barley, M. (1971). Speech reading (lipread-ing). Springfield.
Kim, J., Davis, C., & Krins, P. (2004). Amodal pro-cessing of visual speech as revealed by priming.
Cog-nition, 93, B39-B47.
Langton, S. R. H., Law, A. S., Burton, A. M., & Schweinberger, S. R. (2008). Attention capture by faces. Cognition, 107, 330-342.
Lee, J. S., Simone, F. D., & Ebrahimi, T. (2011). Subjec-tive quality evaluation of foveated video coding using audio-visual focus of attention. IEEE Journal of
Se-lected Topics in Signal Processing, 5(7), 1322-1331.
McGurk, H., & MacDonald, J. (1976). Hearing lips and seeing voices. Nature, 264, 746-748.
Niessen, M. E., Maanen, L. van, & Andringa, T. C. (2008). Disambiguating sounds through context. IEEE
International Conference on Semantic Computing, 88
- 95.
Onat, S., Libertus, K., & König, P. (2007). Integrating audiovisual information for the control of overt atten-tion. Journal of Vision, 7(10), 1-16.
Perrott, D. R., Saberi, K., Brown, K., & Strybel, T. Z. (1990). Auditory psychomotor coordination and visu-al search performance. Perception & Psychophysics, 48, 214-226.
Quigley, C., Onat, S., Harding, S., Cooke, M., & König, P. (2008). Audio-visual integration during overt visu-al attention. Journvisu-al of Eye Movement Research, 1, 1-17.
Ro, T., Russell, C., & Lavie, N. (2001). Changing faces: a detection advantage in the flicker paradigm.
Psycho-logical Science, 12(1), 94-99.
Rosenblum, L. D., Schmuckler, M. A., & Johnson, J. Q. (1997). The mcgurk effect in infants. Perception &
Psychophysics, 59(3), 347-357.
Rossion, B., Gauthier, I., Tarr, M. J., Despland, P., Bruyer, R., Linotte, S., et al. (2000). The n170 occipi-to temporal component is delayed and enhanced occipi-to inverted faces but not to inverted objects: an electro-physiological account of face-specific processes in the human brain. Neuroreport, 11(1), 69-74.
Sinnett, S., Faraco, S. S., & Spence, C. (2008). The cooccurrence of multisensory competition and facili-tation. Acta Psychologica, 128(1), 153-161.
Song, G., Pellerin, D., & Granjon, L. (2011). Sound ef-fect on visual gaze when looking at videos. 19th Euro-pean Signal Processing Conference (EUSIPCO),
2034-2038.
Song, G., Pellerin, D., & Granjon, L. (2012). How differ-ent kinds of sound in videos can influence gaze.
In-ternational Workshop on Image Analysis for Multi-media Interactive Services (WIAMIS), 1-4.
Spence, C., & Driver, J. (1997). Audiovisual links in exogenous covert spatial orienting. Perception &
Psy-chophysics, 59, 1-12.
Summerfield, Q. (1987). Some preliminaries to a com-prehensive account of audio-visual speech perception. In B. Dodd & R. Campbell (Eds.). Hearing by eye:
The psychology of lip-reading, 3-52, London:
Erl-baum.
Tatler, B. W., Baddeley, R. J., & Gilchrist, I. D. (2005). Visual correlates of fixation selection: effects of scale and time. Vision Research, 45, 643-659.
Tatler, B. W., Hayhoe, M. M., Land, M. F., & Ballard, D. H. (2011). Eye guidance in natural vision: Reinter-preting salience. Journal of Vision, 11(5), 1-23. Tseng, P. H., Carmi, R., Cameron, I. G. M., Munoz, D. P.,
& Itti, L. (2009). Quantifying center bias of observers in free viewing of dynamic natural scenes. Journal of
Journal of Eye Movement Research Song, G., Pellerin, D., Granjon, L. (2013)
6(4):1, 1-13 Sounds influence gaze differently in videos
13
Tuomainen, J., Andersen, T. S., Tiippana, K., & Sams, M. (2005). Audio-visual speech perception is special.
Cognition, 96(1), B13-B22.
Van der Burg, E., Brederoo, G., Nieuwenstein, M. R., Theeuwes, J., & Olivers, C. N. (2010). Audiovisual semantic interference and attention: Evidence from the attentional blink paradigm. Acta Psychologica, 134(2), 198-205.
Van der Burg, E., Olivers, C. N. L., & Bronkhorst, A. W. (2008). Pip and pop: nonspatial auditory signals im-prove spatial visual search. Journal of Experimental
Psychology: Human Perception and Performance,
34(5), 1053-1065.
Vilar, A., Duchowski, A. T., Orero, P., Grindinger, T., Tetreault, S., & di Giovanni, E. (2012). How sound is the pear tree story? testing the effect of varying audio stimuli on visual attention distribution. Perspectives:
Studies in Translatology, 20(1), 55-65.
Võ, M. L. H., Smith, T. J., Mital, P. K., & Henderson, J. M. (2012). Do the eyes really have it? Dynamic allo-cation of attention when viewing moving faces.
Jour-nal of Vision, 12(13), 1-14.
Vroomen, J., & De Gelder, B. (2000). Sound enhances visual perception: cross-modal effects of auditory or-ganization on vision. Journal of Experimental
Psy-chology: Human Perception and Performance, 26,
1583- 1590.
Vroomen, J., & Stekelenburg, J. J. (2011). Perception of intersensory synchrony in audiovisual speech: not that special. Cognition, 118, 75-83.
Wang, F., & Ngo, C. W. (2012). Summarizing rushes videos by motion, object, and event understanding.
IEEE Transaction on Multimedia, 14(1), 76-87.
Zou, H., Mller, H. J., & Shi, Z. (2012). Non-spatial sounds regulate eye movements and enhance visual search. Journal of Vision, 12(5), 1-18.