Laser and Particle Beams (1996), vol. 14, no. 3, pp. 347-368 3 4 7 Printed in the United States of America
Study of multicharged heavy ion generation
from CO2 laser-produced plasma
By V.YU. BARANOV,*| K.N. MAKAROV,*t
V.C. ROERICH,** YU.A. SATOV,** A.N. STAROSTIN,*t
A.E. STEPANOV,** B.YU. SHARKOV,*
K. LANGBEIN.t AND T.R. SHERWOODf
•Institute for Theoretical and Experimental Physics, 117257, Moscow, Russia tEuropean Organization for Nuclear Research (CERN),
PS Division, CH-1211 Geneve 23, Switzerland tTRINITI, Troitsk, 142092, Moscow Region, Russia
(Received 29 March 1996; accepted 17 April 1996)
The results of lead ion generation with charge state from Pb10+ to Pb35+ from laser-heated plasma are presented. CO2 lasers producing 10.6-/xm wavelength radiation at power den-sities in the range 4-10"-6-1014 W/cm2 in TBKI and CERN were used. Results of detailed numerical simulations presented in the paper are in good agreement with the experimental data. Work done in collaboration with CERN, ITEP, and TBKI was aimed at the specifi-cation of requirements for a laser system that will be able to drive an ion source for the hadron collider (LHC) at CERN.
1. Introduction
The results of three years of investigative work conducted by the collaboration of the Institute for Theoretical and Experimental Physics (ITEP, Russia), the Troitsk Branch of Kurchatov Institute of Atomic Energy (TBKI, Russia), and the European Organization for Nuclear Research (CERN) are presented. The aim of this work was to carry out experi-mental and theoretical investigations in order to clarify the possibilities of laser-driven heavy ion source development for the preinjector for the large hadron collider (LHC) at CERN (CERN Report 1991). The LHC project assumes the following ion beam parameters at the entry to the first preaccelerator, the so-called RFQ:
• Element and charge state Pb25+ • Average current 10 mA • Current pulse duration >6 us • Extraction voltage 80 kV • Repetition frequency >1 Hz • Operation resource >106.
The use of laser radiation for concentrations of energy in small volumes makes it pos-sible to create high-temperature dense plasma {Te > 1 keV) and, as a consequence, to
get a large amount of highly stripped ions occupying a small volume in phase space (emit-tance ~ 10~2TT mm-mrad). Therefore, a laser-driven ion source is a good approach to
sat-isfying the requirements listed above. In fact, the ion source parameter list is based on laser ion source capabilities (Sherwood 1992). Among all known and designed types of lasers, the CO2 laser has some advantages that make it a favorable candidate for a real ion source: high efficiency (high output energy) and advanced level of technical development, which results in high reliability of the laser facility.
Taking into account the present high level of CO2 laser system development, one may hope that the operation of an ion source based on such a laser will be reliable enough in real time in an operational regime.
At the TBKI, the study and development of CO2 laser systems began in the early 1970s for several applications (Baranov et al. 1974, 1975, 1976a,b,c, 1978, 1979, 1984; Anisimov
et al. 1980a,b), including the study of high-temperature plasma heated by CO2 laser radi-ation (Akimov et al. 1983, 1985). Although the main efforts were directed to the study of the overcritical plasma region of light-element targets based on X-ray radiation spectra, accumulated knowledge and experimental technique formed the base for the present research.
Numerous works on ion generation in laser-produced plasma done over more than 20 years in different laboratories and our own experience at CERN, ITEP, and TBKI made it possible to specify the CO2 laser power density range required for solution of the prob-lem. This value was estimated to lie between 6-1012 and 3-1013 W/cm2. For this region there were no data on lead ion generation available in the literature. The problem there-fore was to study the specific features of lead ion beam creation in this range of power den-sities of 10.6-/xm laser radiation and specify the target irradiation conditions. These conditions had to be optimal for the generation of the required number of ions in a cer-tain charge state and match the other requirements of the preinjector. As a first step it was required to define the optimum laser pulse duration and efficiency of CO2 lasers with respect to ion generation. Another question is the size of the focal spot and, closely con-nected to it, the value of the total laser energy. It is also necessary to know the energy and the ion spectra of plasma expanding over large distances (2-3 m) from the target surface. At the beginning of the work, the importance of the expanding plasma recombination and, hence, the possible loss of ion charge was not completely clear.
The problems mentioned above can be overcome successfully only if the experiments are supported by simultaneous numerical studies. Therefore, a sophisticated numerical model that was able to describe the different stages of ion generation from heating to the deep expansion stage was developed. The formation of highly charged ions from a laser-heated solid target is a very complex process; a complete enough theoretical model is not yet devel-oped. Nevertheless, the experience in the development of numerical models at the TBKI for laboratory X-ray lasers, laser-produced plasma for ICF, powerful Z-pinches, dynam-ics of supersonic plasma flows, and also the simulation of ion sources at the ITEP have resulted in the development of the TBKI' 2D hydrodynamics model, which is able to describe both the flow of laser-heated plasma and the kinetics of ionization-recombination processes during heating and free expansion. The model, as is shown below, is in quite good agree-ment with the experiagree-mental data.
2. Experimental facilities and technique
The main part of the investigations was performed on a laser facility TIR-1, which is described in detail in Anisimov et al. (1980a,b). Some experiments were made at CERN with a Lumonics CO2 laser TEA 601, and also at the ITEP and GSI with a CO2 laser designed at the TBKI.
2.1. Layout of TIR-1 laser
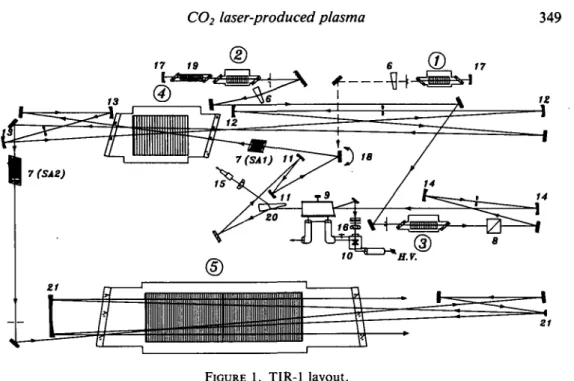
Figure 1 shows the scheme of the laser facility. In general, the laser installation consists of a front part and final amplifier (5). The front part consists of two oscillators (1, 2), a preamplifier (3), and a triple-pass amplifier (4). Oscillators are of different types to
gener-CO2 laser-produced plasma 349
FIGURE 1. TIR-1 layout.
ate different pulse shapes. The main part of each oscillator is a self-sustained discharge mod-ule that has the following parameters: active volume of 20 x 20 x 380 mm3, mixture CO2/N2/He = 4/1/5, output energy of 250 mJ, pulse duration of 50 ns, small signal gain coefficient of 0.04 cm""1, repetition rate of 3 Hz, and wavelength of 10.59 (tm (10P20 tran-sition). The cavity of the oscillator (1) was designed so as to generate the shortest pulse in the free running regime. It is formed by a concave mirror (17) (radius of curvature 6 m) and a germanium wedge (6) with plane surfaces, so that only one surface reflects the light into the cavity (3697b reflection coefficient). An iris diaphragm is used to select a single fun-damental transverse mode and to obtain a small beam divergence. The distance between the mirror and the wedge is about 110 cm. The mirror (18) in figure 1 can be adjusted to send the beam from either of the oscillators, (1) or (2), to the triple pass amplifier (4).
A hybrid oscillator (2) in combination with a preamplifier (3) and an electrooptical shutter is used to form short pulses of durations of up to 0.3 ns. It is similar to oscil-lator (1) but with the following additional elements: a low pressure tube (19) (to select a single longitudinal mode), operating at the active medium pressure of 4-6 torr (mixture CO2/N2/He = 1/1/8), and diffraction grating with 100 lines/mm in a near-autocollimating regime (to select the 10P20 transition). The resulting pulse shape of this oscillator has a smooth form with a duration of 100 ns and an output energy of 150 mJ. Production of a smooth pulse is necessary for the stable operation of the electrooptical shutter. After the preamplifier (3), the laser beam passes through a polarizer (8), a spatial filter formed by mirrors (11), and goes to the GaAs electrooptical crystal (9). First, the surface of the crys-tal has a slight inclination to the axis, so that 25% of the radiation is reflected toward the laser-triggered spark gap, which triggers a high-voltage electrical pulse. The lens (16) focuses radiation into the gap, and the attenuators are adjusted so that the moment of triggering coincides with the peak of the laser pulse. After reflection from a surface of the germa-nium wedge (20), the laser pulse has a duration that is roughly equal to that of the electri-cal pulse initiated by the laser-triggered spark gap (4 ns in this case) and an energy of about
1 mJ. The remaining radiation goes through the germanium wedge to the photodetector (15), which monitors the moment of triggering. Before the 4-ns laser pulse enters the first pass of the triple-pass amplifier, it goes through a spatial filter formed by confocal mir-rors (11) and a saturable absorber cell SAL
The triple-pass amplifier is an electron beam controlled unit having the following prop-erties: active volume of 150 x 150 x 1000 mm3, small signal gain coefficient of 0.05 cm"1, an electron beam voltage of 200 kV.
The system of spatial filters (11-14) at the front part was designed and adjusted to achieve two main goals: to form a diffraction limited divergence of the laser beam and to protect the front-part optics from damage due to back-reflected radiation. The radiation reflected by the target back toward the amplifiers would have an intensity sufficiently large to dam-age the front-part optical elements. However, the air breakdown occurring inside each of the spatial filters attenuates the radiation and prevents this from damaging the optics. It is important to avoid air breakdown inside any spatial filter during amplification of the oscillator pulse; therefore, in the optical design, higher pulse energies correspond to larger radii of curvature of the spatial filter mirrors.
Gaseous saturable absorber cells SA1 and SA2 are used to increase the contrast ratio (energy of the main pulse to energy of the prepulse) and to provide the optical isolation necessary to stop self-lasing. The nanosecond pulse contrast ratio value is increased from 40 at the electrooptical shutter exit up to 107 at the target. Cell SA1 has a length of 120 mm and is filled with sulphur hexafluoride (SF6) gas at a pressure of 2 torr. Cell SA2, length 280 mm, contains a mixture of 1.25% SF6) 50% FC143, and 48.5% FC1113 at a pres-sure of 17 torr. The energy of the laser pulse at the exit of the triple-pass amplifier is about 2 J, and the diameter of the beam is 22 mm.
The final amplifier (5) has, in general, the same design as a triple-pass amplifier but is more powerful. Its parameters are: active volume of 300 x 300 x 1500 mm3, small signal gain coefficient of 0.03 cm"1, and electron beam voltage of 300 kV. An off-axis telescope composed of two mirrors (21) is mounted around the amplifier for efficient energy extrac-tion. The output beam has a diameter of 220 mm and an energy between 30 and 300 J, depending on pumping conditions and pulse shape.
Experiments at the TIR-1 facility have been performed using two types of optical schemes. The first type includes a full scheme of short CO2 laser pulse formations, while the sec-ond scheme is a single-mode CO2 laser generator based on a TIR-1 amplifier (4) (figure 1). The relative simplicity of the latter permits a large amount of experiments to be carried out. The spatial properties of laser radiation formed by means of spatial filters and a matched diaphragm correspond to the diffraction divergence of the output beam. It was tested with special measurements of intensity distribution in the focal plane using an infrared radia-tion sensibilizaradia-tion technique for photofilms. The measured intensity distriburadia-tions then were compared with the results of a numerical calculation of the intensity distribution for real experiments geometry.
This beam is transmitted through a sodium chloride wedge and sodium chloride vacuum window into the target chamber. The light reflected off the wedge surfaces is used to mon-itor the pulse shape and the energy during the experiment. A spherical mirror objective
F/3 allows the radiation to be focused into a spot with near-Gaussian distribution in the
central part of -65-fj.m diameter on the l/e level. It is worth mentioning that in this par-ticular case the laser spot diameter slightly exceeded the diffraction one due to spherical aberrations of the mirror objective F/3. The central part of the spot contained 60-70% of the total energy. The power density in the focal spot center was as large as 6-1014 W/cm2 for T = 2.5 ns FWHM pulse. For T = 30 ns, the power density was ~2-1013 W/cm2.
CO2 laser-produced plasma 351
The full optical scheme of TIR-1 was used to form 100-J pulses of 2.5-ns duration. The output energy for longer pulses (30 ns) was restricted to a value of ~40 J due to specific features of the scheme, which were designed specially for short pulses (<3 ns).
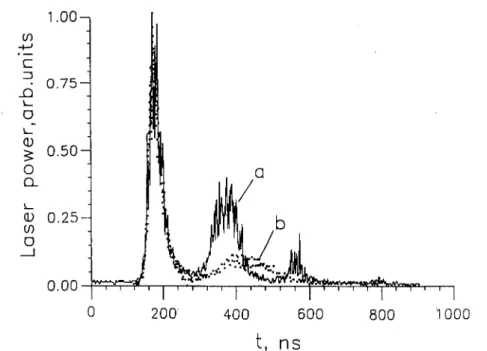
In most of our research program experiments the single-mode laser generator of 17 1 volume, pumped by electric discharge, sustained by a pulsed electron beam of 1.6-/*s FWHM duration was used. Radiation was formed by unstable resonator of 2.7-m length and magnification M = 3.07. The output beam of diameter 150 mm had energy up to 100 J (for the mixture CO2/N2/He = 4/1/5 at atmospheric pressure). A temporal shape of the laser pulse was typical for atmospheric pressure CO2 lasers with longitudinal modes self-locking (figure 2b). The envelope curve of a signal consists of the first peak (—30-ns FWHM) and a relatively long (~l-/*s) tail. The gas mixture was chosen to minimize energy in the tail and to maximize power of the first peak. In our case, the first peak contains about 50-60% of the total energy, which is practically the upper limit for the CO2 laser operating in free-running generation near the maximum output power. A further decrease of the energy contained in the pulse tail can be achieved only at the price of output power decreasing.
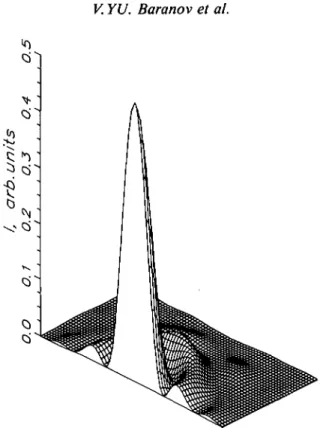
For testing the generator radiation spatial characteristics the far-field radiation distri-bution was studied. The pulse was attenuated to the desirable power level by means of CaF2 optical filters and then was focused by a long-focus spherical mirror F = 33 m. The focal spot was registered on thermosensitive paper for various attenuation levels. This pro-vided information on the characteristics of the focal distribution (central diffraction spot diameter, first ring diameter, etc.). The second part of the study was the measurement of the central diffraction spot (first dark ring diameter) energy content. Then the result was compared with one from numerical simulation (figure 3) of a plane-wave diffraction per-formed for real geometry of unstable cavity.
1.00-,
1000
FIGURE 2. TBKI laser generator pulse temporal shape: (a) with laser-plasma coupling for additional optical path; (b) without laser-plasma coupling (shielded target).
FIGURE 3. Far-field laser radiation distribution (numerical simulation).
Comparison has shown that the far-field distribution of laser radiation is well described by a plane-wave diffraction on a resonator ring opening 150/50 mm. For example, the mea-sured central spot (d = 6 mm) energy content was (55 ± 10)% while the numerical result was 65% for the same diameter. Use of the mirror objective introduced small spherical aberrations, so that the central spot diameter was -50 pm on the l/e level and the power density at the target was as high as 4-1013 W/cm2 in a focal spot center. Another irradia-tion scheme with a KC1 lens (F = 2000 mm) produced a power density up to 4-1012 W/cm2 in a focal spot of 150 /*m diameter at a small angle of incidence (~6°) with respect to normal. The experimental facility at CERN consists of the single-mode TEA CO2 laser with a total output energy up to 30 J (for CO2/N2/He = 4/1/5 mixture) and a beam diameter of ~90 mm. Other characteristics of the laser generator are similar to those described above for the CO2 laser generator at TBKI. Use of the parabolic mirror objective with F= 300 mm provides power density in the focal spot center on the level (2.5-3)-1013 W/cm2 (the num-ber is based on the diffraction distribution of the power density in the focal spot).
2.2. Measurement technique
The measurements of energy and temporal distribution laser pulses were carried out for each shot by means of detection of light reflected by KC1 wedges. The laser energy was measured by an energy meter (EP-50-02) and an oscilloscope (C8-13). The temporal shape of the laser pulse was written to a PC with a LiNbO3 pyroelectric detector (time resolu-tion <200 ps) and digital oscilloscope.
Measurements of ion beam characteristics were carried out in plasma expanding along the normal to the target surface. The energy spectra and total ion current were registered
CO2 laser-produced plasma 353 at 1.5 and 3 m distance from the target. For this purpose a 90° electrostatic analyzer and ion current collector were used (Kozochkin et al. 1993).
3. General requirement of ion source laser system
To achieve a high power density on the target and, thereby, the generation of highly stripped ions, one must provide high enough energy characteristics of the laser beam. But there is also a preliminary condition for the experimental scheme that must be satisfied. This condition is the absence of back-coupling between a laser system and a plasma due to reflection and scattering of some part of the laser light back into the output aperture. Such a back-coupling results in the establishment of a complex resonator with an additional "plasma mirror" and a significant distortion of laser beam characteristics (self-generation or decrease of gain in amplifiers, decrease of generation delay and laser power, etc.). This results in an increase of the focal spot size (which is equivalent to an increase of the "plasma mirror" size). This effect depends in a very sophisticated way on many parameters (opti-cal strength of objective, power density, laser active medium gain, resonator quality Q). It becomes impossible to evaluate real power density in this case, and its decrease can achieve an order of magnitude.
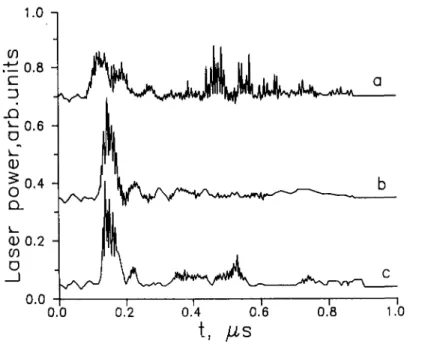
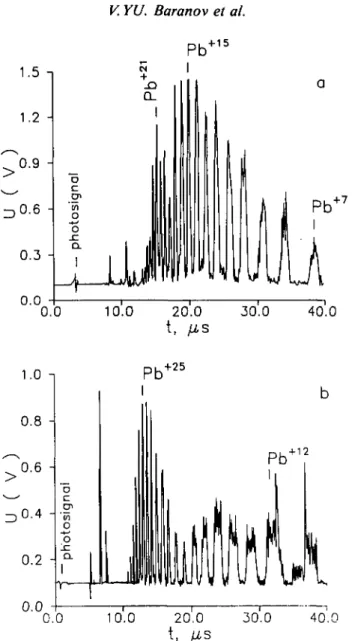
An example of the influence of such a laser-plasma back-coupling in early experiments with a Lumonics generator at CERN is presented in figures 4a and 5a. Note that the signals in figure 5 have been obtained for different adjustments of the analyzer and correspond in each case to the central part of the energy spectrum. It can be seen that the above-mentioned negative effect leads to a significant decrease of the maximum ion charge and the appearance of a large amount of ions in low-charge states.
The TIR-1 optical scheme of pulse formation completely excludes laser-plasma back-coupling due to gas-saturable filters and optical shutters. There was also no background
1.0 -i
FIGURE 4. Lumonics laser generator pulse temporal shape: (a) with laser-plasma coupling without additional path; (b) shielded target; (c) with additional optical path.
+ 15 0.0 1.0 -i 10.0 20.0 30.0 40.0 t , fJ,S +25 0.0 40.0
FIGURE 5. Influence of laser-plasma coupling on ion generation: (a) without delay path; (b) with delay path.
radiation during the pulse generation. This approach to pulse generation produces better spatial characteristics of the beam.
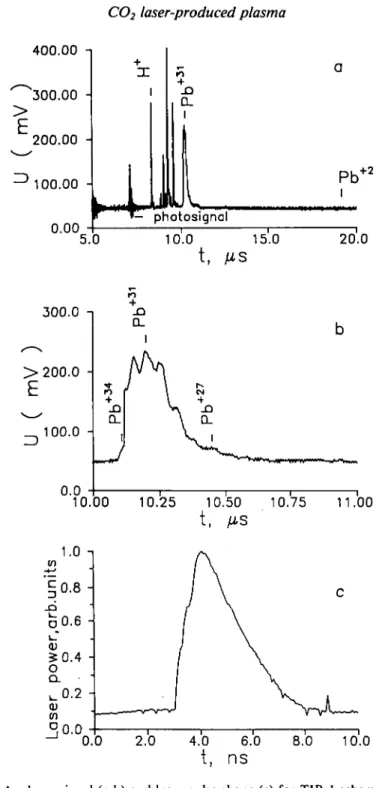
Typical analyzer signals in experiments for T = 2.5 ns and 30 ns and total energy 100 J and 40 J, respectively, are presented in figures 6 and 7 (the focal spot diameter was 50 /xm for both cases). It should be noted that in these pictures, and others like them, the zero line of the oscillograms was chosen arbitrarily. The signals correspond to central parts of the energy spectrum of the high-charge group of Pb ions, typically almost without low-charge components. The maximum ion low-charge number in the group was correlated to the laser radiation power density. Below we use the notation (z) for the ion charge number corresponding to the maximum of the ion spectral signal, taking into account that this value essentially does not differ from an average-charge number of the high-charge ion group.
CO2 laser-produced plasma 355 10.0 15.0 t, fiS 20.0 300.0 i > 200.0 100.0 -0.0 CL I 10.00 10.25 10.50 10.75 11.00 t, MS 1.0 i 0.0 2.0 4.0 6.0 8.0 10.0
t, ns
FIGURE 6. Analyzer signal (a,b) and laser pulse shape (c) for TIR-1 scheme short pulse.
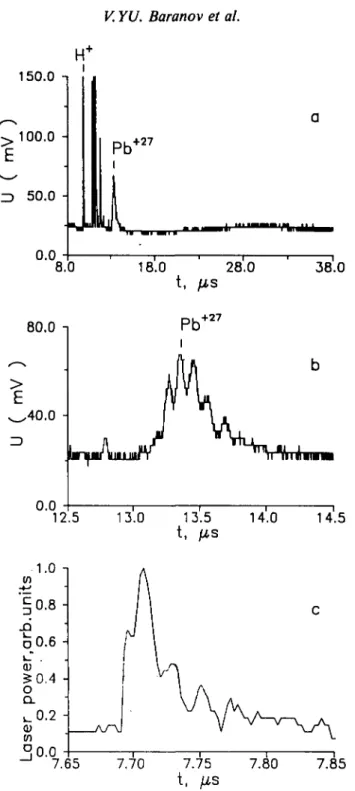
To avoid self-lasing due to laser-target coupling (when CO2 generator schemes are used), an additional optical path L between the generator and the target chamber was used so that an optical delay t = 2L/c > tx + t2 was obtained, where tx is the generation growth
time interval and t2 is the first generation peak duration. Unfortunately, this method does
356 150.0 i 100.0 -0.0 80.0 > ,40.0 -12.5 1.0-1 to c X I i_ D l_" 0) oQ. i 0) m D 0.8 0.6 0.4 0.2
on
-Pb
+27500
: J L
8.0 18.0 28.0 38.0 t , fJ,S +27 13.0 13.5 14.0 t , jUS 7.65 7.70 7.75 t, /iS 7.80 14.5 7.85FIGURE 7. Analyzer signal (a,b) and laser pulse shape (c) for TIR-1 scheme long pulse without any background radiation.
(2-3) us (t0 is the CO2 active medium decay duration for the gas mixture used). This low-intensity radiation, containing significant energy, produces mainly low-charge state ions and metallic vapors of the target material. This remnant generation, according to our mea-surements, does not introduce additional energy in the tail of the pulse, but it
redistrib-CO2 laser-produced plasma 357
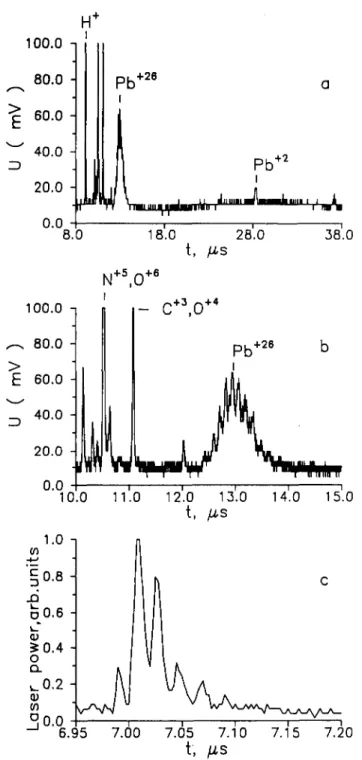
utes radiation power. In figure 8 is shown the analyzer signal for an 80-J pulse containing 50% of its energy in a low-intensity tail with the same power density averaged over the first 30 ns, as it was in the experiment in figure 7. It turned out that the charge state and the energy of a high-charge group of ions are almost the same. The only difference is the
pres-100.0 -i +26 Pb+2 18.0
t,
28.0 N+ 5, 0+ 6 +26 38.0 10.0 11.0 12.0 13.0 14.0 15.0 -1 "6.95 7.00 7.05 7.10 7.15 7.20FIGURE 8. Oscilloscope traces analogous to that of figure 6 for a laser pulse with the same peak power and temporal tail.
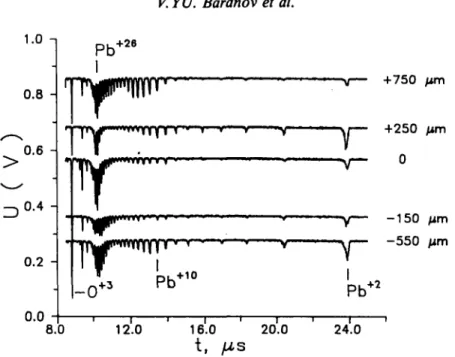
1.0 n 0.8 0.6 0.4 0.2 -0.0 -1-26 +750 +250 ~y— -150 -550 -y— +10 Pb+ 2 8.0 12.0 16.0 20.0 24.0
t,
FIGURE 9. Influence of the target position on an ion analyzer signal for F/1 objective.
ence of a large amount of low-charge components (it should be noted that the relative amplitude of signals registered by SEM corresponding to Pb1+, Pb2+ is several times un-derestimated in comparison to the amplitude of Pb26+ due to a secondary emission co-efficient dependence on energy and the charge number of the ion). The signals shown in figures 6-8 were obtained for the plasma expanding over 3 m distance from the target. Not only laser pulse characteristics influence the charge state of plasma, but so do recombina-tion processes. Some comments on the influence of recombinarecombina-tion during the free expan-sion phase of plasma evolution are presented below.
As a consequence of the requirement for a high-quality laser radiation, the precision of the target positioning is defined by the size of the laser beam caustic. In the case of a dif-fraction limited beam divergence, this precision is defined by the relative aperture of the objective A = \(F/D)2, where A is the largest acceptable deviation of the focal plane from
the target surface. In our experiments for F/D = 3 and a corresponding focal spot diam-eter df - 50 /xm, the maximum acceptable displacement of the target was A = ± 100 /mi.
Figure 9 illustrates these estimates.
4. Results of ion spectra study
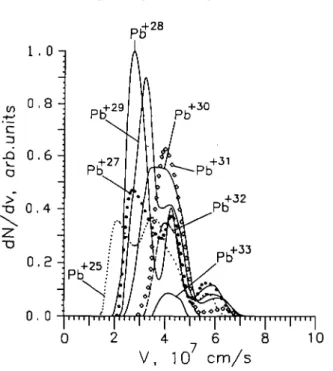
The energy spectra of plasma ion components were measured for a focal spot diameter of 50 jtm and 150 pm, and for a laser target power density range 2-1012 — 4:1013 W/cm2. The detailed results of these experiments were presented in Kozochkin et al. (1993) and Makarov et al. (1994). The typical spectrum shape for P = 4-1013 W/cm2 is shown in figure 10.
The characteristic feature of all observed spectra for power densities P > 1012 W/cm2 is the presence of a high-charge ion group. The number Z of an ion charge state corre-sponding to the maximum spectrometer and collector signals depends on the target power
CO2 laser-produced plasma 359
0 . 0 , , . , | T n , | r . , , , . i . , | . . i . | . i i i | , n T(r r , , | , , , , | , , , , | 0 2 4 6 8 10
V, 10 cm/s
FIGURE 10. Ion velocity spectrum for 30-ns pulse duration and power density 4-1013 W/cm2.
density in the way shown in figure 11 for the three values of a focal spot diameter. The experimental dependence of <z> on the power density within experimental errors can be fitted by the formula
= 5.9\nP- 152.5,
(1) 40 36 32 28 24 20 16 12 8 4 0 . • - experiment • o — simulation A - experiment : A — simulation, : • — experiment, : o , i , 50/um 50 /i-m , 1 50 /im 1 50/Am 40/tm 2 3 4 1012 2 3 4 1013 2 3 4where P is the power density in W/cm2. Ion spectra processing makes it possible to get empirical dependencies of the expansion velocity and the ion current pulse duration on the laser power density. The values of(z) and Kwere derived directly from ion spectra dN/dt. Errors in these values are caused by a deviation of measurements from shot to shot. The standard deviation was ±15%. The ion pulse duration was measured on the half-amplitude level also using measured spectra. To obtain more reliable results we average the values of
T for three charge numbers around <z>.
The ion pulse duration can be estimated by the formula
2LAv
v2-- Avl
where An is some characteristic half-width of spectrum dependencies dN/dv that must be determined exactly and T0 5 has been defined as the width on the half-amplitude. Within existing errors, Ayo.5 measured on the half-amplitude level seems to be a correct value. The ratio u/2At>05 remains approximately constant and equal to 1.6 ± 0.5 for the whole measured power density region.
Experimental scalings obtained in a similar manner are:
v [cm/s] = 9-P0 5 [W/cm2], (2) T-0.5 [/*s] = 2- 1O6P-0-43 [W/cm2] L [m]. (3) Additionally, an integration gives the number of particles for a specified time interval. Table 1 contains such data calculated from Pb spectra for P = 1012 W/cm2 and two drift lengths (1.5 and 3 m). Integration was made over the time interval in which Pb10+ ions were observed. It follows from table 1 that the number of ions most presented in the spec-trum (i.e., corresponding to <z» is about 15%. Our processing does not take into account the dependence of SEM secondary emission coefficients on the ion charge state, so the data in the table are only estimates. It must be noted that the spectra measured at 1.5- and 3-m distances (P = 1012 W/cm2) differ appreciably from one another. In our opinion, the dif-ferences might result from both the different experimental conditions (for the 3-m distance experiment we used a time-of-flight tube with 60-mm diameter) and the recombination influ-ence, as was observed in the numerical simulations.
Figure 12 shows a typical current oscilloscope trace for <z> = 30. The total laser genera-tor energy was 100 J, a duration of the first peak 30 ns, and focal spot diameter 50 /xm.
TABLE 1. Data calculated from Pb spectra
P = 1012 W/cm2 and two drift lengths (1.5 and 3.0)
z
4 5 6 7 8 9 10 11 12 L = 1.5 m 5.8 5.6 5.7 7.0 9.4 10.6 14.4 14.4 3.8 L = 3.0m 2.6 7.8 11.9 16.8 20.8 15.0 12.9 7.0 4.3CO2 laser-produced plasma 361 04 U 0
t
laser pulse
FIGURE 12. Oscilloscope trace of ion current density corresponding to 1.5-m drift distance, E' = 25 J.
Temporal resolution of the Faraday cup was 150 ns, and the standard deviation of current from shot to shot for high-charge state ions was ±159/o. As follows from ion spectrom-eter signals, the peaks on the current trace placed before and on the front of a high-charge ion pulse are related to impurity ions (H, N, O, C). The tail of the pulse is produced by low-charge lead ions (Pb25+ — Pb20+, Pb2+, Pb1+). Low-charge state Pb ions are generated by laser radiation with low power density ("wings" of focal spot distribution, the laser pulse temporal tail).
On the basis of these measurements it was found that (for at least a 5O-15O-/un focal spot interval) the ion current density is directly proportional to the focal spot square and to the laser power density, that is, j is directly proportional to laser energy E ~ d}P. For exam-ple, the average current density values for pulses with a total energy of 100 J were 11.3 and 12 mA/cm2 at 1.5-m distance for df= 150 /*m and df = 50 /*m, respectively (the last value
was scaled from a drift length of 3 m, in accordance to lawy ~ 1/L3). Experimental scal-ing j(E') can be described by the formula
j [mA/cm2] = 1.6£'[J] [m], (4)
where £" is the useful energy contained in first 30-ns peak of the laser pulse in the central diffraction spot and depends on P by the relation
P = 4£" (5)
The results presented by formulas (l)-(4) have been obtained for 7 = 30-ns laser pulse duration, which is, in our opinion, close to optimal. It follows from ID and 2D numer-ical simulations that an ion passes through the high-temperature region of plasma (near-critical region) for a few nanoseconds, but an essentially longer time (50-100 ns) is required for the plasma to expand to sufficiently small density where there is no strong recombi-nation. If the laser pulse duration is smaller than 10 ns, numerical simulations have shown that in the peak of the ion current the charge state of lead ions decreases due to recombi-nation. Experiments with 2.5-ns laser pulses confirmed this conclusion. Spectral
measure-ments of the charge state revealed a significant decrease of high-charged ion generation efficiency by a short CO2 laser pulse, because the average ion charge for a 2.5-ns pulse (/> = 6:1014 W/cm2) was measured to be 28-30, which is almost the same as for a 30-ns pulse (P = 4-1013 W/cm2). The only difference was 2.5-3 times higher ion energy for the short pulse.
5. Numerical simulations
For numerical simulation a 2D gas-dynamic model was developed. In the model, hydro-dynamics is described in one-fluid two-temperature approximation. The model includes electron heat conduction, electron-ion temperature relaxation, and heating by laser light. The electron energy balance equation also includes terms corresponding to the ionization and excitation energy of plasma ions. The interaction of laser light with plasma is mod-eled in the approximation of geometrical optics by the ray-tracing technique. On every time step the laser beam is presented by a set of beamlets with random distribution of the beamlets across the beam (Atzeni 1986). Then each beamlet is traced over the computa-tional mesh until it is completely absorbed or escapes the mesh. Such a model is sufficient
for an adequate description of classical (bremsstrahlung) absorption, but it cannot treat
specific features of laser-plasma interaction such as resonant effects, nonlinear forces, etc. (Hora 1981). Adequate modeling of these effects requires a large amount of computer resources for solving the Maxwell equations on fine numerical mesh and is hardly possi-ble at the time, especially if a sophisticated atomic model must be solved self-consistently with 2D hydrodynamics, as it is in our case. Nevertheless, in order to take into account the anomalous absorption effect, we have incorporated the semiempirical model similar to that used in Eder (1989). The influence of electrical fields arising during the charge-separation process in the extracting system was neglected.
For a description of ion level population kinetics we use the so-called "scaled hydrogen-like" atomic model similar to that described in LLNL Annual Report (1987). In our atomic model, the ground states of all ions are described in detail using the correct ionization energies and more reliable elementary processes data. In addition to ground state, every ion has several excited levels described by the principal quantum number n (which is greater than the principal quantum number of the ground state). The ionization energy of all such levels was calculated using the "hydrogenic" formula / = Z2Ry/n2, where Z is the
spec-troscopical symbol of ion, and Ry = 13.6 eV is the hydrogen atom ionization energy. Radi-ation probabilities were calculated using oscillator strengths for the hydrogen atom and excitation rates from the semiempirical formula by Van Regemorter (1962). The ionization rates for ground states were calculated using the formula by Lotz (1970). For excited lev-els, the classical formula of Thompson (Book 1987) was used. Photorecombination rates were calculated from ionization cross sections for hydrogen-like ions. The correct calcu-lation of a three-body recombination rate for very low electron temperatures of expand-ing plasma requires a large amount of excited levels to be included in the model. Since the total amount of states should not exceed several hundreds, we attributed the three-body recombination rate calculated from the analytical formula (Regemorter 1962) to the level with the highest principal quantum number if it is valid. Otherwise, the three-body recom-bination rate was calculated from the ionization rate for every level. The dielectronic re-combination rate was calculated from the formula by Burgess (1964), which was corrected to account for the finite electron density value (Zdanov 1979).
This model satisfactorily describes the level population kinetics of hydrogen-like ions if it is not necessary to take into account the fine structure of the levels. For other ions, it makes it possible to find the ionization state. The lead ion atomic model included all of
CO2 laser-produced plasma 363
the ionization stages from neutrals to Pb40"1". Every ion had four hydrogen-like levels, so the total number of states incorporated into the model exceeded 200.
In our 2D code, equations of population kinetics can be solved in a self-consistent way with hydrodynamics equations, but this approach requires a large amount of computer time. To decrease the time for numerical simulation the following technique was implemented. During 2D hydrodynamic simulation instead of the detailed atomic model, we used steady-state values of <z) and related terms in the electron energy balance equation. After a lagrang-ean cell has passed through the critical surface region and after rarefaction to some empirically predefined value of electron density, the value of <z> is set to be fixed, which corresponds to a freezing of the ionization state.
At the starting time in 2D simulation, some number of Lagrangian particles (markers) are placed inside the target. During the calculation the time evolution of the electron tem-perature and plasma density are stored and, after the end of the 2D run (in postprocessor regime) full-scale population kinetics for each marker is calculated using a detailed atomic model, and then the ion energy spectrum at the required drift length is reconstructed.
Automatic generation of a new mesh and rezoning procedure allows us to continue simulation when strong deformation of the Lagrangian computational mesh occurs.
Results obtained using the described procedure are in good agreement with the 2D sim-ulation with simultaneous and self-consistent solution of hydrodynamics and kinetics made for a short laser pulse (T = 5 ns, Io = 3 • 1013 W/cm2).
Below we present results of a 2D simulation of experiments on a TIR-1 laser. It is assumed that the CO2 laser pulse is focused by F/3 optics. The Gaussian distribution of the power density in the focal spot and Gaussian time profile,
(6) were modeled. In the above formula, the following parameters were chosen according to experimental conditions of the TIR-1: Po = 3 • 1013 W/cm2, a, = 12.5 ns, and ar = 25 /*m.
The laser beam is directed along the z-axis in cylindrically symmetrical (r,z)-geometry. Lagrangian computational mesh has 20 x 50 cells in the r- and z-directions, respectively.
The target was represented initially by a rectangle in (r,z): 500 fim x 5 /xm for the target
radius and thickness, respectively.
In figures 13-15, one-half of an axial cross section of a plasma jet is presented in cylin-drical geometry (coordinates on axes are in jim). In figure 13, for a 1500 x 1500 /tin re-gion at time 15 ns (2.5 ns after the top of laser pulse), level lines of electron density and laser beam trajectories are shown. In figure 14, level lines of electron density and temper-ature are shown. In contrast to ID simulations, the electron heat conduction in 2D ones is insufficient to make the electron temperature uniform in the corona region (below criti-cal density).
In figure 15, the outer boundary of computational mesh is shown at time 100 ns. Level lines of electron density and marker positions also are presented in this figure. Initially, the majority of markers were placed in a rectangular region of size 20 x 1 jim in the focal spot, and the rest of them (describing the shape of plasma jet) were placed along the hori-zontal line (z = const).
At the center of the focal spot ablation is faster, and during the first 1-2 ns after the start of the 2D simulation, the critical surface moves upward to the distance approximately 250 /*m from the dense part of the target. In the first stage, the critical surface is convex, which causes scattering of some parts of the laser beam. Later, the gap in density profile is formed in the near-axis region. The gap diameter is approximately equal to the diameter
364
o..
fe
2ot) MOo" 6 0 0 " 100D 1200"FIGURE 13. Contour of the computational mesh together with laser rays' traces and equilevel lines of electron density marked with lg Ne numbers. One-half of the axial cross section (R- and
Z-coor-dinates are in /xm) in square region of size 1500 /mi. Top of laser pulse.
of the laser beam. This leads to additional focusing of the beam (within the framework of the geometrical optics model used), an increase of absorbed energy, and hence to a rise of electron temperature up to 1.5-2 keV (to be compared with 1 keV in a ID simulation). This effect also was observed in a simulation of a short (5-ns) laser pulse. But it was found that the rise of the electron temperature does not lead to a significant increase of (z) (in com-parison with ID model) due to fast rarefaction of plasma near the critical surface.
Calculated values of (z) for various Po in 6 are plotted in figure 11. It was not possible
to fit experimental values of <z> for the whole range of laser power density using a single value of the electron heat conduction limiting factor/ introduced in a usual way (Kozochkin
et al. 1993). It ranges from 0.05 for Po = 4-1013 W/cm2 to 1 for Po = 1012 W/cm2. This
result should not be too surprising since flux limitation was introduced first in order to achieve better agreement of the numerical and experimental results for inertial confinement fusion studies, where very high laser intensities are required. At low laser intensities, elec-tron heat conduction tends toward the classical regime. In addition, radiation transfer in the near-critical region could play an appreciable role in plasma energy balance. In the present work it was not included in the model.
CO2 laser-produced plasma 365
0 iot)
FIGURE 14. Contour of the computational mesh together with equilevel lines of electron density marked with lg Ne numbers and equilevel lines of electron temperature marked with 5, 4, 3, 2, 1
cor-responding to 0.9, 0.7, 0.5, 0.3, 0.1 of maximum value Te = 1800 eV. One-half of the axial cross
sec-tion (i?- and Z-coordinates are in /*m) in square region of size 1500 /tin. Top of laser pulse.
Another result of simulations important for ion source design is the decrease of the three-body recombination role with increasing laser power density up to ~1013 W/cm2. At this level of laser power this fact is verified (at least qualitatively) by a comparison of lead ion spectra measured at TBKI at drift distances of 1.5 and 3 m, which show the same value of average charge. The same conclusion was made in Laska et al. (1994) on the base of measurements of spectra of Ta40"1" — Ta50+ ions obtained from a plasma heated by an iodine laser at a power density up to ~1015 W/cm2. This is a result of the higher velocity of plasma and, hence, deeper expansion achieved at high laser power. After termination of the laser pulse, the part of the plasma that contains a high-charge ion group is cooled due to expansion, but the cooling starts from a lower density, in comparison to the case of lower laser power. Lower density leads to a late beginning of the recombination stage, which also means that recombination will start at lower temperatures. The final ("frozen") ionization state is a result of two competing processes —recombination, caused by decreas-ing the electron temperature, and free electrons heated by the release of energy accompa-nying the three-body recombination (the latter process obviously prevents three-body
§ •
~ t i sool) 1000b isoob 2000b 2soob 3000b 3500b Mooob
FIGURE 15. Contour of the computational mesh together with distribution of markers and equilevel lines of electron density marked with lg Ne numbers. One-half of the axial cross section (/?- and
Z-coordinates are in /mi) in square region of size 4.5 cm. End of typical run, time—100 ns. Bound markers in the interior of plasma were initially placed at horizontal (Z = const) line, so they show plasma expansion.
recombination because it is proportional to 1/71*5). At the temperature level when three-body recombination could begin for high laser power density, recombination heating turned out to be sufficient to almost completely stop recombination. The average ion charge decrease during the recombination stage for such a high laser power is less than 0.5 unit. Three-body recombination becomes progressively more important if the laser power den-sity goes down to 1012 W/cm2 and less. It should be noted that in the dense part of the plasma (corresponding to the small-energy part of an ion spectrum, where the average charge is essentially smaller than in a high-charge group) three-body recombination is very effective. The recombination at low laser power was studied previously by many authors (Golubev et al. 1986; Pitsch et al. 1981; Tallents 1980) but only for light elements.
6. Conclusions
The results presented in above sections cover the most interesting from the point of view of practical application region of laser system parameters. The important point is that the
CO2 laser-produced plasma 367
quality of the laser radiation should be as high as possible. Based on the results of Sections 3 and 4, the reasonable way to design the laser system is to use a master oscillator-amplifier scheme. It allows one to:
• generate a laser pulse without a temporal tail, • form the best spatial characteristics,
• avoid laser-plasma coupling.
Other key parameters of the laser system are the total energy in pulse and focal spot size. Our study clarified that additional information is required for the final specification of these parameters. The question still remains, however, about whether <z> depends on the focal spot size and how strong is that dependence? Decreasing the focal spot size below 50 fim seems to be impractical for a real ion source. So, the dependence of <z> on power density for focal spot size in the range 100-200 /im should be investigated in order to fix the total laser energy. This is the subject of current research.
Acknowledgments
The authors would like to thank H. Haseroth and H. Kugler for continuing support of this work. We also wish to acknowledge useful discussions with A. Shumshurov, S. Kon-drashov, and I. Roudskoy. The work was supported by RFBR research grant Nr. 94-02-05942-a and NATO collaborative research grant Nr. 92132.
R E F E R E N C E S ADAMOVICH, V.A. et al. 1978 Sov. Quant. El. 5, 921. ADAMOVICH, V.A. et al. 1979 Sov. Quant. El. 6, 2621. ANISIMOV, V.N. et al. 1980a Appl. Opt. 19, 918. ANISIMOV, V.N. et al. 1980b Sov. Quant. El. 7, 1451. AKIMOV, A.E. et al. 1983 Sov. Quant. El. 10, 1533.
AKIMOV, A.E. et al. 1985 Sov. J. Exp. Theor. Phys. 42, 87. AKIMOV, A.E. et al. 1987 Sov. J. Exp. Theor. Phys. 45, 381. ATZENI, S. 1986 Comp. Phys. Commun. 43, 107.
BARANOV, V.YU. et al. 1974 Preprint of Kurchatov Institute IAE-2398, Moscow. BARANOV, V.YU. et al. 1975 Sov. Quant. El. 2(9), 2086.
BARANOV, V.YU. et al. 1976a Sov. Plasma Phys. 2, 486. BARANOV, V.YU. et al. 1976b Sov. Quant. El. 3(3), 651. BARANOV, V.YU. et al. 1976c Appl. Opt. 15, 1373. BARANOV, V.YU. et al. 1978 Sov. Quant. El. 5, 568.
BARANOV, V.YU. et al. 1979 Sov. J. Exp. Theor. Phys. 30, 593. BARANOV, V.YU. et al. 1984 Sov. Quant. El. 11, 344.
BOOK, D.L. 1987 NRL Plasma Formulary (NRL, Washington). BURGESS, A. 1964 Astrophys. J. 139, 776.
CERN. 1991 Design study of the Large Hadron Collider (LHC), CERN 91-03. EDER, D.C. 1989 Phys. Fluids Bl 12, 2462.
GOLUBEV, A.A. et al. 1986 Sov. J. Techn. Phys. 12(9), 513.
HORA, H. 1981 Physics of Laser Driven Plasma (John Wiley, New York).
KOZOCHKIN, S.M. et al. 1993 Preprint of Kurchatov Institute IAE-5635/7, Moscow. LASKA, L. et al. 1994 Appl. Phys. Lett. 65, 691.
Laser Program Annual Report 1987, LLNL, Livermore, pp. 2-81.
MAKAROV, K.N. et al. 1994 Sov. J. Theor. Exp. Phys. 106(12), 1649. MORE, R.J. 1982 Quant. Spectrosc. Radiat. Transfer 27, 345. PITAEVSKI, L.P. 1962 Sov. J. Exp. Theor. Phys. 42, 1326. PITSCH, P. et al. 1981 Phys. D: Appl. Phys. 14, L51. SHERWOOD, T.R. 1992 Rev. Sci. Instrum. 63, 2789. TALLENTS, G.J. 1980 Plasma Phys. 22, 709. VAN REGEMORTER, H. 1962 Astrophys. J. 132, 906. ZDANOV, V.P. 1979 Sov. Plasma Phys. 5, 572.