Establishment of the biochemical and endocrine blood profiles in
the
Majorera and Palmera dairy goat breeds: the effect of
feed restriction
Joana R Lérias
1,2, Raquel Peña
3, Lorenzo E Hernández-Castellano
4,5, Juan Capote
6, Noemí Castro
4,
Anastasio Argüello
4, Susana S Araújo
1,7,8, Yolanda Saco
3, Anna Bassols
3and André M Almeida
1,2,7†*
1IICT– Instituto de Investigação Científica Tropical and CIISA – Centro Interdisciplinar de Investigação em Sanidade Animal, Centro de Veterinária e Zootecnia, Faculdade de Medicina Veterinária, Av. Univ. Técnica, 1300-477 Lisboa, Portugal
2
IBET– Instituto de Biologia Experimental e Tecnológica, Av. República, 2780-157 Oeiras, Portugal
3
Departament de Bioquímica i Biologia Molecular, Facultat de Veterinària., Universitat Autònoma de Barcelona, 08193 Bellaterra, Spain
4
Department of Animal Science, Universidad de Las Palmas de Gran Canaria, 35413 Arucas, Spain
5
Veterinary Physiology, Vetsuisse Faculty, University of Bern, Bremgartenstrasse 109a, CH-3001 Bern, Switzerland
6
ICIA– Instituto Canario de Investigaciones Agrarias, P.O. Box 60 La Laguna, Spain
7
ITQB– Instituto de Tecnologia Química e Biológica, Oeiras, Portugal
8
Plant Biotechnology Laboratory, Department of Biology and Biotechnology‘L. Spallanzani’, Università degli Studi di Pavia, via Ferrata 1, 27100 Pavia, Italy
Received 15 January 2015; accepted for publication 11 June 2015; first published online 20 August 2015
Feed restriction, and seasonal weight loss (SWL), are major setbacks for animal production in the tropics and the Mediterranean. They may be solved through the use of autochthonous breeds par-ticularly well adapted to SWL. It is therefore of major importance to determine markers of tolerance to feed restriction of putative use in animal selection. Two indigenous breeds from the Canary Islands, Palmera and Majorera, are commonly used by dairy goat farmers and, interestingly, have different phenotype characteristics albeit with a common ancestry. Indeed, Majorera is well adapted to feed restriction whereas the Palmera is susceptible to feed restriction. In addition, regard-less of their importance in dairy production, there are only a limited number of reports relating to these breeds and, to the best of our knowledge, there is no description of their blood metabolite standard values under control conditions or as affected by feed restriction. In this study we analysed the blood metabolite profiles in Majorera and Palmera goats aiming to establish the differential responses to feed restriction between the two breeds and to characterise their metabolite standard values under control conditions. We observed significant differences in creatinine, urea, non-esteri-fied fatty acids (NEFAs), cholesterol, IGF-1 and T3 due to underfeeding. Furthermore, a PCA analysis, revealed that animals submitted to undernutrition could be distinguished from the control groups, with the formation of three separate clusters (Palmera individuals after 22 d of subnutrition (PE22); Majoreraindividuals after 22 d of subnutrition (ME22) and animals assigned to control conditions (MC0, MC22, PC0 and PC22)), highlighting different responses of the two breeds to undernutrition.
Keywords: Blood metabolites, seasonal weight loss, goat, Majorera, Palmera.
Animal production is increasing, particularly in developing countries (Morales de la Nuez et al. 2014; Hernández-Castellano et al.2015a,b), and goats are considered to be particularly well adapted to a range of adverse conditions,
particularly in relation to low feed availability during the dry season (Lérias et al.2014). Indeed, it is estimated that ap-proximately 130 million people across Western and Southern Africa alone own small ruminants, particularly goats, and that these are very important for their livelihood and food security (McDermott et al.2010).
Both tropical and Mediterranean climates are defined by a rainy and a dry season that provide different feed availabil-ities, the rainy season being notable for its good quality
†Current address: Ross University School of Veterinary Medicine, Basseterre, St. Kitts, West Indies
pastures. On the contrary, during the dry season, the pasture quantity and quality is significantly reduced, causing feed restriction and consequently live weight decrease, com-monly described as seasonal weight loss (SWL) (Lamy et al.2012; Cardoso & Almeida,2013). SWL is considered to be one of the major issues in animal production in tropi-cal and subtropitropi-cal climates, as the affected animals may lose up to 30% of their body live weight (BLW) (Cardoso & Almeida,2013) as seen in Southern Africa (Almeida et al.
2006,2007), West Africa (de Almeida & Cardoso,2008a,
b) and more recently in Western Australia (Almeida et al.
2013; Scanlon et al.2013). Indeed, SWL can lead to signifi-cant economic losses to producers, enhancing the need to solve this problem, something the Food and Agriculture Organization of the United Nations has been addressing in recent years (Cardoso & Almeida,2013). The use of sup-plementation is one proposed solution, however, it is very expensive and, consequently, difficult to implement in developing countries. The use of local breeds known to be tolerant to SWL is increasing, being much less expensive and easy to implement in such regions (Cardoso & Almeida,2013).
The Canary Islands are a subtropical archipelago com-posed of seven islands with very different and contrasting micro-climates. Overall, the western region (La Palma, El Hierro, La Gomera and the northern part of the island of Tenerife) are humid, whereas the eastern islands (Lanzarote, Fuerteventura, Gran Canaria and the southern part of Tenerife) are extremely dry (Herrera et al.2001), a consequence of not being in the path of the trade winds arising from the Atlantic and their exposure to the influence of the Sahara Desert. These two groups of islands have very different rain patterns that necessarily affect local ecosys-tems, agriculture, pasture abundance and animal produc-tion systems. As a consequence, the Canary Islands are home to an extraordinary variety of domestic animal resources, counting three goat local breeds, all descending from ancestors imported from Northern Africa and the Iberian Peninsula during the colonisation of the Islands. Different breeds developed as a result of particular adapta-tions of the animals to the different climates present on each of the islands. There are three different local goats breeds: the Majorera, the Palmera and two ecotypes of the Tinerfeña(Amills et al.2004).
Currently, the Majorera goat, although distributed through all islands, is primarily found on Fuerteventura and Gran Canaria (Navarro-Ríos et al. 2011). In contrast, the Palmerabreed is found primarily on La Palma , but also spor-adically on other islands, particularly northern Tenerife (Escuder et al. 2006). Although Palmera and Majorera goats share a common ancestor, there are several diffe-rences between them. Majorera goats are adapted to dry cli-mates and therefore have an acquired resistance to SWL (Fresno et al. 1994), whilst Palmera goats are adapted to rainy climates, and as such are susceptible to SWL (Navarro-Ríos et al.2011). It is also noteworthy to mention that such adaptation is clear from a phenotypic point of
view with Majorera goats showing strong similarities to breeds from the Sahel region (e.g. slender bodies, long legs and short hair) and accordingly have recently been suc-cessfully exported for milk production to the arid regions of Senegal in West Africa. In contrast, Palmera goats show strong similarities to goats from the northern Iberian Peninsula (bulkier body frame, spiral horns and long hair).
As shown in sheep (Caldeira et al. 2007; Hyder et al.
2013) and in other goat breeds (Aboelmaaty et al. 2008; Hyder et al.2013), blood metabolites are one of the most important indicators in the evaluation of the physiological state of animals, as well as determinants of the putative dif-ferential responses of these animals to specific conditions such as those posed by SWL. Besides, the lactation process has an autocrine regulation (Wilde et al. 1997) that can be affected by hormone changes during SWL. In addition blood metabolite analysis can be an expeditious tool to assess animal nutrition status and can be easily inte-grated into the farm’s daily management. Their determina-tion can be easily and rapidly conducted. In this work, we analysed the influence of feed restriction on the evolution of several blood metabolites (creatinine, urea, cholesterol, triglycerides, glucose, total proteins, creatine kinase, phos-phorus, non-esterified fatty acids (NEFAs), sodium, chloride, hydroxybutyrate, haptoglobin) and hormones (cortisol, insulin, insulin-like growth factor 1 (IGF-1), triiodothyronine (T3) and leptin). To the best of our knowledge, this is the first time that these blood metabolites and hormones have been characterised in Majorera and Palmera goat breeds under feed restriction. Furthermore, this work, by conducting an extensive characterisation of the blood metabolites profiles in Majorera and Palmera breeds under control situations, was seen as serving as a reference for future works involving dairy goat breeds from the Tropics and the sub-Tropics. We will finally address the evolution of these metabolite and endocrinal profiles as a consequence of feed restriction by relating these findings to the differential adaptation of these two breeds to SWL.
Material and methods
Location, animals and nutritional treatments
As described in detail previously (Lérias et al. 2013), the study was conducted at the experimental farm of the Faculty of Veterinary Medicine of the ULPGC – Universidad de Las Palmas de Gran Canaria (Arucas, Gran Canaria, Spain) with 10 Majorera and 10 Palmera dairy goats (3 lactations with kidding in late February and a body condition score of 3) obtained from the experimental flock of the Pico Research Station (Valle Guerra, Tenerife, Spain) during May/June 2012. Animals were classified as clinically healthy at the onset and through all the experi-mental period (22 d) and were admitted to the trial at day 80 of the lactation, approximately at the peak of lactation. The goats were divided randomly into four sets, two for each breed: underfed and control groups. During the
experimental period animals were milked at a vacuum pres-sure of 42 kPa, a pulsation ratio of 90 pulses/min, and a pul-sation ratio of 60/40, in accordance with Capote et al. (2006) and Torres et al. (2013). Body liveweights and daily milk production were 45·5 kg and 1·60 l for Majorera Control, 50·6 kg and 1·68 l for Majorera Underfed, 32·8 kg and 1·03 l for Palmera Control and 40·6 kg and 1·33 l for Palmera underfed, as previously reported (Lérias et al.
2013). During the whole trial, all animals had free access to drinking water.
With the view to reproducing the field conditions in regions prone to drought and SWL when the pasture is chara-cterised by low protein and high fibre content the following nutritional restrictions were applied (Almeida et al.2006). Animals from the underfeed groups were fed on standard wheat straw and a vitamin-mineral supplement (underfed diet, in order to achieve a 15–20% reduction of their initial BLW by the end of the experimental period). The wheat straw basic composition corresponded to a low level of crude protein (approximately 30 g/kg dry matter), high amounts of fiber (420 g/kg dry matter) and low energy content (5·5 MJ/kg dry matter) (McDonald et al.
1988). In contrast, control animals were fed on a balanced diet, sufficient to cover their maintenance and lactation needs by using standard supplements found on the Canary Islands. As per Lérias et al. (2013) and Martínez-de la Puente et al. (2011), goats from the control groups were fed above-maintenance needs with maize, soy 44 (crude protein 44%), dehydrated lucerne, dehydrated beetroot, lucerne hay and a vitamin-mineral supplement. The control diet provided 1·81 kg of dry matter, 1·46 UFL, 133 g of metabolisable protein, 12 g of Ca and 6 g of P in ac-cordance with the guidelines issued by the Institut National de la Recherche Agronomique(INRA, 2007). Goats from the underfed groups were fed with straw, representing 52% of the total UFL provided to the control group (1·81 kg of dry matter, 0·76 UFL, 41·13 g of metabolisable protein, 1·33 g of Ca and 0·66 g of P). The experimental period lasted 22 d from the point when the animals in the underfed groups had reached a stable decrease in relative liveweight of 13–15%. At this date, liveweights and daily milk production were 48·2 kg and 1·99 l for Majorera Control and 44·1 kg with 0·22 l for Majorera Underfed, 33·9 kg and 1·15 l for Palmera Control and 35·4 kg and 0·17 l for Palmera Underfed, as previously reported by Lérias et al. (2013). Blood collection and analysis
Blood samples (4–5 ml) were collected from the external jugular vein at day 0 and day 22 of the trial in the early hours of the morning and before the animals were milked and fed. Plasma was separated by centrifugation as described (Hernández-Castellano et al.2014) and stored at−80 °C until use. Plasma metabolite concentrations were measured as pre-viously described (Yang et al. 2011). Briefly, the following methods were used: glucose-dehydrogenase (GLDH) for urea; recommended IFCC reference method for creatine
kinase; molybdate method for phosphorus; ion selective electrode method for sodium and chloride; Mercodia Ovine Insulin ELISA (Mercodia, Sweden) for insulin; multi-species leptin RIA kit (Millipore Corporation, USA) for leptin; Immulite Solid-phase, enzyme-labeled chemiluminescent immunoassay (Siemens, USA) for IGF-1; Immulite Solid-phase, competititve chemiluminescent immunoassay (Siemens, USA) for T3; cholesterol esterase/peroxidase enzym-atic method (Beckman Coulter Reagent) for cholesterol; glycerol phosphate oxidade enzymatic method (Beckman Coulter Reagent) for triglycerides; hexokinase method (Beckman Coulter Reagent) for glucose; biuret method (Beckman Coulter Reagent) for total proteins; reagent NEFA C (Wako Chemicals GmbH, Germany) for NEFAs; reagent RANBUT D-3-hydroxybutyrate (Randox, UK) for hydroxybuty-rate; reagent Haptoglobin Colorimentric Assay (Tridelta Phase, Ireland) for haptoglobin; salivary cortisol ELISA (DRG Instruments, Germany), for cortisol.
All the assays were performed with an Olympus AU400 ana-lyser following the manufacturer’s recommendations for meta-bolites and with Immunite 1000 (Siemens, Germany) for hormone measurements, using standard commercial practices. Statistical analysis
Data collected (Majorera and Palmera blood metabolites for day 0 and 22) for each feed group, breed and trial day was analysed for normality with the Shapiro-Wilk test and then further analysed by ANOVA repeated measures. When signi-ficant P values (P < 0·05) were observed, mean comparisons were performed with a Tukey post hoc test. Means were considered significantly different when P < 0·05. Statistical analysis was performed using the STATISTICA 8·0 software (Tulsa, OK, U.S.A.).
To identify the structure of the interdependences of the main parameters assessed in the animals of the study, joint principal components analysis (PCA) was performed on the following variables: NEFAs, creatinine, creatine kinase, chloride, haptoglobin, sodium, cholesterol, urea, total pro-teins, hydroxybutyrate, IGF-1, insulin, glucose, T3, phos-phorus, leptin, cortisol and triglycerides. The standardised variables were subjected to PCA allowing the extraction of the rotated orthogonal components, as well as, their relative scores. Only principal components (PC) with an eigenvalue higher than 1 were considered for discussion.
Animal welfare disclaimer
Spanish and European Union guidelines and legislation on care, use and handling of experimental farm animals were followed. Author AM Almeida holds a FELASA grade C cer-tificate enabling the design and conduction of animal ex-perimentation in the European Union.
Results and discussion
Considering the importance of SWL and the use of indigenous breeds with an acquired tolerance to SWL (Lamy et al.2012;
Cardoso & Almeida,2013) in animal production, it is clear that the determination of the metabolic profiles in Majorera and Palmera goats are of extreme importance. In fact, and to the best of our knowledge, there has been no blood meta-bolic profiling of these two breeds, further enhancing the im-portance of these results. In addition, it is crucial to understand the effect of feed restriction in the metabolic and endocrine parameters of indigenous goats with different toler-ances to SWL so that such information could be used in selec-tion programs together, for instance, with genomic, transcriptomic or proteomic data in a systems biology per-spective (Almeida et al.2015). Accordingly, in this work we describe for the first time the blood metabolite and endocrinal profiles of in the Majorera and Palmera goat breeds from the Canary Islands (Spain) and at the same time we study how these profiles change in the two breeds as a consequence of feed restriction.
In this section we will address first the Principal Component Analysis (Fig. 1) for all the metabolites and hor-mones and in the four experimental groups. Later, we will address one by one all the metabolites and hormones studied. The standard values for the plasma concentrations of each individual metabolite in the Majorera and Palmera breeds are presented finally inFigs 2–4 (control groups at day 0). As the establishment of the standard values for each breed is essentially descriptive, they will not be com-pared with results from other researchers in the literature. Principal Component Analysis (PCA)
For the metabolite profiling of the animals of the study, three factors were extracted from the PCA, accounting for 55·2% of the variance. Factor 1 accounted for 31·8% of the variance and was highly correlated with NEFAs (0·85) followed then
total proteins (−0·78), IGF1 (−0·77), creatinine (0·77), urea (−0·75). Factor 2 accounted for 13·6% and was potentially correlated with chloride (0·69) and leptin (0·63). Factor 3 accounted for 9·9% was correlated with haptoglobin (0·73).
The data were plotted according to PC1 and PC2, as shown inFig. 1, from which three clusters were evident cor-responding to: (1) individual Palmera animals after 22 d of undernutrition (PE22); (2), individual Majorera animals after 22 d of undernutrition (ME22) and (3) animals assigned to control groups (MC0, MC22, PC0 and PC22) as well as the data referring to the animals allocated to the experimen-tal group at the beginning of the trial (PE0, ME0). Of these the most relevant observation is that it is clearly possible to separate animals submitted to undernutrition (right side of the plot,Fig. 1A) from those kept under normal feeding, irrespective of the breed. In fact, underfed animals presented higher concentrations of NEFAs (PE22 1·25 ± 0·31 and ME22 1·03 ± 0·23 mmol/l), tryglicerides only for PE (PE22 15·33 ± 0·82 and ME22 12·40 ± 2·15 mg/dl) and creatinine (PE0 0·79 ± 0·08 and ME22 11·46 ± 6·22 mg/dl), but not for leptin (PE22 4·00 ± 0·99 and ME22 3·05 ± 0·55 ng/ml HE) and cortisol (PE22 42·66 ± 12·34 and ME22 11·46 ± 6·22 ng/ml) (see subsequent sections), as plotted in
Fig. 1B. In addition, NEFAs, total protein, IGF-1 and creati-nine could be considered as the best parameters to be used to discriminate control from underfed animals, irrespective to the breed studied. Finally, a clear separation between breeds is noticed in the plot presented inFig. 1A, showing that the reply of the two breeds to weight loss is indeed dif-ferent, albeit a lower variation was accounted for this axis. As Palmera Underfed group has higher concentrations of cortisol (PE0 43·24 ± 47·18 and PE22 42·66 ± 12·34 ng/ml) and triglycerides (PE0 12·33 ± 1·47 and PE22 15·33 ± 0·82 mg/dl) (see subsequent sections), such metabolites
Fig. 1. PCA scatterplot of the Majorera and Palmera animals (control and underfed) at 0 and 22 d (A) and position of the variables projected in the plane as determined by the first two principal axes (B) (45·38% of the % explained variance). MC0– Majorera Control, day 0; MC22 – Majoreracontrol at day 22, ME0– Majorera Underfed at day 0, ME22 – Majorera Underfed at day 22; PC0 – Palmera Control, day 0; PC22 – Palmeracontrol at day 22, PE0– Palmera Underfed at day 0 and PE22 – Palmera Underfed at day 22.
could be proposed as associated to the responses of this breed to undernutrition.
Creatinine and Creatine Kinase
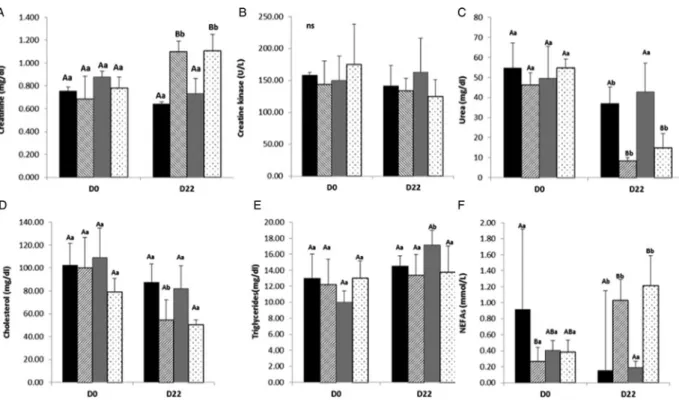
Creatine and creatine phosphate have key roles in energy metabolism, as a rapid source of high-energy phosphate via creatine kinase enzyme (CK) (creatine phosphate + ADP− creatine + ATP). Creatinine is a breakdown product of creatine and creatine phosphate, which is then excreted in the urine (Brosnan & Brosnan, 2010). This metabolite can be related to kidney function and in general to the body mass (Brosnan & Brosnan,2010).
The results relative to the creatinine values in underfed and control groups from both breeds are described in
Fig. 2A. Concerning Majorera and Palmera creatinine evolution in underfed groups, there was a significant in-crease (P < 0·05) at day 22. There was however no diffe-rences between the two underfeed groups at day 22. Nevertheless, there was a clearly difference as a result of feed restriction, demonstrated in both statistical analysis.
There were no significant differences between the control groups (P > 0·05) in the ANOVA repeated measures ana-lysis, whereas the differences between control and underfed groups indicate that undernutrition led to an increase in cre-atinine values. Indeed, crecre-atinine increase is likely linked to the negative energy balance that underfed animals are
subjected to, being characterised not just weight loss, but also the mobilisation of adipose tissue and muscle protein (Carbone et al. 2012) So, the increase of creatinine was mainly due to the higher mobilisation of muscle protein, which increased the creatine levels, that were further broken down to creatinine. Nevertheless, there is no evi-dence of the influence of evolution on the breed, since both underfed groups behaved similarly during the trial. These findings are consistent with those of Jia et al. (1995) who studied the variation of creatinine concentrations in goats fed with different levels of crude protein (8 and 16%). It should also be emphasised that creatinine is a me-tabolite with a high variation due to breed, sex, diet, among other factors (Liu & McMeniman,2006).
The results for creatine kinase are presented inFig. 2B. No differences (P > 0·05) between all groups at day 0 and day 22 were found. This is consistent with what would be expected as this enzyme is released to the plasma in case of muscular damage, which was not the case of the animals used in the study.
Urea
Urea is an important source of nitrogen, through its direct intake in the diet or its reentrance in the rumen across the ruminal epithelium (Huntington & Archibeque, 1999).
Figure 2C shows the urea concentration in underfed and
Fig. 2. Mean values and standard deviations for Majorera and Palmera control and underfed groups at days 0 and 22 of the trial for the metabolites Creatinine (A), Creatine kinase (B), Urea (C), Cholesterol (D), Triglycerides (E) and NEFA (F). ABC Columns with different uppercase letters superscripts indicate differences (P < 0·05) within groups of the same trial day. abc Columns with different lowercase letters superscripts indicate to differences (P < 0·05) between the same groups at days 0 and 22 of the trial. Black bars – Majorera Control; Striped Bars– Majorera Underfed; Grey Bars – Palmera Controls; Dotted Bars – Palmera Underfed.
control groups from both Majorera and Palmera breeds at days 0 and 22, a significant reduction at day 22 was observed in the underfed groups and the Majorera Control group. The differences in underfed groups reveal that only feed restriction had an effect in urea values, since both breeds had a similar trend for this variable. Similar results were obtained by Celi et al. (2008) using Red Syrian goats under feed restriction (80% of energy requirements). These authors observed higher urea values in the restricted group when compared to the control group (140% of energy requirements). Therefore, the reduction of urea concentra-tion was probably due not only to the reducconcentra-tion of nitrogen intake, but also to the fact that these animals were in lacta-tion and under negative energy balance. Nevertheless, and as milk yield was highly reduced along the trial (Lérias et al.
2013), these changes in urea blood concentrations are pri-marily due to the negative energy balance. Furthermore, and as previously suggested (Caldeira et al.2007), an incre-ment of the ammonia production resulting from the catabo-lism of mobilised endogenous N compounds could also be a likely explanation for our results. Finally, there are additio-nal reports regarding the lack of a relationship between serum urea concentration and feed restriction, such as those described by Dashtizadeh et al. (2008) or Caldeira et al. (2007). These results indicate that urea concentrations are on one hand heavily dependent on the level and type of feed restriction imposed and on the other hand on breed and individuals. In fact, it has been demonstrated that this parameter has a strong variability among animals of the same breed (Kasumu,2011).
Cholesterol and triglycerides
Cholesterol is essential for all mammals, including rumi-nants, being sourced mainly as a result of its ingestion or en-dogenous production (Bauchart, 1993). Triglycerides are one of the most important sources of energy in mammals being composed by a glycerol esterified with three fatty acids, which can be broken down into glycerol and NEFAs (Alila-Johansson,2008).
The results for cholesterol in underfed and control groups’ are represented inFig. 2E. Here we observed a significant reduction (P < 0·005) in the underfed groups only for the Majorera at day 22 (54·44% of the initial values) with no significant changes being observed for the Palmera. Nevertheless, though no significant differences were observed in the Palmera, there appears to be a trend towards a decrease in the levels of cholesterol in this breed as well (seeFig. 3F). There are a number of potential reasons for these differences. While they are most likely due to a reduced amount of fat in-gestion, the fact that Majorera animals are heavier and produce more milk than Palmera animals may be one factor but may also be a consequence of a putative more efficient metabolism regarding cholesterol storage in the Palmera breed. Finally, the observed reduction in cholesterol concentration may have also been due to a decreased lipogenesis rather than an increased lipolysis. In support of our results Aboelmaaty
et al. (2008) obtained similar results for Egyptian native goats, that was attributed to a reduction of fat ingestion and consequently of its absorption, and a higher metabolism rate. No differences among groups due either to feed restriction or breed was detected in the triglycerides (Fig. 2E), with the exception of Palmera Control (higher values at day 22). Interestingly, and in contrast to our findings, Aboelmaaty et al. (2008) and Celi et al. (2008), observed a decrease in triglyceride concentration in situations of feed restriction. It could be hypothesised that an initial decrease in triglyceride concentration would be followed by an in-crease of the triglyceride values, via NEFA pathway inhibi-tion with consequent re-esterificainhibi-tion occurring. Working with Serra da Estrela ewes, Caldeira et al. (2007) has pro-posed such a theory that, in our case, may be corroborated by the fact that hydroxybutyrate, (see below) which is a product of NEFAs oxidation, was reduced and stabilised along with the feed restriction.
Non-esterified fatty acids (NEFAs) and hydroxybutyrate Hydroxybutyrate as well as acetone and acetoacetate, is considered a ketone body. Ketones are produced in the liver from the metabolism of NEFAs and volatile fatty acids in negative energy balance conditions (Bauchart,1993).
We observed a significant increase (P < 0·001) in NEFA among the underfed groups of Majorera and Palmera (Fig. 2F). There was a significant reduction (P < 0·05) in the Majoreracontrol group at day 22, however, the standard de-viation for this group was high. On the basis of this, feed res-triction appears to lead to the increase of the concentration of NEFAs, but breed did not seem to have a significant effect. Several authors have reported similar results in goats (Dunshea et al. 1988; Ríos et al. 2006; Tsiplakou et al.
2012) and sheep reared under feed restriction (Caldeira et al. 2007). In our results, the increase in NEFAs was likely related to an increment of fatty acid mobilisation, due to the animals’ energy negative balance (Lérias et al.
2013). Additionally, Dunshea et al. (1988) reported an in-crement in plasma of the NEFA:glycerol ratio in animals under feed restriction, suggesting a decrease in lipogenesis rather than increased lipolysis. The decrease in the control group may be due to lower degree of nutritional stress in a more advanced period of lactation, since the animals were in the 100th day of lactation. No differences were observed between day 0 and 22 in hydroxybutyrate for any of the studied breeds (Fig. 3A), with the exception of a significant difference between Majorera groups at both dates. As previ-ously described, the inhibition of NEFA pathways and its re-esterification could explain these results.
Glucose and insulin
Insulin effects are evident in several tissues including muscles, adipose tissues, liver and mammary glands and are important in the regulation of glucose homoeostasis (Sasaki,2002). No differences between groups due to either feed restriction or
different breeds were observed in these two metabolites. Despite the fact that several authors have reported a reduction in insulin values due to feed restriction (Caldeira et al.2007; Ollier et al.2007; Celi et al.2008), it is important to emphasise that some have found inconsistent daily patterns for several metabolites and hormones, particularly insulin (Alila-Johansson et al.2004). In our study the standard deviation of this variable was high for all studied groups, reflecting a high variability of the insulin concentration among animals (seeFig. 4B). Glucose concentration (Fig. 3B), was found similar to what has been observed by Aboelmaaty et al. (2008) and Celi et al. (2008). Nevertheless, it has to be empha-sised that glucose, similarly to insulin may show considerable changes between the same breed.
Total proteins and haptoglobin
Haptoglobin is anα2-glycoprotein that binds to free haemoglo-bin (Javid,1978; Sadrzadeh & Bozorgmehr,2004). This acute phase protein is one of the most used indicatives for stress conditions (Hernández-Castellano et al.2015c) such as feed restriction. Furthermore, total protein concentration can be
used as an indicator of liver disease, nutritional status, kidney disease, among others (Dhinaa & Palanisamy,2010).
No significant differences were found in the total proteins and haptoglobin concentration due to either feed restriction or to breed effect (see Fig. 3C, D), with the exception of Palmera groups at day 22 for total proteins (higher value for the control group). Even though some authors have reported a reduction of total proteins due to feed restriction (e.g. Caldeira et al.2007; Aboelmaaty et al.2008), Celi et al. (2008) reported a reduction of total proteins in their trial but it bore no relation to feed restriction. Indeed, protein levels can vary considerably with the diet (Hatfield et al.1998) and also between breeds, which lead to a high variability between results.
Cortisol and leptin
Cortisol is a glucocorticoid hormone involved in stress res-ponse (Alila-johansson, 2008). Leptin is involved in body weight regulation and related to food intake and energy balance (Ahima et al. 1997; Alila-Johansson, 2008). Cortisol hormone levels are strongly related to the feeding
Fig. 3. Mean values and standard deviations for Majorera and Palmera control and underfed groups at days 0 and 22 of the trial for the metabolites Hydroxybutyrate (A), Glucose (B), Total Protein (C), Haptoglobin (D), Phosphorus (E), Sodium (F) and Choloride (G). ABC Columns with different uppercase letters superscripts indicate differences (P < 0·05) within groups of the same trial day. abc Columns with different lowercase letters superscripts indicate to differences (P < 0·05) between the same groups at days 0 and 22 of the trial. Black bars– Majorera Control; Striped Bars – Majorera Underfed; Grey Bars – Palmera Controls; Dotted Bars – Palmera Underfed.
time in goats (Eriksson & Teräväinen,1989; Alila-Johansson,
2008), so this may explain the high standard deviation within groups and the lack of statistical differences (Fig. 4B). It may be expected that underfed groups would have a higher level of cortisol due to the feed restriction stress situation and a decreased concentration of leptin (Fig. 4C), caused by the reduction of body fat and food ingestion. In agreement with our findings, Celi et al. (2008) reported that leptin alterations over time in underfed animals was not due to feed restriction and Tsiplakou et al. (2012) reported no significant differences between over and underfeed groups. In fact, leptin and cortisol have a high variability due to several factors, with special emphasis to stress conditions, and regular management operations such as milking leading in turn to a strong result heterogeneity as the one observed in our study. IGF-1 and T3
Insulin-like growth factor 1 (IGF-1) stimulates tissue differen-tiation and cellular proliferation and is also involved in lipo-genesis and gluconeolipo-genesis (D’Ercole et al. 1984; Clemmons & Van Wyk, 1985; Zulu et al.2002; Guerra-García et al.2009). The thyroid hormones have an effect on the metabolic rate increment, protein synthesis and lipid metabolism stimulation, among other effects (Capen
& Martin, 1989). Our results showed a tendency towards lower values for both hormones in the underfed groups, albeit with statistical differences due to feed restriction only being recorded in the Majorera groups (Fig 4D, F) res-pectively for IGF-1 and T3). Some groups (Aboelmaaty et al.2008) found similar results for IGF-1 to those described in the present study, which are expected considering the role of this hormone on the metabolism regulation. The con-centration of the T3 hormone would be expected to reduce, to allow the animals to decrease their energy requirements, as has been reported by other authors (Caldeira et al.2007; Celi et al.2008), and in our results.
Ions: Chloride, sodium and phosphorus
Minerals are important elements in goat nutrition, since their defficiency may lead to reproductive complications and production losses (Bueno & Vitti,1999). Sodium and chlori-de are two of the most important ions for pH regulation and osmotic pressure (Underwood & Suttle,1999). Our results (Fig. 3E–G), found no differences in any of the studied mine-rals between groups (comparing days 0 and 22) and between day 22 values, with the exception of sodium and chloride (lower values for day 22 of Palmera underfed group com-pared to day 0). These results may not be surprising given that the main consequence of the feed restriction imposed
Fig. 4. Mean values and standard deviations for Majorera and Palmera control and underfed groups at days 0 and 22 of the trial for the hormones Insulin (A), Cortisol (B), Leptin (C), IGF-1 (D) and Triiodotironine (E). ABC Columns with different uppercase letters superscripts indicate differences (P < 0·05) within groups of the same trial day. abc Columns with different lowercase letters superscripts indicate to differences (P < 0·05) between the same groups at days 0 and 22 of the trial. Black bars– Majorera Control; Striped Bars – MajoreraUnderfed; Grey Bars– Palmera Controls; Dotted Bars – Palmera Underfed.
was essentially related to energy and protein requirements, with minimal changes regarding mineral nutrition.
Conclusions and future perspectives
The results showed in this study reveal important aspects regarding goat physiology under feed restriction and provide the first in-depth characterisation of blood metabol-ite and hormonal profiles in the two studied breeds, Majorera and Palmera. These breeds are extremely important to the goat dairy production sector in the Canary Islands and are also gaining importance in the Spanish mainland, as well as other countries in arid tropical regions such as Senegal and Mauritania, where dairy goat production has been implemented and where the small ruminant dairy industry is expanding considerably. These results are also particularly interesting given the limited number of such assays in dairy goats. Herein, we determined that several of the studied metabolites and hormones showed significant differences due to feed restriction (creatinine, urea, NEFAs, cholesterol, IGF-1 and T3), due either to the lower amount of protein and fat ingestion (urea and cholesterol reduction), higher metabolisation of muscular proteins and fatty acids (creatin-ine and NEFAs increment) or an overall metabolism aiming at energy conservation (IGF-1 and T3 reduction). These results are supported also by a Principal Component Analysis that showed the presence of three clusters: one for each underfed group at day 22 and a third one that included animals in control conditions in both days 0 and 22 and the experimen-tal groups prior nutritional stress i.e. day 0. The existence of these clusters is likely explained by: NEFAs, total proteins, IGF-1 and creatinine, which are probably the best parameters to differentiate control from underfed animals. In addition, Palmeraanimals appear to have a tendency towards higher cortisol and triglycerides levels, which could be of use as a putative biomarker of the specific response of this breed to feed restriction.
The authors acknowledge the financial support of Fundação para a Ciência e a Tecnologia(Lisbon, Portugal) through research project PTDC/CVT/116499/2010– Lactation and milk production in Goat (Capra hircus): identifying molecular markers underlying adaptation to seasonal weight loss, research unit GREEN-it “Bioresources for Sustainability” (UID/Multi/04551/2013), and SFRH/BPD/90916/2012 grant that finances author A.M. Almeida. Moreover, the authors acknowledge A. Morales-delaNuez, D. Martell-Jaizme, A. Suárez-Trujillo, P. Delgado-delOlmo and G. Cugno for their collaboration in the samples collection. Authors are members of COST action FA1002 – Farm Animal Proteomics and COST action FA1308– Dairycare to which net-working support is acknowledged. Authors finally thank Dr. Jeffrey Plowman (AgResearch New Zealand) for critically reviewing both the science and English in this manuscript.
References
Aboelmaaty AM, Mansour MM, Ezzo OH & Hamam AM 2008 Some repro-ductive and metabolic responses to food restriction and re-feeding in Egyptian native goats. Glob Veter 2 225–232
Ahima RS, Dushay J, Flier SN, Prabakaran D & Flier JS 1997 Leptin accelerates the onset of puberty in normal female mice. J Clin Inverst 99 391–395
Alila-johansson A 2008 Daily and seasonal rhythms of melatonin, cortisol, leptin, free fatty acids and glycerol in goats. PhD thesis, Faculty of Veterinary Medicine of the University of Helsinki, Finland
Alila-Johansson A, Eriksson L, Soveri T & Laakso ML 2004 Daily and annual variations of free fatty acid, glycerol and leptin plasma concentrations in goats (Capra hircus) under different photoperiods. Comp. Biochem. Physiol. A Mol Integr Physiol138 119–131
Almeida AM, Schwalbach LM, de Waal HO, Greyling JPC & Cardoso LA 2006 The effect of supplementation on productive performance of Boer goat bucks fed winter veld hay. Trop Anim Health Prod 38 443–449 Almeida AM, Schwalbach LM, Cardoso LA & Greyling JPC 2007 Scrotal, testicular and semen characteristics of young Boer bucks fed winter veld hay: the effect of nutritional supplementation. Small Rum Res 73 216–220
Almeida AM, Kilminster T, Scanlon T, Araújo SS, Milton J, Oldham J & Greeff JC 2013 Assessing carcass and meat characteristics of Damara, Dorper and Australian Merino lambs under restricted feeding. Trop Anim Health Prod45 1305–1311
Almeida AM, Bassols A, Bendixen E, Bhide M, Ceciliani F, Cristobal S, Eckersall PD, Hollung K, Lisacek F, Mazzucchelli G, McLaughlin M, Miller I, Nally JE, Plowman J, Renaut J, Rodrigues P, Roncada P, Staric J & Turk R 2015 Animal board invited review: advances in proteo-mics for animal and food sciences. Animal 9 1–17
Amills M, Capote J, Toma A, Obexer-ruff G, Angiolillo A & Sanchez A 2004 Strong phylogeographic relationships among three goat breeds from the Canary Islands. J Dairy Res 71 257–262
Bauchart D 1993 Lipid absorption and transport in ruminants. J Dairy Sci 76 3864–3881
Brosnan JT & Brosnan ME 2010 Creatine metabolism and the urea cycle. Mol Genet Metab100 (Suppl) S49–S52
Bueno MS & Vitti DM 1999 Phosphorus levels for goats endogenous fecal and net requirement for maintenance. Pesq Agropec Bras 34 675–681 Caldeira RM, Belo AT, Santos CC, Vazques MI & Portugal AV 2007 The
effect of long-term feed restriction and over-nutrition on body condition score, blood metabolites and hormonal profiles in ewes. Small Rumin Res68 242–255
Capen CC & Martin SL 1989 The effects of Xenobiotics on the structure and function of thyroid follicular and C-cells. Toxicol Pathol 17 266 Capote J, Argüello A, Castro N, López JL & Caja G 2006 Short
communica-tion: correlations between udder morphology, milk yield, and milking ability with different milking frequencies in dairy goats. J Dairy Sci 89 2076–2079
Carbone JW, Mcclung JP & Pasiakos SM 2012 Skeletal muscle responses to negative energy balance : effects of dietary protein. Am Soc Nutr 3 119–126
Cardoso LA & Almeida AM 2013 Enhancing animal welfare and farmer income through strategic animal feeding. In Enhancing Animal Welfare and Farmer Income through Strategic Animal Feeding, pp. 37–44 (Ed. HPS Makkar). Rome: Food and Agricultural Organization of the United Nations (FAO)
Celi P, Di Trana A & Claps S 2008 Effects of perinatal nutrition on lactational performance, metabolic and hormonal profiles of dairy goats and re-spective kids. Small Rumin Res 79 129–136
Clemmons DR & Van Wyk JJ 1985 Evidence for a functionalrole of endogen-ously produced somatomedin-like peptides in the stimulation of human fibroblast and porcine smooth muscle cell DNA synthesis. J Clin Invest 75 1914–1918
Dashtizadeh M, Zamiri M, Kamalzadeh A & Kamali A 2008 Effect of feed restriction on compensatory growth response of young male goats. Iran J Vet Res9 109–120
de Almeida AM & Cardoso LA 2008a Animal production and genetic resources in Guinea Bissau: I–Northern Cacheu province. Trop Anim Health Prod40 529–536
de Almeida AM & Cardoso LA 2008b Animal production and genetic resources in Guinea Bissau: II–Tombali province. Trop Anim Health Prod40 537–543
D’Ercole AJ, Stiles DA & Underwood EL 1984 Tissue concentrations of som-atomedin C: further evidence for multiple sites of synthesis and paracrine or autocrine mechanisms of action. Proc Natl Acad Sci USA 81 935–939 Dhinaa AN & Palanisamy PK 2010 Z-Scan technique: to measure the total
protein and albumin in blood. J Biomed Sci Eng 3 285–290
Dunshea FR, Bell AW & Trigg TE 1988 Relations between plasma non-es-terified fatty acid metabolism and body tissue mobilization during chronic undernutrition in goats. Br J Nutr 60 633–644
Escuder A, Fernández G & Capote J 2006 Characterisation of Palmera dairy goat production systems. Options Méditerranéennes 70 95–100 Eriksson L & Teräväinen TL 1989 Circadian rhythm of plasma cortisol and
blood glucose in goats. Asian-Austral J Anim Sci 2 202–203
Fresno MR, Gómez J, Molina A, Darmanin N, Capote J & Delgado JV 1994 Preliminary study of the Majorera milk goat productive performance. Arch Zootecnia43 181–186
Guerra-García M, Meza-Herrera CA, Sánchez-Torres-Esqueda MT, Gallegos-Sánchez J, Torres-Hernández G & Pro-Martínez A 2009 IGF-I ovarian activity of goats in divergent body condition and with a supplement of non-degradable protein in rumen. Agrociencia 43 241–247
Hatfield PG, Hopkins JA, Ramsey WS & Gilmore A 1998 Effects of level of protein and type of molasses on digesta kinetics and blood metabolites in sheep. Small Rumin Res 28 161–170
Hernández-Castellano LE, Almeida AM, Ventosa M, Coelho AV, Castro N & Argüello A 2014 The effect of colostrum intake on blood plasma prote-ome profile in newborn lambs: low abundance proteins. BMC Vet Res 5 10–85
Hernández-Castellano LE, Morales-delaNuez A, Sánchez-Macias D, Moreno-Indias I, Torres A, Capote J, Argüello A & Castro N 2015a The effect of colostrum source (goat vs. sheep) and timing of the first col-ostrum feeding (2 h vs. 14 h after birth) on body weight and immune status of artificially reared newborn lambs. J Dairy Sci 98 204–210 Hernández-Castellano LE, Morales-delaNuez A, Sánchez-Macias D,
Moreno-Indias I, Torres A, Capote J, Argüello A & Castro N 2015b The effect of milk source on body weight and immune status of lambs. Livest Sci175 70–76
Hernández-Castellano LE, Argüello A, Almeida AM, Castro N & Bendixen E 2015c Colostrum protein uptake in neonatal lambs examined by descrip-tive and quantitadescrip-tive liquid chromatography-tandem mass spectrometry. J Dairy Sci98 135–147
Herrera R, Puyol D & Martín E 2001 Influence of the North Atlantic Oscillation on the Canary Islands precipitation. J Clim 14 3889–3903 Huntington GB & Archibeque SL 1999 Practical aspects of urea and
ammonia metabolism in ruminants. Proc Am Soc Anim Sci 1–11.http:// www.researchgate.net/profile/Gerald_Huntington/publication/228474751
Hyder I, Ramesh K, Sharma S, Uniyal S, Yadav VP, Panda RP, Maurya VP, Singh G & Sarkar M 2013 Effect of different dietary energy levels on physio-biochemical, endocrine changes and mRNA expression profile of leptin in goat (Capra hircus). Livest Sci 152 63–73
Javid J 1978 Human haptoglobins. Curr Top Hematol 1 151–192 Jia ZH, Sahlu T, Fernandez JM, Hart SP & Teh TH 1995 Effects of dietary
protein level on performance of Angora and cashmere-producing Spanish goats. Small Rumin Res 16 113–119
Kasumu A 2011 Effects of breed, sex and age on serum biochemistry in Nigerian goats. BSc thesis, College of Animal Science and Livestock Production, University of Agriculture, Abeokuta, Nigeria. pp46 Lamy E, van Harten S, Sales-Baptista E, Guerra MM & Almeida AM 2012
Factors influencing livestock productivity. In Environmental Stress and Amelioration in Livestock Production, pp. 19–51 (Eds S Veerasamy Sejian, SMK Naqvi, T Ezeji, J Lakritz & R Lal). Berlin: Springer, Verlag (ISBN: 978-3-642-29204-0)
Lérias JR, Hernández-Castellano LE, Morales-delaNuez A, Araújo SS, Castro N, Argüello A, Capote J & Almeida AM 2013 Body live weight and milk production parameters in the Majorera and Palmera goat breeds from the Canary Islands: influence of weight loss. Trop Anim Health Prod45 1731–1736
Lérias JR, Hernández-Castellano LE, Suárez-Trujillo A, Castro N, Pourlis A & Almeida AM 2014 The mammary gland in small ruminants: major morphological and functional events underlying milk production - a review. J Dairy Res 81 304–318
Liu ZJ & McMeniman NP 2006 Effect of nutrition level and diets on creatin-ine excretion by sheep. Small Rumin Res 63 265–273
Martínez-de la Puente J, Moreno-Indias I, Morales-Delanuez A, Ruiz-Díaz M, Hernández-Castellano LE, Castro N & Argüello A 2011 Effects of feeding management and time of day on the occurrence of self-suckling in dairy goats. Vet Rec 168 378
McDermott JJ, Staal SJ, Freeman HA, Herrero M & Van De Steeg JA 2010 Sustaining intensification of smallholder livestock systems in the tropics. Livest Sci130 95–109
McDonald P, Edwards RA & Greenhalgh JFD 1988 Animal Nutrition. 4th edition. Harlow, UK: Longman Scientific & Technical
Morales de la Nuez A, Moreno-Indias I, Sánchez-Macías D, Hérnandez-Castellano LE, Suarez-Trujillo A, Assunção P, Argüello A, Castro N & Capote J 2014 Effects of Crypthecodinium cohnii, Chlorela spp. and Isochrysis galbana addition to milk replacer on goat kids and lambs growth. J Appl Anim Res 42 213–216
Navarro-Ríos M, Fernández G & Perezgrovas R 2011 Characterization of Majorera goat production systems in the Canary Islands. Options Méditerranéennes100 205–210
Ollier S, Robert-Granié C, Bernard L, Chilliard Y & Leroux C 2007 Mammary transcriptome analysis of food-deprived lactating goats high-lights genes involved in milk secretion and programmed cell death. J Nutr137 560–567
Ríos C, Marín MP, Catafau M & Wittwer F 2006 Concentraciones sanguíneas de ß-hidroxibutirato, NEFA, colesterol y urea en cabras lecheras de tres rebaños con sistemas intensivos de producción y su relación con el balance nutricional. Arch Med Vet 38 19–23
Sadrzadeh SMH & Bozorgmehr J 2004 Haptoglobin phenotypes in health and disorders. Pathol Patterns Rev 121 97–104
Sasaki S 2002 Mechanism of insulin action on glucose metabolism in rumi-nants. J Anim Sci 73 423–433
Scanlon TT, Almeida AM, Van Burgel A, Kilminster T, Milton J, Greeff JC & Oldham C 2013 Live weight parameters and feed intake in Dorper, Damara and Australian Merino lambs exposed to restricted feeding. Small Rumin Res109 101–106
Torres A, Castro N, Hernández-Castellano LE, Argüello A & Capote J 2013 Short communication: effects of milking frequency on udder morph-ology, milk partitioning, and milk quality in 3 dairy goat breeds. J Dairy Sci96 1071–1074
Tsiplakou E, Chadio S, Papadomichelakis G & Zervas G 2012 The effect of long term under- and over-feeding on milk and plasma fatty acids profile and on insulin and leptin concentrations of goats. Int Dairy J 24 87–92 Underwood EJ & Suttle NF 1999 The Mineral Nutrition of Livestock. 3rd
edition. London, UK: CABI Publishing
Wilde CJ, Quarrie LH, Tonner E, Flint DJ & Peaker M 1997 Mammary apop-tosis. Livest Prod Sci 50 29–37
Yang B, Bassols A, Saco Y & Pérez-Enciso M 2011 Association between plasma metabolites and gene expression profiles in five porcine endo-crine tissues. Genet Cel Evol 43 28
Zulu VC, Nakao T & Sawamukai Y 2002 Insulin-like growth factor-I as a pos-sible hormonal mediator of nutritional regulation of reproduction in cattle. J Vet Med Sci 64 657–665