COHORT PROFILE
Cohort Profile: The international
epidemiological databases to evaluate
AIDS (IeDEA) in sub-Saharan Africa
Matthias Egger,1,2* Didier K. Ekouevi,3 Carolyn Williams,4 Rita Elias Lyamuya,5 Henri Mukumbi,6 Paula Braitstein,7,8,9 Tyler Hartwell,10 Claire Graber,1 Benjamin H Chi,11 Andrew Boulle,2
Franc¸ois Dabis12 and Kara Wools-Kaloustian7
1
Institute of Social and Preventive Medicine (ISPM), University of Bern, Switzerland,2Infectious Diseases Epidemiology Unit, School of Public Health and Family Medicine, University of Cape Town, South Africa,3Programme PAC-CI, Abidjan, Coˆte d’Ivoire,
4Epidemiology Branch, Division of AIDS, National Institute of Allergy and Infectious Diseases, Bethesda, MD, USA,5Morogoro
Regional Hospital, Morogoro, Tanzania,6AMOCONGO ARV Ambulatory Treatment Center, Kinshasa, Democratic Republic of the
Congo,7Indiana University School of Medicine, IN, USA,8Moi University School of Medicine, Eldoret, Kenya,9University of
Toronto, Dalla Lana School of Public Health, Toronto, Canada,10Department of Statistics and Epidemiology, RTI International,
Durham, NC, USA,11Centre for Infectious Disease Research in Zambia, Lusaka, Zambia and12INSERM U897, Institut de Sante´
Publique, Epide´miologie et De´veloppement (ISPED), Universite´ Bordeaux Segalen, Bordeaux, France
*Corresponding author. Division of International and Environmental Health, Institute of Social & Preventive Medicine (ISPM), Finkenhubelweg 11, CH-3012 Bern, Switzerland. E-mail: [email protected]
Accepted 12 April 2011
How did the study come about?
The HIV/AIDS pandemic is a public health emergency in many low and middle-income countries. Out of the estimated 33.3 million people with HIV at the end of 2009, 22.5 million were in sub-Saharan Africa and the majority of these were women.1 The introduction in 1996 of combination anti-retroviral therapy (ART) led to a substantial reduction in morbidity and mor-tality in high-income countries.2,3 In more recent years, efforts by governmental programmes such as the President’s Emergency Program for AIDS Relief (PEPFAR) and The Global Fund as well as non-governmental programmes have resulted in the scale-up of ART in resource-limited settings: at the end of 2009, 5.25 million people were reported to be receiving ART therapy in low- and middle-income countries.1
Although still far from achieving universal cover-age,1the massive concerted scale-up of ART is unpre-cedented in global health. The long-term outcomes of ART in Africa and other regions are, however, not well defined. Poor retention in care, limited access to second-line ART regimens, co-infections and com-orbidities of HIV infection, for example tuberculosis and cancer, and the emergence of drug resistance and toxicities are important challenges to long-term
programme effectiveness in resource-limited settings.7 The World Health Organization (WHO) advocates a public health approach to ART in resource-limited set-tings, to maximize benefit in a setting of low levels of training for health-care workers, high patient bur-den and limited availability of drugs. Key characteris-tics include the standardization of first-line and second-line ART regimens, simplified clinical decision-making and standardized clinical and laboratory monitoring.4–6
In 2005, the National Institute of Allergy and Infectious Diseases (NIAID) sought applications for a global consortium structured through regional cen-tres to pool existing clinical and epidemiological data on HIV-infected people, and particularly patients on ART: the International epidemiological Databases to Evaluate AIDS (IeDEA, see Figure 1 for logo).8 Funding of IeDEA has recently been extended to 2011–2016. The seven regions included in IeDEA are North America, Caribbean/Central and South America, Asia/Pacific and four regions in sub-Saharan Africa. A Coordinating Centre (currently at RTI International, NC, USA) provides logistical and data management and harmonization support to the regional networks. Two of the IeDEA cohorts have previously been described in the journal.9,10 The objective of the pre-sent report is to describe the four African IeDEA
regions: West Africa, Central Africa, East Africa and Southern Africa.
What does it cover?
The African networks of IeDEA aim to inform the scale-up of ART in sub-Saharan Africa through clin-ical and epidemiologclin-ical research. The specific re-search questions differ by region, but the objectives are similar and cover all populations, including preg-nant women, infants, children, adolescents and adult patients. They can be summarized as follows:
(1) To provide robust evaluation of the delivery of ART in children, adolescents and adults in sub-Saharan Africa, with a focus on long-term pro-gramme effectiveness and outcomes.
(2) To describe the long-term and temporal trends in regimen durability and tolerability and to exam-ine monitoring strategies.
(3) To describe important comorbidities and co-infections of HIV infection, including malaria, tuberculosis and cancer.
(4) To examine the pregnancy- and HIV-related out-comes of women initiating ART during preg-nancy and of infants exposed to HIV or ART in utero.
(5) To develop and apply novel statistical methods to deal with missing data, loss to follow-up, com-peting risks and time-dependent confounding. (6) To establish procedures to link the HIV cohort
data with other databases, at local or national level, for example routine mortality data or tu-berculosis and cancer registries.
Who is in the sample?
A total of 183 clinics providing ART in 17 countries in sub-Saharan Africa participate in IeDEA’s four African regions (Figure 2). Most sites are located in urban areas, operate at the primary care level, are led by nurses or clinical officers rather than physicians
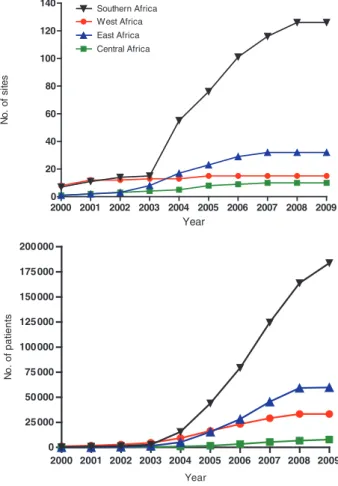
and are part of the public health care system of the country (Table 1). About two-thirds of sites have the capacity to measure CD4 cell counts, and a third can do HIV-1 RNA tests. Virtually all sites provide adher-ence support to patients, screen and provide treat-ment for tuberculosis. ART provision at most sites started during or after 2004 with the exception of several clinics in West Africa, which introduced ART earlier. Figure 3 shows the cumulative number of treatment sites and adult patients starting ART. There has been a rapid increase in facilities and pa-tients contributing data to IeDEA which is for the most part due to rapid scale-up by a few countries in each region. For example, South Africa and Zambia in Southern Africa and Nigeria in West Africa had the most rapid scale-up in their region. All three contributing countries in East Africa have expanded coverage. Central Africa faces unique chal-lenges in that Rwanda was the only PEPFAR focus country and other countries in the region have ex-tremely weak health systems and government re-sponses to the epidemic. Central Africa has had only modest scale up of treatment and increases in the research database are the result of active data collec-tion and data system strengthening.
Patients are consecutively included as they initiate HIV care at a participating clinic or programmes until the capacity of the site is reached. At most sites, data collection starts when a patient initiates ART; how-ever, some programmes also collect data on patients in the pre-ART period (not yet eligible for ART or eligible but waiting to be treated). Data are stripped of identifiers at the clinic level and all analysis is per-formed with de-identified data. Given the use of de-identified data, most patients are not individually consented to participate. However, when additional data is collected from patients outside of routine clin-ical practice, informed consent is sought. All research is overseen by Institutional Review Boards (IRBs) in the countries where data are collected, and addition-ally by IRBs with oversight over the analytical teams. In West, East and Southern Africa data are obtained from existing clinical databases. In Central Africa, the study team created prospective cohorts as existing health records were not sufficient for epidemiologic research. Table 2 shows the characteristics of the 286 803 adult patients on ART recorded in the African IeDEA databases as of the end of 2010. In all regions, most patients were 30- to 40-years old, female, and started ART with advanced immune-deficiency and advanced clinical stage (WHO stage III or IV). A substantial minority of patients started ART without a recent CD4 cell count, many patients did not have a CD4 count measured around 6 months and only few patients had viral load measurements at baseline or 6 months. In all regions, the most com-monly used first-line ART regimen was lamivudine (3TC), stavudine (d4T) and nevirapine (NVP), and the majority of patients were started on one of three Figure 1 Logo of the IeDEA
regimens (Table 3). The African IeDEA regions also include smaller cohorts of paediatric patients, which will be described in a separate report.
How often are patients followed
up and what is measured?
As IeDEA is based on routine clinical records, the pa-tient follow-up reflects the standards of care in the participating clinics. For most patients, visits are ini-tially bi-monthly or monthly, and then drop to every 2–3 months as therapy is stabilized (Table 1). Clinics have various methods for tracing patients who miss visits including mobile phone calls/SMS or home
visits. Some sites also involve volunteers from community-based organizations to track patients. Patient tracing is clinic specific, and the methods and capacity for tracing patients is heterogeneous within the regions.
Most data are collected in the context of routine care at baseline and each follow-up visit, including socio-demographic data, contact details to facilitate the tracing of patients, the date of starting ART, type of treatment initiated, and, where available, CD4 counts and HIV-1 plasma RNA levels at baseline and during follow-up. The switching to second-line ART regimens is recorded in all sites, and the reasons for switching in some sites. Resistance testing is not routinely available in any of the programmes, but is Figure 2 Map of 183 ART facilities participating in the four African regions of the International epidemiological Databases to Evaluate AIDS
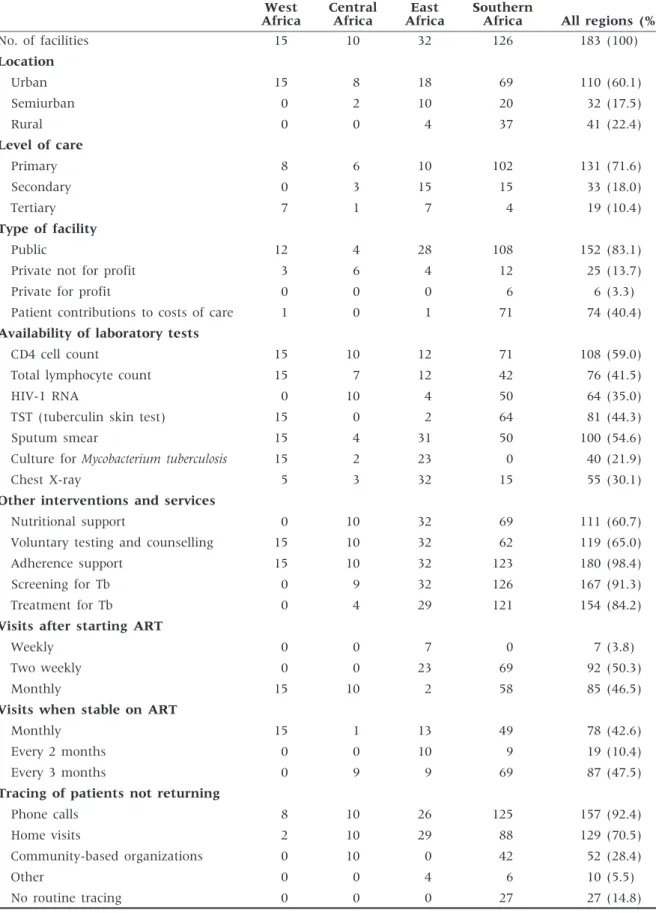
Table 1 Characteristics of 183 facilities providing ART in the African regions of the IeDEA West Africa Central Africa East Africa Southern
Africa All regions (%)
No. of facilities 15 10 32 126 183 (100) Location Urban 15 8 18 69 110 (60.1) Semiurban 0 2 10 20 32 (17.5) Rural 0 0 4 37 41 (22.4) Level of care Primary 8 6 10 102 131 (71.6) Secondary 0 3 15 15 33 (18.0) Tertiary 7 1 7 4 19 (10.4) Type of facility Public 12 4 28 108 152 (83.1)
Private not for profit 3 6 4 12 25 (13.7)
Private for profit 0 0 0 6 6 (3.3)
Patient contributions to costs of care 1 0 1 71 74 (40.4)
Availability of laboratory tests
CD4 cell count 15 10 12 71 108 (59.0)
Total lymphocyte count 15 7 12 42 76 (41.5)
HIV-1 RNA 0 10 4 50 64 (35.0)
TST (tuberculin skin test) 15 0 2 64 81 (44.3)
Sputum smear 15 4 31 50 100 (54.6)
Culture for Mycobacterium tuberculosis 15 2 23 0 40 (21.9)
Chest X-ray 5 3 32 15 55 (30.1)
Other interventions and services
Nutritional support 0 10 32 69 111 (60.7)
Voluntary testing and counselling 15 10 32 62 119 (65.0)
Adherence support 15 10 32 123 180 (98.4)
Screening for Tb 0 9 32 126 167 (91.3)
Treatment for Tb 0 4 29 121 154 (84.2)
Visits after starting ART
Weekly 0 0 7 0 7 (3.8)
Two weekly 0 0 23 69 92 (50.3)
Monthly 15 10 2 58 85 (46.5)
Visits when stable on ART
Monthly 15 1 13 49 78 (42.6)
Every 2 months 0 0 10 9 19 (10.4)
Every 3 months 0 9 9 69 87 (47.5)
Tracing of patients not returning
Phone calls 8 10 26 125 157 (92.4)
Home visits 2 10 29 88 129 (70.5)
Community-based organizations 0 10 0 42 52 (28.4)
Other 0 0 4 6 10 (5.5)
done at some sites in a research context. Important comorbidities and co-infections, including malaria, tu-berculosis and cancer, are recorded in most sites.
A survey of sites is conducted regularly to collect data on (i) level of care (primary, secondary, tertiary), points of entry to programme, typical travel time of patients to clinic, costs to patients; (ii) availability of laboratory tests and radiology, availability of other services (family planning, nutritional support), level of staffing; (iii) eligibility and preparation of patients for ART, waiting times, first-line and second-line ART regimens, and monitoring of ART; (iv) follow-up and assessment of adherence, transfers, tracing of patients lost to follow-up, ascertainment of deaths; (v) and the diagnosis and management of HIV-associated compli-cations, including tuberculosis, cryptococcus, cyto-megalovirus and malaria.
Linkages to routine data sources have been con-ducted in the Republic of South Africa. For example, cohort data were linked with the database of the South African National Health Laboratory Services (NHLS) to obtain additional CD4 cell counts, which were not recorded in the HIV database.11 Similarly, cohorts were linked to the routine mortality data to
improve ascertainment of deaths.11–13 Linkages with cancer registries are under way.
What is attrition like?
Retention in care is an important issue for the African sites participating in IeDEA, and for treatment pro-grammes in resource-limited settings in general.14,15,16 In a recent IeDEA study of 11 treatment programmes in 10 countries (Botswana, Coˆte d’Ivoire, Kenya, Malawi, Rwanda, Senegal, South Africa, Uganda, Zambia, Zimbabwe) loss to follow-up at 1 year ranged from 2.8% to 28.7%. In this study, a patient was considered lost to follow-up if the last visit was 49 months before the closure date for that site, with the closure date defined as the most recent visit date recorded in the database.17 A study from the Central African region found that rates of lost to follow-up, defined as not attending the clinic for six months or longer, were 35% in the Democratic Republic of Congo, 38% in Burundi and 27% in Cameroon.18 Using the same definition, an analysis of IeDEA West Africa found that among patients with at least one follow-up visit 20% of patients were lost to follow-up at 1 year.19The most appropriate definition of loss to follow-up was examined in the Ministry of Health-Centre for Infectious Disease Research in Zambia (MoH-CIDRZ) programme, the largest cohort in the Southern African region.20 The definition that minimized misclassification was ‘at least 2 months late for the last scheduled clinic appointment’.20 Efforts to standardize definitions within and across IeDEA regions are now under way.21
The successful treatment of individual patients and the monitoring and evaluation of ART programmes both depend on regular and complete patient follow-up. Programmes with high rates of loss to follow-up and poor ascertainment of deaths in pa-tients lost will underestimate mortality of all papa-tients starting ART. A meta-analysis of studies tracing pa-tients lost to follow-up found that these papa-tients ex-perience high mortality22 compared with patients remaining in care.23 Standard survival analyses, which censors lost patients, will underestimate overall clinic mortality as censored mortality is estimated from the mortality of patients remaining in care. Analyses of the determinants of survival may also be biased, as empirically demonstrated in an analysis from East Africa.24
IeDEA investigators developed approaches for more accurate and less biased measurements of mortality and determinants of survival. East Africa used meth-ods based on the concept of ‘double sampling’25,26 to adjust mortality estimates based not on those in care, but instead on a subset of patients lost to follow-up whose status was ascertained through extensive tra-cing efforts.27 In another analysis, the same region used patient tracing data to construct weighted Kaplan–Meier curves, which assign the proper
Year No . o f s it e s 2000 2001 2002 2003 2004 2005 2006 2007 2008 2009 0 20 40 60 80 100 120 140 Southern Africa East Africa West Africa Central Africa Year N o . of pat ient s 2000 2001 2002 2003 2004 2005 2006 2007 2008 2009 0 25 000 50 000 75 000 100 000 125 000 150 000 175 000 200 000
Figure 3 Cumulative number of treatment sites (a) and cumulative number of patients starting antiretroviral therapy (b) in the four African regions of the IeDEA
weight to deaths discovered through patient out-reach.28 A study based on data from three regions filled the missing survival times of patients lost to follow-up by multiple imputation, using estimates of mortality from studies that traced patients lost to follow-up.29 The Southern Africa region extended these methods to create a simple nomogram and web calculator (see www.iedea-sa.org) which can be used by programme managers to correct mortality es-timates for loss to follow-up.17
Key findings and publications
Here, we provide an indicative summary of some of the major research themes. A complete list of publi-cations and presentations from the different IeDEA
regions can be found at www.iedea-hiv.org. Mortality and retention in care in children and adults are central to evaluating ART programmes in resource-limited settings, and have been the focus of several analyses. Analyses have considered the first year of ART,15,17,30–33 or the first few years,34–36 and documented high early mortality and loss to follow-up (LTFU), and very high mortality in patients waiting to be treated.11 Significant for programme evaluation, IeDEA Southern Africa found that esti-mates of adult mortality in South Africa substantially increased after data from the Free State Province,11 the Khayelitsha programme,12 or the Themba Lethu Clinic cohort13 were linked with the South African death registry and deaths among patients LTFU included. Analyses of the South African IeDEA data contributed to evaluating the National Antiretroviral Table 2 Baseline characteristics of patients starting antiretroviral therapy at sites participating in the African regions of the IeDEA
West Africa Central Africa East Africa Southern Africa
Total No. of patients 33 368 8902 60 137 184 386
No. of female 21 057 (63.1) 6252 (70.2) 40 531 (67.4) 116 349 (63.1) Gender unknown 145 (0.43) 3 (0.03) 303 (0.50) 4 (0.00) Age (years) 40.6 (34.1–42.8) 38 (32–46) 35.8 (30.2–42.6) 29 (24–36) Unknown 355 (1.1) 7 (0.08) 3680 (6.1) 564 (0.31) Weight (kg) 57 (49–65) 60 (52–70) 55.4 (49.0–62.5) 55 (48–62) Not measured 3367 (10.1) 27 (0.30) 2937 (4.9) 15 107 (8.2) Height (cm) 165 (159–170) 164 (159–170) 164.5 (159.5–170.5) 164.0 (158–170) Not measured 12 340 (37.0) 43 (0.48) 21 964 (36.5) 71 141 (38.6)
Advanced clinical stage (WHO stage III/IV)
12 713 (38.1) 5990 (67.3) 32 237 (53.6) 102 178 (55.4)
WHO stage unknown 6271 (18.8) 29 (0.33) 4973 (8.3) 22 702 (12.3)
Active Tuberculosis 2042 (6.1) 1892 (21.3) 14 326 (23.8) 11 771 (6.4) Unknown 7517 (22.5) 0 0 128 190 (69.5) Haemoglobin (g/dl) 10.2 (9.0–11.6) 11.5 (9.9–13.2) 11.1 (9.5–12.7) 11 (9.4–12.3) Not measured 10 506 (31.5) 4197 (47.2) 34 770 (57.8) 72 340 (39.2) CD4 count (cells/ml)a At baseline 145 (62–237) 211 (110–335) 130 (54–211) 126 (62–192) Not measured 8245 (24.7) 3070 (34.50) 19 590 (32.6) 39 694 (21.5) At 6 month 274 (173–402) 318 (213–481) 254 (162–380) 253 (169–362) Not measured 18 555 (55.6) 8428 (94.7) 38 570 (64.1) 103 791 (56.3)
HIV–1 RNA (log copies/ml)a
At baseline 5.11 (4.07–5.63) 1.97 (1.70–2.40) 5.12 (3.94–5.54) 11.14 (9.74–12.39)
Not measured 32 175 (96.4) 8513 (95.6) 59 819 (99.5) 155 906 (84.6)
At 6 month 2.48 (2.00–2.48) 2.0 (2.00–2.00) 2.60 (2.60–2.60) 4.79 (3.53–5.56)
Not measured 32 114 (96.2) 8880 (99.7) 59 689 (99.3) 155 135 (84.1)
No. of patients or median (interquartile range) are shown.
a
Baseline was defined as the measurement closest to the start of therapy within a window of 3 months before and 1 week after starting therapy. At 6 month was defined as the measurement closed to 6 months within a window of 3–9 months.
Treatment Programme, both for adults32,33 and children.35
Using data for adult patients who started ART in four scale-up programmes in Coˆte d’Ivoire, South Africa, and Malawi from 2004 to 2007, IeDEA inves-tigators developed two prognostic models to estimate the probability of death in patients starting ART in sub-Saharan Africa.23 One model with CD4 cell count, clinical stage, bodyweight, age and sex (CD4 count model); and one that replaced CD4 cell count with total lymphocyte count and severity of anaemia (total lymphocyte and haemoglobin model), because CD4 cell count is not routinely available. Probability of death at 1 year ranged from 0.9% to 52.5% with the CD4 model, and from 0.9% to 59.6% with the total lymphocyte and haemoglobin model. Both models ac-curately predicted early mortality in patients starting ART in sub-Saharan Africa compared with observed data. A web calculator is available at www.iedea-sa .org.
The durability of first-line ART regimens and switching to second-line ART has been another focus. A recent analysis of the United States Agency for International Development–Academic Model Providing Access to Healthcare (USAID-AMPATH) partnership, a large treatment programme in western Kenya, found that ART discontinuation was more common among patients with advanced disease and those receiving a zidovudine-containing regimen.37 A further analysis of data from all four African IeDEA regions found that many patients did not switch to a second-line regimen, despite developing treatment failure.38 Unsurprisingly, these patients experienced high mortality.38
IeDEA has also supported public health programmes through analyses for UNAIDS or WHO. African IeDEA data were used to parameterize the Spectrum projec-tion package, used to estimate the impact of HIV in low and middle-income countries.39 Similarly, IeDEA data were used to evaluate different sampling strate-gies to assess programmatic indicators of the quality of care.40 A study comparing mortality of HIV-infected patients starting ART in sub-Saharan Africa
with background mortality in Coˆte d’Ivoire, Malawi, South Africa and Zimbabwe used estimates of HIV-unrelated mortality rates from WHO’s Global Burden of Disease project.36 Finally, IeDEA West Africa documented important differences in treatment response in patients infected with HIV-1 and HIV-2, with implications for future treatment guidelines.1
What are the main strengths and
weaknesses?
The IeDEA networks in Africa provide a unique plat-form for operational and clinical research that is highly relevant to the scale-up of ART in sub-Saharan Africa. The large number of participating sites and large number of patients followed in high burden countries are important strengths allowing for determination of outcomes at the individual and pro-gramme level. The data reflect routine care across the range of care settings: urban and rural clinics, large and very large programmes run by national health systems, smaller clinics run by non-governmental or-ganizations, and private clinics. The data undergo considerable data cleaning, and the regional teams work closely with clinic staff to understand and cor-rect data quality problems. The AMPATH programme in East Africa provides next day access to study data and individual patient temporal trend graphs, for in-stance weight and CD4 count, to improve clinical management. These graphs are put in patient charts after data entry so that they are readily available and interpretable. By making data relevant to clinic per-sonnel, the consortium strengthens the relevance of data and increases clinical commitment to collection. The service delivery models, clinical protocols, moni-toring schedules and efforts in place to trace patients lost to follow-up vary widely between sites. This di-versity of data gives IeDEA substantial ability to gen-eralize findings across different care delivery settings. The data collected within IeDEA are observational and causal inferences are challenging. Furthermore, participation in IeDEA indicates that the facility has Table 3 The three most common antiretroviral first-line regimens used in facilities enrolled in the four African regions of the IeDEA, 2000–10
Anti-retroviral regimen
West Africa Central Africa East Africa Southern Africa
Rank No. on regimen (%) Rank No. on regimen (%) Rank No. on regimen (%) Rank No. on regimen (%) 3TC-d4T-NVP 1 10 098 (30.3) 1 4374 (49.2) 1 36 418 (60.6) 1 66 369 (36.0) AZT-3TC-NVP 2 5033 (15.1) 2 1745 (19.6) 2 7486 (12.4) AZT-3TC-EFV 3 4992 (15.0) 3 696 (7.8) 3 4730 (7.9) 3 29 098 (15.8) 3TC-d4T-EFV 2 45 421 (24.6) Other – 13 255 (39.6) – 2087 (23.4) – 11503 (19.1) – 43 498 (23.6)
a certain level of capacity in data management and patient follow-up. The participating programmes are more likely than non-participating facilities to be equipped with electronic medical record systems and to have access to CD4 cell counts and second-line therapy, which may reflect a higher clinical capacity generally. Understanding the contextual variables which differentiate IeDEA sites from other care facil-ities is therefore important. Other weaknesses relate to the quality of the data, with missing data in key variables, varying definitions and data collection protocols, and a high rate of loss to follow-up. In the years to come, the African regions of IeDEA will address these challenges by an iterative process of quality improvement where those variables found to be the most important are harmonized first and their quality emphasized in data improvement efforts. IeDEA will also perform dedicated multicentre studies to address specific questions, and continue to develop advanced statistical methods that can account for missing data, loss to follow-up and competing risks, and time-dependent confounding.
Where can I find out more?
The participating sites sign an agreement to allow their data to be used in IeDEA, however, data own-ership remains at the clinic level and all analyses have to be approved by the regional Steering Groups and, if analyses involve several regions, by the Executive Committee of IeDEA. The IeDEA Executive Committee is charged with facilitating data access for all worthy research projects. We welcome collab-orations with other cohort studies or cohort collabor-ations, and other interested parties, for example mathematical modelers or colleagues working in international organizations. Readers who wish to find out more should visit the IeDEA website (www.iedea-hiv.org) where they will find contact de-tails and links to the websites of the different regions.
Funding
The study is funded by the National Institutes of Allergy and Infectious Diseases (NIAID).
References
1Global report: UNAIDS report on the global AIDS epi-demic 2010. 2010. Geneva, Joint United Nations Programme on HIV/AIDS (UNAIDS), 2010. http://www. unaids.org/globalreport/Global_report.htm (17 March 2011, date last accessed).
2Egger M, Hirschel B, Francioli P et al. Impact of new antiretroviral combination therapies in HIV infected pa-tients in Switzerland: prospective multicentre study. BMJ 1997;315:1194–99.
3
Palella FJ, Delaney KM, Moorman AC et al. Declining morbidity and mortality among patients with advanced human immunodeficiency virus infection. N Engl J Med 1998;338:853–60.
4
Gilks CF, Crowley S, Ekpini R et al. The WHO public-health approach to antiretroviral treatment against HIV in resource-limited settings. Lancet 2006;368:505–10. 5
World Health Organization. Antiretroviral therapy of HIV infection in infants and children: towards universal access. Recommendations for a public health approach: 2010 revision. Geneva: World Health Organization, 2010.
http://www.who.int/hiv/pub/paediatric/infants2010/en/ index.html (17 March 2011, date last accessed). 6
World Health Organization. Antiretroviral therapy for HIV infection in adults and adolescents. Recommendations for a public health approach: 2010 revision.http://www.who. int/hiv/pub/arv/adult2010/en/index.html (17 March 2011, date last accessed).
7Egger M, Boulle A, Schechter M, Miotti P. Antiretroviral therapy in resource-poor settings: scaling up inequalities? Int J Epidemiol 2005;34:509–12.
8
National Institute of Allergy and Infectious Diseases (NIAID). Request for Applications. International Epidemiologic Databases to Evaluate AIDS (IEDEA). Bethesda, NIDAID, 2005. http://grants.nih.gov/grants/ guide/notice-files/NOT-AI-05-049.html (17 March 2011, date last accessed).
9
Gange SJ, Kitahata MM, Saag MS et al. Cohort profile: the North American AIDS Cohort Collaboration on Research and Design (NA-ACCORD). Int J Epidemiol 2007;36:294–301.
10McGowan CC, Cahn P, Gotuzzo E et al. Cohort Profile: Caribbean, Central and South America Network for HIV research (CCASAnet) collaboration within the International Epidemiologic Databases to Evaluate AIDS (IeDEA) programme. Int J Epidemiol 2007;36:969–76. 11
Ingle SM, May M, Uebel K et al. Outcomes in patients waiting for antiretroviral treatment in the Free State Province, South Africa: prospective linkage study. AIDS 2010;24:2717–25.
12
Boulle A, Van Cutsem G, Hilderbrand K et al. Seven-year experience of a primary care antiretroviral treatment pro-gramme in Khayelitsha, South Africa. AIDS 2010;24: 563–72.
13Fox MP, Brennan A, Maskew M, MacPhail P, Sanne I. Using vital registration data to update mortality among patients lost to follow-up from ART programmes: evi-dence from the Themba Lethu Clinic, South Africa. Trop Med Int Health 2010;15:405–13.
14
Rosen S, Fox MP, Gill CJ. Patient retention in antiretro-viral therapy programs in sub-Saharan Africa: a system-atic review. PLoS Med 2007;4:e298.
15
Brinkhof MW, Dabis F, Myer L et al. Early loss of HIV-infected patients on potent antiretroviral therapy programmes in lower-income countries. Bull World Health Organ 2008;86:559–67.
16
Geng EH, Nash D, Kambugu A et al. Retention in care among HIV-infected patients in resource-limited settings: emerging insights and new directions. Curr HIV/AIDS Rep 2010;7:234–44.
17
Egger M, Spycher BD, Sidle J et al. Correcting mortality for loss to follow-up: a nomogram applied to
antiretroviral treatment programmes in sub-Saharan Africa. PLoS Med 2011;8:e1000390.
18
Losoma JA, Kiumbu M, Azinyue I, Mukumbi H, Ryder R. Losses to follow-up in 3 Central African country non-PEPFAR ART delivery programs. 5th IAS Conference on HIV Pathogenesis, Treatment and Prevention Cape Town, 19–22, July 2009; Abstract WEPED176.
19
Ekouevi DK, Balestre E, Ba-Gomis FO et al. Low retention of HIV-infected patients on antiretroviral therapy in 11 clinical centres in West Africa. Trop Med Int Health 2010;15(Suppl. 1):34–42.
20
Chi BH, Cantrell RA, Mwango A et al. An empirical ap-proach to defining loss to follow-up among patients en-rolled in antiretroviral treatment programs. Am J Epidemiol 2010;171:924–31.
21Chi B, Westfall A, Fox M et al. Empirically defining lost to follow-up for antiretroviral therapy programs in Southern Africa. XVIII International AIDS Conference, Vienna, 18–23, July 2010.
22
Brinkhof MW, Pujades-Rodriguez M, Egger M. Mortality of patients lost to follow-up in antiretroviral treatment programmes in resource-limited settings: systematic review and meta-analysis. PLoS One 2009;4: e5790.
23
May M, Boulle A, Phiri S et al. Prognosis of patients with HIV-1 infection starting antiretroviral therapy in sub-Saharan Africa: a collaborative analysis of scale-up programmes. Lancet 2010;376:449–57.
24
Geng EH, Glidden DV, Emenyonu N et al. Tracking a sample of patients lost to follow-up has a major impact on understanding determinants of survival in HIV-infected patients on antiretroviral therapy in Africa. Trop Med Int Health 2010;15(Suppl. 1):63–69.
25Frangakis CE, Rubin DB. Addressing an idiosyncrasy in estimating survival curves using double sampling in the presence of self-selected right censoring. Biometrics 2001; 57:333–42.
26
Baker SG, Wax Y, Patterson BH. Regression analysis of grouped survival data: informative censoring and double sampling. Biometrics 1993;49:379–89.
27
Yiannoutsos CT, An MW, Frangakis CE et al. Sampling-based approaches to improve estimation of mortality among patient dropouts: experience from a large PEPFAR-funded program in Western Kenya. PLoS One 2008;3:e3843.
28
Geng EH, Emenyonu N, Bwana MB, Glidden DV, Martin JN. Sampling-based approach to determining outcomes of patients lost to follow-up in antiretroviral therapy scale-up programs in Africa. JAMA 2008;300: 506–07.
29Brinkhof MW, Spycher BD, Yiannoutsos C et al. Adjusting mortality for loss to follow-up: analysis of five ART
programmes in sub-Saharan Africa. PLoS ONE 2010;5: e14149.
30Fenner L, Brinkhof MW, Keiser O et al. Early mortality and loss to follow-up in HIV-infected children starting antiretroviral therapy in Southern Africa. J Acquir Immune Defic Syndr 2010;54:524–32.
31Brinkhof MW, Spycher BD, Yiannoutsos CT et al. Adjusting mortality for loss to follow-up: analysis of five ART programmes in sub-Saharan Africa. PLoS One 2010;5:e14149.
32Cornell M, Technau K, Fairall L et al. Monitoring the South African National Antiretroviral Treatment Programme, 2003-2007: the IeDEA Southern Africa col-laboration. S Afr Med J 2009;99:653–60.
33
Cornell M, Grimsrud A, Fairall L et al. Temporal changes in programme outcomes among adult patients initiating antiretroviral therapy across South Africa, 2002-2007. AIDS 2010;24:2263–70.
34
Keiser O, Orrell C, Egger M et al. Public-health and indi-vidual approaches to antiretroviral therapy: township South Africa and Switzerland compared. PLoS Med 2008; 5:e148.
35
Davies MA, Keiser O, Technau K et al. Outcomes of the South African National Antiretroviral Treatment Programme for children: the IeDEA Southern Africa col-laboration. S Afr Med J 2009;99:730–37.
36
Brinkhof MW, Boulle A, Weigel R et al. Mortality of HIV-infected patients starting antiretroviral therapy in sub-Saharan Africa: comparison with HIV-unrelated mor-tality. PLoS Med 2009;6:e1000066.
37
Braitstein P, Ayuo P, Mwangi A et al. Sustainability of first-line antiretroviral regimens: findings from a large HIV treatment program in western Kenya. J Acquir Immune Defic Syndr 2010;53:254–59.
38
Keiser O, Tweya H, Braitstein P et al. Mortality after fail-ure of antiretroviral therapy in sub-Saharan Africa. Trop Med Int Health 2010;15:251–258.
39
Mahy M, Lewden C, Brinkhof MW et al. Derivation of parameters used in Spectrum for eligibility for antiretro-viral therapy and survival on antiretroantiretro-viral therapy. Sex Transm Infect 2010;86(Suppl. 2):ii28–34.
40
Tassie JM, Malateste K, Pujades-Rodriguez M et al. Evaluation of three sampling methods to monitor outcomes of antiretroviral treatment programmes in low- and middle-income countries. PLoS ONE 2010;5: e13899.
41
Drylewicz J, Eholie S, Maiga M et al. First-year lympho-cyte T CD4þ response to antiretroviral therapy according to the HIV type in the IeDEA West Africa collaboration. AIDS 2010;24:1043–50.