ARTICLE
Hyperglycaemia but not hyperlipidaemia causes beta cell
dysfunction and beta cell loss in the domestic cat
E. Zini&M. Osto&M. Franchini&F. Guscetti&
M. Y. Donath&A. Perren&R. S. Heller&P. Linscheid& M. Bouwman&M. Ackermann&T. A. Lutz&
C. E. Reusch
Received: 21 May 2008 / Accepted: 30 September 2008 / Published online: 26 November 2008 # Springer-Verlag 2008
Abstract
Aims/hypothesis In vitro studies point to a toxic effect of high glucose and non-esterified fatty acids on beta cells. Whether elevated levels of glucose and lipids induce beta cell loss in vivo is less clear. The domestic cat has recently been proposed as a valuable animal model for human type 2 diabetes because feline diabetes shows several similarities with diabetes in humans, including obesity-induced insulin resistance, impaired beta cell function, decreased number of beta cells and pancreatic amyloid deposition.
Methods We infused healthy cats with glucose or lipids for 10 days to clamp their blood concentrations at the approx-imate level found in untreated feline diabetes (glucose: 25– 30 mmol/l; triacylglycerols: 3–7 mmol/l).
Results Glucose and lipid levels were adequately targeted. Plasma non-esterified fatty acids were increased by lipid infusion 1.7-fold. A dramatic and progressive decline of plasma insulin levels was observed in glucose-infused cats beginning after 2 days of hyperglycaemic clamp. In contrast, plasma insulin concentration and glucose tolerance test were not affected by hyperlipidaemia. Compared with controls, glucose-infused cats had a 50% decrease in beta cells per pancreatic area. Apoptotic islet cells and cleaved caspase-3-positive beta cells were observed in glucose-infused cats only.
Conclusions/interpretation Sustained hyperglycaemia but not hyperlipidaemia induces early and severe beta cell dys-function in cats, and excess glucose causes beta cell loss via DOI 10.1007/s00125-008-1201-y
Electronic supplementary material The online version of this article
(doi:10.1007/s00125-008-1201-y) contains supplementary material,
which is available to authorised users.
E. Zini (*)
:
P. Linscheid:
C. E. ReuschClinic for Small Animal Internal Medicine, Vetsuisse Faculty, University of Zürich,
Winterthurerstrasse 260, 8057 Zurich, Switzerland e-mail: [email protected]
M. Osto
:
T. A. LutzInstitute of Veterinary Physiology, Vetsuisse Faculty, University of Zürich,
Zurich, Switzerland
M. Franchini
:
M. AckermannInstitute of Virology, Vetsuisse Faculty, University of Zürich, Zurich, Switzerland
F. Guscetti
Institute of Veterinary Pathology, Vetsuisse Faculty, University of Zürich,
Zurich, Switzerland
M. Y. Donath
Division of Endocrinology and Diabetes and Center for Integrated Human Physiology, University Hospital of Zürich,
Zurich, Switzerland A. Perren
Department of Pathology, Technische Universität München, Klinikum Rechts der Isar,
Munich, Germany R. S. Heller
Department of Developmental Biology, Hagedorn Research Institute,
Gentofte, Denmark M. Bouwman
Department of Clinical Sciences of Companion Animals, Utrecht University,
apoptosis in vivo. Hyperglycaemic clamps in cats may provide a good model to study the pathogenesis of glucose toxicity in beta cells.
Keywords Apoptosis . Diabetes . Feline . Glucose toxicity . Hyperglycaemia . Hyperlipidaemia
Abbreviations
BWm mean body weight
H&E haematoxylin and eosin
Ki67 antigen identified by monoclonal antibody Ki-67
NKX6.1 NK6 homeobox 1
PAS periodic acid–Schiff’s reagent PCNA proliferating nuclear antigen
Introduction
Based on results from rodent and human islet cells in culture, poorly controlled hyperglycaemia and hyperlipidaemia in diabetic patients may negatively affect beta cells, leading to a vicious cycle of progressive deterioration of beta cell function and ultimately to beta cell loss [1]. The detrimental effects of sustained high glucose and lipid levels on insulin secretion and beta cell viability are referred to as glucotox-icity and lipotoxglucotox-icity [2,3].
In vitro studies demonstrated that human beta cells exposed to high glucose levels have a higher rate of apoptosis [4,5]. Recently, however, the role of excess glucose on beta cell apoptosis in human diabetes was questioned based on a post-mortem study [6]. In that study, humans with recent-onset type 1 diabetes had only a modest degree of apoptosis in the remaining beta cells, despite prevailing hyperglycaemia in most individuals [6]. Similar to the in vitro effects of high glucose levels, NEFA seem to be harmful to beta cells when present at high concentrations. High levels of saturated NEFA, in particular palmitate, induce apoptosis indepen-dently from glucose levels in cultured human and rat islets [7,8].
Several groups used a variety of glucose and lipid infu-sion protocols to investigate the direct effects of hyper-glycaemia and hyperlipidaemia on beta cells in vivo [9–19]. In previous studies performed in rodents, glucose and lipid solutions were administered at a constant rate and for only 2–4 days. Constant rate infusion, however, does not allow the maintenance of a specific level of hyperglycaemia or hyperlipidaemia. In most studies, hyperglycaemia and hyperlipidaemia were short-lasting or of mild degree, and beta cell dysfunction and loss were not consistently shown. To investigate the mechanisms of glucotoxicity and lipo-toxicity in vivo, infusion protocols should allow sustained
and long-term hyperglycaemia or hyperlipidaemia at spe-cific levels. Targeting blood glucose and lipid levels within a predefined range can be achieved by frequently adjusting the infusion rate. Based on our experience with pets, domestic cats can be amenable to such chronic infusion studies.
The present study was therefore conducted to test whether sustained high levels of glucose or lipid lead to beta cell dysfunction and beta cell loss in vivo. Cats provide an interesting model because they spontaneously develop a form of diabetes very similar to human type 2 diabetes [20–22]. Diabetic cats are often middle aged, a genetic predisposition is described, obesity leading to insulin resistance is a major risk factor, and impaired beta cell function is present. The most striking histological similarity between human type 2 diabetes and the disease in cats is amylin-derived islet amyloidosis. It is found in more than 80% of diabetic felines. Most diabetic cats have beta cell loss of at least 50% [22–26]. Here, cats were infused for 10 days with glucose or lipids to clamp their blood concentrations at the approximate level found in untreated feline diabetes (glucose 25– 30 mmol/l; triacylglycerols 3–7 mmol/l) [27,28].
Methods
Animals and infusions Twenty-two neutered male, 15- to 18-month-old, healthy domestic shorthair cats (Charles River, L’Arbresle, France) were used following principles of laboratory animal care (Veterinary Office of Zürich, Switzerland, # 51/2007).
Cats were randomly divided into four groups. Groups I, II and III were infused over 10 days through a jugular catheter. Group I (six cats) received 50% glucose added to saline. Blood glucose was evaluated six to 12 times daily and the infusion rate was adjusted to target levels at 25– 30 mmol/l. Group II (six cats) received lipids (Lipovenoes 10%; Fresenius-Kabi, Bad Homburg, Germany). The lipid composition is given in Electronic supplementary material (ESM) Table 1. Blood triacylglycerols were measured two or three times daily to target levels at 3–7 mmol/l. Group III (five cats) served as the control and was infused with saline. During the 10-day infusion, cats were housed in single cages. The remaining five cats (group IV) served as additional controls; they were not infused and were group-housed during the study. They allowed the investigation of the potential confounding effect of experiment-induced stress on glucose and lipid metabolism.
Biochemical measurements Plasma glucose was measured by a colorimetric hexokinase/glucose-6-phosphate dehydro-genase method, and triacylglycerols were measured by a colorimetric assay using glycerophosphate oxidase coupled
to phenol and 4-aminophenazone (Roche, Vienna, Austria). Serum sodium and potassium were analysed with the ion-selective electrode method (Roche). Serum NEFA were mea-sured using the NEFA-C kit (Wako, Richmond, PA, USA), plasmaβ-hydroxybutyrate with the 3-hydroxybutyrate de-hydrogenase method (Randox, Crumlin, UK).
A cross-reacting porcine insulin radioimmunoassay (Linco, St Charles, MO, USA) was validated for cats (see ESM Validation of the porcine insulin radioimmunoassay for use in cats). Serum cortisol was measured by a competitive chemiluminescent immunoassay previously validated in cats (Bayer, Tarrytown, NY, USA) [29].
The acute-phase proteins of inflammation α1-acid
glycoprotein and serum amyloid A were measured in plasma using a feline-specific radial immunodiffusion test and ELISA (Tridelta, Bray, Ireland).
Assessment of beta cell function During the 10-day infusion in groups I–III overnight fasting blood samples were collected through the jugular catheter daily at 08:00 hours to measure glucose and insulin. An IVGTT was performed under anaesthesia in groups I–III 1 h after the 10-day infusion. Group IV was also admitted to the IVGTT. A glucose bolus of 1 g/kg was administered via the jugular catheter. Glucose and insulin were measured before the bolus and from 5 to 120 min thereafter. To estimate beta cell function the insulin secretion index was calculated (see ESM Insulin secretion in cats) [30]. After IVGTT, cats were killed and the pancreas was excised.
Insulin content of the pancreas Pancreatic insulin content was measured in a tissue specimen from the pancreas left lobe and 24 h later homogenised in 0.18 mol/l HCl in 70% ethanol. Results were normalised to the sample’s protein content measured by spectrophotometry (ND-1000, NanoDrop, Wilmington, DE, USA) at 280 nm.
Islet pathology Right and left lobes, and the body of the pancreas were examined. One aliquot of each was formalin-fixed for 24 h and paraffin-embedded. An additional aliquot collected from the left lobe was snap-frozen in liquid nitrogen and stored at−80°C.
Paraffin sections were stained with haematoxylin and eosin (H&E) for histomorphometry. For islet amyloid deposits, additional sections were stained with thioflavine-T and Congo red. For glycogen, frozen tissue sections were stained with periodic acid–Schiff’s reagent (PAS) with or without diastase digestion (1% α-amylase from Bacillus subtilis; Sigma-Aldrich, Buchs, Switzerland). A frozen section was stained with Oil Red O to detect islet accu-mulation of lipids.
Immunohistochemical staining procedures for insulin, amylin, NK6 homeobox 1 (NKX6.1), glucagon, cleaved
caspase-3, antigen identified by monoclonal antibody Ki-67 (Ki67), proliferating nuclear antigen (PCNA) and myelo-peroxidase (for neutrophils) were performed as described in ESM Histochemistry methods.
Insulin-, amylin- and glucagon-positive areas relative to the pancreatic area were calculated using ImageJ software (http://rsb.info.nih.gov/ij/) on 15 pictures collected from each cat at ×4 magnification. Large vessels, ducts and interlobular tissue were excluded from measurements.
The number of beta cells relative to the pancreatic area was calculated by counting NKX6.1-positive nuclei in sections that were double-stained with insulin and NKX6.1. Twenty pictures were collected from each cat at ×10 magnification using Image J.
Five-thousand cells were used to calculate the number of apoptotic islet cells, cleaved caspase-3-positive beta cells, Ki67-positive or PCNA-positive beta cells, and islet myeloperoxidase-immunostained neutrophils. Counts were not performed in small islets with the longer axis below 50μm. Neutrophils were also counted in the exocrine pancreas in 50 microscopic fields at ×40 magnification, excluding those in large vessels.
Isolation of islets, RNA isolation, reverse transcription and quantitative analysis of mRNA Islet isolation was per-formed as described by E. Zini and C. E. Reusch (unpublished results). Total RNA from islets was extracted using the RNeasy Mini Kit (Qiagen, Basel, Switzerland). Genomic DNA contamination was eliminated by including DNase treatments (DNase-Free DNase Set, Qiagen). RNA quality was assessed by gel electrophoresis. The comple-mentary DNA (cDNA) was obtained from 1μg samples of RNA (Omniscript RT-Kit, Qiagen) in the presence of 13 U of RNasin (Promega, Madison, WI, USA).
Islet cDNA was subjected to quantitative real-time PCR using feline-specific oligonucleotides established for insu-lin, Fas receptor, the caspase-8 inhibitor Flip (also known as Cflar), the chemokines Il8 and Mcp-1 (also known as Ccl2) and the housekeeping gene cyclophilin A (ESM Table2). Published sets of primers and probes for feline Il6, Il1b, Tnfα (also known as Tnf) and the control gene Gapdh were also used (ESM Table2) [31].
For SYBR-Green and probe-based assays, PCR were performed (E. Zini and C. E. Reusch, unpublished results). The cDNA samples were run in triplicate and transcripts were quantified using the relative standard curve method. Gene expression was normalised to cyclophilin A and Gapdh.
Statistical analysis
Data are expressed as mean±SE. Data were analysed using GraphPad Prism 4.0 (GraphPad, San Diego, CA, USA).
Results in glucose-, lipid- or saline-infused cats were compared using the Kruskal–Wallis and Dunn’s tests. Experimentally induced stress was assessed by comparing the results of group III (saline) and group IV (no infusion) using a Mann–Whitney test. Significance was set at p<0.05. Pathology slides were evaluated in a blinded manner by two investigators (E. Zini, A. Perren or R.S. Heller).
Results
Ten-day hyperglycaemic and hyperlipidaemic clamps are well tolerated in cats One cat receiving glucose was used as a pilot. Glucose was well targeted between 25 and 30 mmol/l from day 3 of infusion (ESM Fig. 1). The cat tolerated glucose infusion without obvious discomfort. This cat was not used for further analyses.
In the remaining five glucose-infused cats, the expected glucose range (25–30 mmol/l) was reached within 3–5 h after infusion onset and was maintained for ten consecutive days (Fig. 1a). Food intake appeared unaltered and, based on daily physical examinations and electrolyte monitoring, the cats were considered in good health (not shown). With urine dipstick testing (Combur10-Test, Roche) severe glucosuria (4+) was observed from day 1. Ketonuria was never detected. At the end of the infusion plasma β-hydroxybutyrate levels were not different between glucose-infused cats, cats receiving saline and animals that were not infused (glucose: 179±46 μl/l; saline: 180±32 μl/l; no infusion: 157±23 μl/l). Mean body weight (BWm) was
unchanged from baseline after 10 days of glucose infusion (BWm day 0: 4.14 kg; BWm day 10: 4.10 kg; BWm
difference:1.0%) (Fig.1b).
Triacylglycerols were targeted at 3–7 mmol/l for most of the infusion period in lipid-infused cats (Fig.1c). For 2 days, hyperlipidaemia was difficult to target in three cats and triacylglycerol levels transiently reached 23–45 mmol/l. During that time, two of the cats showed lethargy that rapidly resolved after reduction of the lipid infusion rate. The NEFA area under the curve calculated above zero was significantly
1 2 3 4 5 6 7 8 9 10 3 4 5 6 20 25 30 35 Time (days) Time (days) Time (days)
Blood glucose (mmol/l)
Pre Post Pre Post Pre Post
3.0 3.5 4.0 4.5 5.0 5.5
Saline Glucose Lipids
Body weight (kg) 1 2 3 4 5 6 7 8 9 10 0.2 0.7 1.2 1.33 7 14 21
Plasma triacylglycerols (mmol/l)
2 3 4 5 6 7 8 9 0.0 0.5 1.0 1.5 2.0 NEFA (mmol/l)
a
b
c
d
Fig. 1 a Blood glucose levels during the 10 day infusion period inglucose-infused (black rhombus), lipid-infused (white triangle) and saline-infused (black triangle) cats. Hyperglycaemia in glucose-infused
cats was maintained at 25–30 mmol/l (shaded area). Blood glucose
levels slightly increased in lipid-infused cats between days 5 and 10 (average increase above baseline 0.7 mmol/l), but remained within the limits reported for healthy cats (Clinical Laboratory of the Vetsuisse Faculty, University of Zürich; reference range: 3–8 mmol/l). Values are expressed as mean±SE. b Body weight of saline-, glucose- or lipid-infused cats before (Pre) and after (Post) infusion. After infusion, body weight decreased slightly in saline-infused cats (average difference 4.3%), was stable in glucose-infused cats (average difference 1.0%) and significantly increased in lipid-infused cats (average difference 10.7%; p<0.05). Individual values are shown. c Triacylglycerol levels during the 10 day infusion period in glucose-infused (black rhombus), infused (white triangle) and saline-infused (black triangle) cats. In lipid-infused cats hyperlipidaemia was maintained over 10 days of infusion.
Plasma triacylglycerol levels were adequately maintained at 3–7 mmol/l,
in particular between days 3 and 10 (shaded area). Values are expressed as mean±SE. d Circulating NEFA were measured eight times (from day 2 to 9) during the infusion period in each glucose-infused (black rhombus), lipid-infused (white triangle) and saline-infused (black triangle) cat. Values are expressed as mean±SE. The calculated area under the curve for NEFA was higher in lipid-infused cats than in saline-infused cats (p<0.05) or glucose-infused cats (p<0.01)
higher in lipid-infused cats than in saline-infused (p<0.05) or glucose-infused (p<0.01) cats (Fig. 1d). In some cats, however, NEFA levels varied during infusion. In all lipid-infused cats, food intake, physical examination and electro-lytes were normal throughout infusion. Lipaemic plasma prevented quantification ofβ-hydroxybutyrate. Body weight significantly increased by 10% after 10 days of infusion in all lipid-infused cats (BWm day 0: 3.92 kg; BWm day 10:
4.33 kg; p<0.05) (Fig.1b).
In saline-infused cats, food intake, physical examination and electrolytes were normal. Body weight decreased slightly during infusion (BWm day 0: 4.18 kg; BWm day 10:
4.00 kg; BWmdifference: 4.3%) (Fig. 1b).
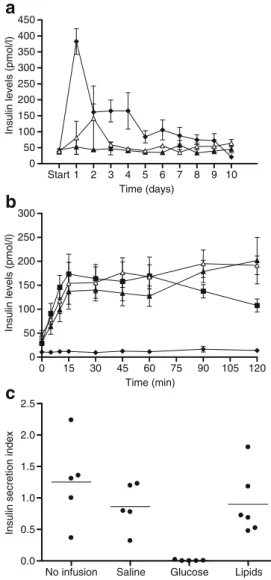
As an indicator of stress, plasma cortisol was measured in cats from groups I–III at the end of infusion. Cortisol levels were not different between glucose-, lipid- or saline-infused cats (glucose: 71.7 ±5.5 nmol/l; lipids: 66.2 ± 16.6 nmol/l; saline: 121.4±22.1 nmol/l). Cats in group IV (no infusion) had significantly lower cortisol concentrations than saline-infused cats (27.6±13.8 nmol/l; p<0.05). Beta cell function is severely impaired by 10 days of glucose infusion but not lipid infusion On day 1, glucose-infused cats had a tenfold increase in morning plasma insulin compared with baseline. On day 2 insulin levels markedly declined and remained stable until day 4. There-after, despite prevailing hyperglycaemia, morning insulin dropped further to concentrations close to the detection limit of the assay by day 10 (Fig.2a).
In cats on triacylglycerol infusion, blood glucose was slightly elevated from day 4 to 10 compared with saline-infused cats (Fig.1a). Cats with hyperlipidaemia had insulin concentrations similar to cats on saline throughout the infusion period except for day 1–2, where one single cat transiently had higher levels (Fig.2a). This cat concurrently had two of the mentioned episodes of severe hyperlipidaemia.
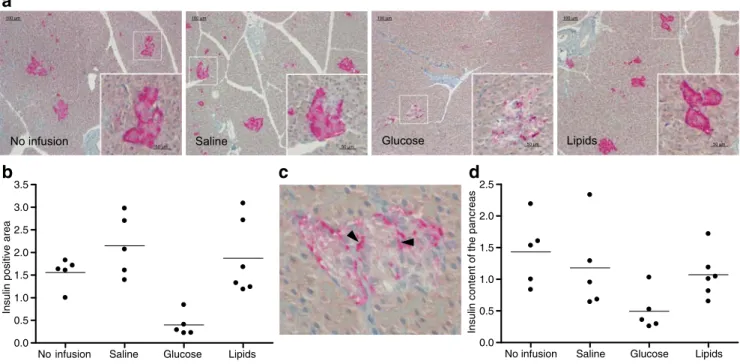
One hour after the end of infusion an IVGTT was performed. Glucose-infused cats had no stimulation of insulin secretion. Lipid-infused cats had a glucose-induced secretory response similar to controls (Fig.2b). The insulin secretion index was significantly lower in glucose-infused cats than in saline- (p<0.05) and lipid-infused cats (p< 0.05) but did not differ between the other groups (Fig.2c). The insulin-positive area in the pancreas is markedly decreased after 10 days of glucose infusion but not lipid infusion In glucose-infused cats, morphometric analysis of sections stained for insulin showed severe reduction of the insulin-positive area relative to the pancreatic area. On average, the insulin-positive area was 80% smaller in glucose-infused than in saline-infused cats (Fig. 3a,b). Lipid-infused and saline-infused cats were similar, no difference was observed between controls.
In glucose-infused cats insulin immunostaining was condensed at the periphery. In beta cells lined by capillaries it was often selectively located towards the cytoplasmic membrane adjacent to the endothelial cells. In the other groups insulin was homogeneously distributed throughout the cytoplasm (Fig. 3c).
Start 1 2 3 4 5 6 7 8 9 10 0 50 100 150 200 250 300 350 400 450 Time (days) Time (min)
Insulin levels (pmol/l)
0 15 30 45 60 75 90 105 120 0 50 100 150 200 250 300
Insulin levels (pmol/l)
No infusion Saline Glucose Lipids
0.0 0.5 1.0 1.5 2.0 2.5
Insulin secretion index
a
b
c
Fig. 2 a Plasma insulin levels during the 10 day period of glucose, lipids and saline infusion in cats. In glucose-infused cats (black rhombus) insulin concentrations markedly increased during the first 24 h and progressively decreased thereafter. In lipid-infused cats (white triangle) insulin concentrations did not differ from those in saline-infused cats (black triangle). Values are expressed as mean±SE. b Insulin levels during the IVGTT performed 1 h after the 10 day period of infusion. Insulin levels did not increase in glucose-infused cats (black rhombus) whereas lipid-infused cats (white triangle), saline-infused cats (black triangle) and cats without infusion (black square) had a similar insulin response. Values are expressed as mean± SE. c Insulin secretion index derived from the IVGTT (formula in ESM Insulin secretion in cats). The insulin secretory index was significantly lower in glucose-infused cats than in cats infused with saline (p<0.05) or lipids (p<0.05). Values are expressed relative to one cat without infusion; individual values and means are shown
The insulin content of pancreatic specimens was reduced in four of the glucose-infused cats (Fig.3d).
The amylin- and glucagon-positive areas relative to the pancreatic area were not different between groups (not shown). However, the amylin-positive area showed a relatively large variation of up to 200% (threefold difference) in cats infused with saline or cats without infusion. This variation may be a confounding factor to reliably detect differences in the amylin-positive area between groups. Similar to insulin immunostained sections, amylin immuno-staining in glucose-infused cats was unevenly distributed in the cytoplasm of several beta cells. To exclude the possibility that deposits of amylin-derived amyloid were included in the measurement of the amylin-positive area, sections were stained with thioflavine-T and Congo red. Amyloid deposits were not detected with either method in any cat.
Severe loss of beta cells occurs after a 10 day glucose infusion but not lipid infusion Beta cell number was estimated by counting beta cell nuclei stained with NKX6.1 relative to the pancreatic area. Compared with the number of beta cells in saline- or lipid-infused cats, beta cells in glucose-infused cats were reduced by about half (p<0.05) (Fig.4a,b). This
was also evident when islet cell nuclei were evaluated on H&E-stained sections because the majority of islet cells appeared to contain clear cytoplasm and considerable areas of the islets appeared devoid of nuclei (Fig.4c).
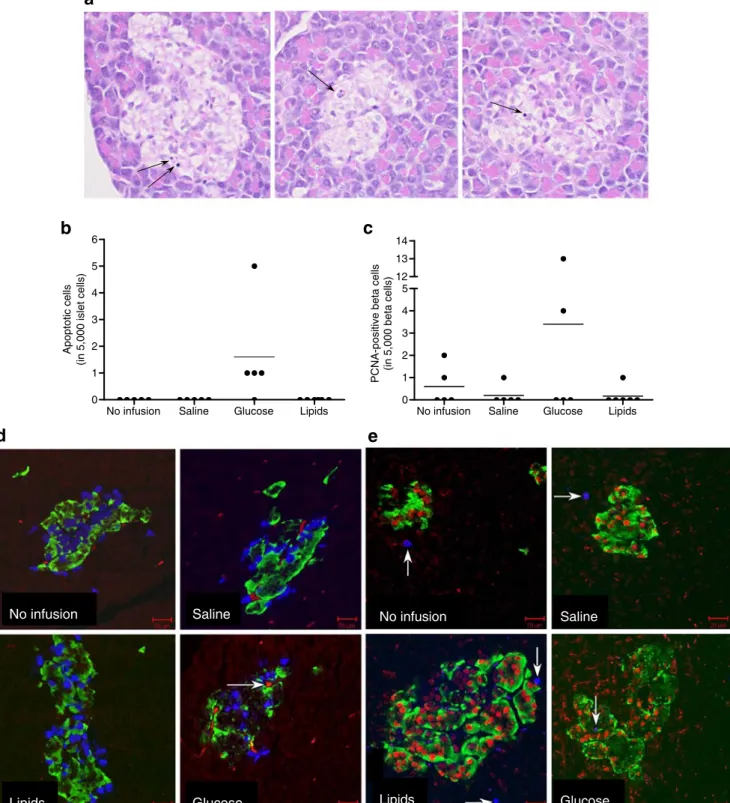
Apoptosis contributes to beta cell loss in glucose-infused cats We detected apoptotic islet cells in glucose-infused cats only. Based on morphological criteria, four of five glucose-infused cats had islet cells with typical pycnosis or karyor-rhexis (Fig. 5a,b). Islet cells with these apoptotic features were not found in the other groups. Using immunostaining for cleaved caspase-3, three of four glucose-infused cats with pycnosis or karyorrhexis had positive beta cells (Fig.5c).
The number of proliferating beta cells as assessed by insulin and Ki67 or PCNA immunostaining was not different between groups (Fig.5d,e).
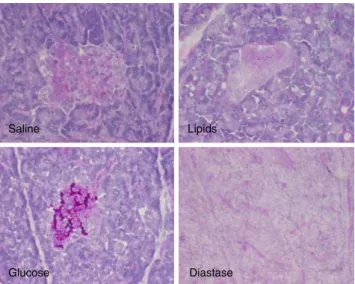
Glucose infusion induces beta cell accumulation of glyco-gen To investigate the nature of the clear cytoplasm identified in the islets of glucose-infused cats (Fig. 4c), staining for glycogen and lipids was performed. Predigestion of glycogen with diastase followed by PAS staining suggested that the islets of glucose-infused cats accumulated
No infusion Saline Glucose Lipids
100 µm 100 µm 100 µm 100 µm
50 µm . 50 µm
.
50 µm . 50 µm
No infusion Saline Glucose Lipids 0.0 0.5 1.0 1.5 2.0 2.5 3.0 3.5
Insulin positive area
No infusion Saline Glucose Lipids 0.0 0.5 1.0 1.5 2.0 2.5
Insulin content of the pancreas
a
b
c
d
Fig. 3 a Insulin immunostaining (pink) of feline pancreatic islets. Main image shows overview of a pancreatic section. Portions marked with square frame within main image designate regions shown at higher magnification (inserts). b The insulin-positive area was signi-ficantly smaller in glucose-infused cats than in cats infused with saline (p<0.05) or lipids (p<0.05). The insulin-positive area did not differ between the two control groups. Insulin-positive area was calculated as a percentage of the total pancreatic area and values are expressed relative to one cat without infusion; individual values and means are shown. c Pancreatic islet of a glucose-infused cat. In the beta cells of
glucose-infused cats, insulin immunostaining (pink) was mainly localised at the cell periphery. In the same cats, insulin immunostaining in beta cells lined by capillaries was often shifted towards the cytoplasmic membrane adjacent to endothelial cells (arrowheads). d Insulin content of the pancreas. In four glucose-infused cats the insulin content of pancreatic specimens was lower than in saline-infused cats. Insulin levels were normalised to the protein content measured with a spectrophotometer (wavelength: 280 nm) and values are expressed relative to one cat without infusion; individual values and means are shown
glycogen (Fig.6). Based on Oil Red O staining, triacylgly-cerols were not stored in islets of glucose-, lipid- or saline-infused cats.
Insulin mRNA expression is downregulated after a 10 day glucose infusion but not lipid infusion Average expression of insulin mRNA was approximately fourfold lower in isolated islets of glucose- than saline-infused cats (p<0.05) (Fig. 7). No difference was observed between lipid- and infused cats. Insulin mRNA was higher in saline-infused cats than in cats without infusion (p < 0.05). Comparable results were achieved when insulin transcripts were normalised with Gapdh or cyclophilin A (not shown). Quantities of mRNA for Fas and Flip were similar between groups (not shown).
Glucose and lipid infusion induce systemic inflammatory reaction After 10 days of infusion, circulating levels of α1-acid glycoprotein, but not serum amyloid A, were
significantly increased in glucose- and lipid-infused cats compared with saline-infused cats (p<0.05). Control groups did not differ (ESM Fig.2a).
Messenger RNA levels of cytokines and chemokines (Il6, Il1b, Tnfα, Il8, Mcp-1) assessed in isolated islets did not differ between groups (not shown).
Glucose- or lipid-infused cats had islet neutrophil num-bers similar to those of saline-infused cats (myeloperoxidase immunostaining) (ESM Fig. 2b,c). However, glucose-infused cats had significantly higher counts compared with lipid-infused cats (p<0.05). Furthermore, glucose-infused cats appeared to have more neutrophils in the exocrine
No infusion Saline Glucose Lipids 0.0 0.3 0.6 0.9 1.2 1.5 1.8
Number of beta cells
(per unit of pancreatic area)
No infusion Saline
Glucose Lipids
Saline Glucose Lipids
a
b
c
Fig. 4 a Number of beta cells relative to the pancreatic area. NKX6.1-positive cells were counted in pancreatic sections double stained with NKX6.1 and insulin. The number of beta cells was reduced by approxi-mately half in glucose-infused cats compared with saline-infused cats (p<0.05) or lipid-infused cats (p<0.05). b NKX6.1 (black) and insulin (brown) immunostaining of pancreatic islets in cats (×40). Few NKX6.1-positive nuclei are observed in the islet of the glucose-infused cat. In the same cat insulin staining is decreased. Values are expressed relative to one cat without infusion; indi-vidual values and means are shown. c H&E staining of pan-creatic islets in cats (×40). In the glucose-infused cat a large area on the left side of the islet appears devoid of nuclei and includes several vacuoles
No infusion Saline Glucose Lipids 0 1 2 3 4 5 6 Apoptotic cells
(in 5,000 islet cells)
b
a
No infusion Saline Lipids Glucosed
No infusion Saline Lipids Glucosee
No infusion Saline Glucose Lipids 0 1 2 3 4 5 12 13 14
PCNA-positive beta cells
(in 5,000 beta cells)
c
Fig. 5 a H&E staining of three pancreatic islets of glucose-infused cats (×40). Arrows show nuclei with morphological features of apoptosis. b Numbers of islet apoptotic cells. Glucose-infused cats had significantly more islet apoptotic cells than cats infused with saline (p<0.05) or lipids (p<0.05). Individual values and means are shown. c Numbers of proliferating beta cells. The number of proliferating cells was not different between groups. In two of the glucose-infused cats several proliferating beta cells were observed. Individual values and means are shown. d Triple immunostaining for
insulin (green), NKX6.1 (blue) and cleaved caspase-3 (red) of pancreatic islets in cats (×40). An apoptotic beta cell positive for cleaved caspase-3 is identified in the islet of a glucose-infused cat (arrow). e Triple immunostaining for insulin (green), NKX6.1 (red) and Ki67 (blue) of pancreatic islets in cats (×40). A proliferating beta cell is shown in the islet of a glucose-infused cat (arrow). Proliferating cells were also observed in the exocrine pancreas adjacent to the islet of the other cats (arrows)
pancreas, compared with the other groups (ESM Fig.2d). Neutrophils in islets or exocrine pancreas were not different between controls.
Macrophages were not counted in cat islets because of the lack of cross-reacting antibodies (ESM Table3).
Discussion
Using long-term hyperglycaemic and hyperlipidaemic clamps in cats, we developed an animal model suitable to study pathogenesis of beta cell dysfunction and loss induced by excess glucose or lipids in vivo. Plasma glucose and lipids were successfully targeted for 10 days at the levels of cats with untreated diabetes [27, 28].
Glucose-infused cats were non-ketotic. Based on physical examina-tion, food intake, body weight and electrolyte monitoring, hyperglycaemia and hyperlipidaemia were well tolerated. Cage rest and chronic intravenous infusion increased basal cortisol levels compared with cats without infusion, suggest-ing that the experimental set-up induced a slight stress response. However, cortisol was not different between groups infused with glucose, lipids or saline.
In contrast to previous models using rodents, in which glucose was infused for 2–4 days [9–14], we show that severe beta cell dysfunction is rapidly induced by sustained hyperglycaemia in cats. Plasma insulin markedly declined by day 2 of glucose infusion and was below baseline by day 10. After infusion, an acute glucose bolus did not stimulate insulin secretion. In addition, most hyperglycae-mic cats had lower pancreatic insulin contents than saline-infused cats. Pancreatic sections of hyperglycaemic cats had insulin-positive areas reduced by 80%, probably as the result of depletion of insulin stores. Furthermore, the decrease of insulin gene transcription observed in hyper-glycaemic cats showed that chronic overstimulation of beta cells with glucose caused reduced insulin synthesis. To support this notion, insulin was distributed as a thin rim at the beta cell periphery in those cats. Because proinsulin is concentrated in the Golgi apparatus of normal beta cells [32], the lack of perinuclear immunostaining may suggest that early steps in insulin synthesis were disturbed. Collectively these findings demonstrate that sustained hyperglycaemia strongly impairs beta cell function in cats, and that this is the result of beta cell exhaustion and decreased insulin gene expression.
This study supports the hypothesis that hyperglycaemia causes beta cell loss in vivo, as indicated by the 50% decrease in beta cell count per pancreatic area in glucose-infused cats. This was not compensated by increased beta cell prolifera-tion. Based on histomorphological features, hyperglycaemic cats had large parts of most islets devoid of nuclei. In most rodent studies, glucose infusion for 2–4 days either increased or had no effect on beta cell mass [12,14–17]. None of these in vivo experiments demonstrated a demise of beta cells after infusion. As to the reason for the reduced number of beta cells in hyperglycaemic cats, we found that apoptotic islet cells and beta cells positive for cleaved caspase-3 were only present in glucose-infused cats. Apoptosis may thus contribute to the reduced number of beta cells in hyper-glycaemic cats. This is consistent with in vitro studies showing that high glucose increases the rate of beta cell apoptosis in human islets or in islets of Psammomys obesus [4,5,33].
In the islets isolated from hyperglycaemic cats we found no increase in IL-1β or the Fas receptor. Hence, in contrast to human islets exposed to high glucose [4,5], apoptosis of beta cells in hyperglycaemic cats may have occurred
No infusion Saline Glucose Lipids
0 2 4 6 8 10 12 14 Insulin mRNA (normalised to Gadph )
Fig. 7 Relative quantities of insulin mRNA in isolated islets. Insulin transcripts were fourfold lower in glucose-infused cats than in saline-infused cats (p<0.05). Cats that did not receive infusion had lower insulin expression levels than saline-infused cats (p<0.05). Values are expressed relative to one cat without infusion; individual values and means are shown
Saline Lipids
Glucose Diastase
Fig. 6 Feline pancreatic sections stained with PAS (×40). A consecutive section of the glucose-infused cat was predigested with diastase (×40). Islet loss of PAS positivity after diastase digestion indicated that glycogen was accumulated in the islets of glucose-infused cats
through mechanisms that do not involve local inflammatory reactions or Fas receptor upregulation. Of note, substantial amounts of glycogen had accumulated in the islets of hyper-glycaemic cats. Deposits of glycogen have been described in the islets of diabetic humans and animals [34–36] and have been proposed to account, at least partly, for the beta cell secretory defects induced by excess glucose [37]. Whether glycogen accumulation also contributes to beta cell loss has not been studied. Recently, it was shown that beta cell overexpression of the glycogen synthase kinase-3 gene is associated with beta cell dysfunction and loss in rats [38]. Interestingly, this enzyme is both linked to glycogen syn-thesis and to proliferation/apoptosis. The link between glycogen metabolism and cell survival makes this gene a possible candidate to explain beta cell apoptosis.
Feline beta cells are very susceptible to the effects of marked hyperglycaemia. It is however worth noting that part of the observed toxic changes may have been induced by the fast increase of glucose levels in the islet milieu rather than by the sustained hyperglycaemia. To better mimic the natural history of feline diabetes a gradual ramp-up of glucose levels would require infusion over several weeks. Such a gradual increase of hyperglycaemia was not performed because of the risk of septicaemia and for animal welfare reasons. Clamps could also have been performed at lower blood glucose levels to provide information upon the mechanisms involved in earlier phases of beta cell failure. However, our study shows the principal mechanisms of hyperglycaemia-induced beta cell damage at levels of hyperglycaemia seen in untreated diabetes.
In contrast to the detrimental effects of hyperglycaemia, hyperlipidaemia leading to increased plasma levels of NEFA did not affect basal insulin or glucose-induced insulin secretion in the IVGTT. Insulin gene transcription appeared to be unaffected by lipid infusion. Conflicting results have been described with regard to the effects of excess NEFA on insulin secretion in vivo. Studies in rats and humans reported increased, decreased or unchanged beta cell function [18, 19, 39, 40]. Such differences may partly be attributable to the different infusion protocols. Here, to mimic the in vivo milieu of diabetic cats we targeted triacylglycerols at the concentration found in feline diabetes [27,28]. This led to a 1.7-fold increase of plasma NEFA, hence similar to the twofold increase of NEFA concentrations in untreated diabetic vs healthy cats (E. Zini and C.E. Reusch, unpublished observation).
Hyperlipidaemia and excess NEFA levels in cats had no effect on beta cell number and beta cell apoptosis or proliferation. In cultured human and rat islets, exposure of beta cells to palmitate appears toxic, whereas oleate protects from both palmitic- and glucose-induced beta cell apopo-tosis [7, 8]. Because the emulsion used here contained approximately threefold higher amounts of oleate than
palmitate, it is possible that the protective effect of oleate outweighed the negative effect of palmitate. Accumulation of lipids and, possibly, of toxic lipid by-products was not observed in beta cells. Thus, the present work reveals that feline beta cells in vivo are resistant to 10 days of hyper-lipidaemia and excess NEFA.
It is important to note that the degree of hyperlipidaemia, particularly of NEFA, was proportionally lower than the degree of hyperglycaemia, making direct comparison of the two infusion regimens difficult. In addition, NEFA levels varied widely in some cats. Therefore, it is possible that substantial beta cell damage would have occurred in cats if lipids had been clamped at higher concentrations and NEFA levels had been constantly increased. Future studies will have to show whether concurrent infusion of glucose and lipids have a combined effect on the beta cells in vivo because the concept of beta cell lipotoxicity is often considered relevant only when coupled with glucotoxicity [1].
We found that both hyperglycaemia and hyperlipidaemia induced systemic inflammation in cats, as shown by an increased plasma concentration ofα1-acid glycoprotein, the
most important feline acute-phase protein [41]. Hence, systemic inflammation may develop in diabetic cats similar to what has been described in human type 2 diabetes [42]. In contrast to type 2 diabetes in humans [43], we did not observe an inflammatory reaction in islets of hyperglycae-mic or hyperlipidaehyperglycae-mic cats, as assessed by islet transcripts of cytokines or chemokines and by the number of islet neutrophils. The reason for a higher neutrophil number in the islets and exocrine pancreas of glucose-infused cats compared with lipid-infused cats remains unclear.
In conclusion, clamping plasma glucose and lipid levels is feasible in cats, and the in vivo model is appropriate to study pathogenesis of beta cell dysfunction and beta cell demise that may occur in poorly controlled diabetes. Ten days of hyperglycaemia severely impaired beta cell secretory capac-ity and caused marked beta cell loss in cats, possibly via apoptosis. Hyperlipidaemia, despite increasing NEFA levels, did not induce beta cell dysfunction and loss in cats.
Acknowledgements This study was supported by a grant from the
Clinical Studies Fund 2006 of the European College of Veterinary Internal Medicine-Companion Animals (ECVIM-CA). M. Osto is supported by the Forschungskredit of the University of Zürich, 2007, awarded to E. Zini. Part of the present study was presented at the meeting of the Biochemical Society (Molecular Mechanisms of Glucolipotoxicity in Diabetes), University College Dublin, Ireland,
25–26 March 2008. We are grateful to N. Sieber-Ruckstuhl, K. Morag
and N. Müller (Clinic for Small Animal Internal Medicine, University of Zürich, Switzerland) for taking care of the cats during infusion. We thank K. Kaufmann (Clinic for Small Animal Internal Medicine, Vetsuisse Faculty, University of Zürich, Switzerland), S. Wunderlin (Institute of Veterinary Pathology, Vetsuisse Faculty, University of Zürich, Switzerland) and S. Behnke (Department of Pathology, University Hospital Zürich, Switzerland) for excellent technical assistance.
Duality of interest The authors declare that there is no duality of interest associated with this manuscript.
References
1. Robertson RP, Harmon J, Tran PO, Poitout V (2004) Beta-cell glucose toxicity, lipotoxicity, and chronic oxidative stress in type 2 diabetes. Diabetes 53(Suppl 1):S119–S124
2. Weir GC, Laybutt DR, Kaneto H, Bonner-Weir S, Sharma A (2001) Beta-cell adaptation and decompensation during the progression of
diabetes. Diabetes 50(Suppl 1):S154–S159
3. Unger RH, Zhou YT (2001) Lipotoxicity of beta-cells in obesity and in
other causes of fatty acid spillover. Diabetes 50(Suppl 1):S118–S121
4. Maedler K, Spinas GA, Lehmann R et al (2001) Glucose induces beta-cell apoptosis via upregulation of the Fas receptor in human
islets. Diabetes 50:1683–1690
5. Maedler K, Sergeev P, Ris F et al (2002) Glucose-induced beta cell production of IL-1beta contributes to glucotoxicity in human
pancreatic islets. J Clin Invest 110:8551–8560
6. Butler AE, Galasso R, Meier JJ, Basu R, Rizza RA, Butler PC (2007) Modestly increased beta cell apoptosis but no increased beta cell replication in recent-onset type 1 diabetic patients who died of diabetic ketoacidosis. Diabetologia 50:2323–2331 7. Maedler K, Oberholzer J, Bucher P, Spinas GA, Donath MY
(2003) Monounsaturated fatty acids prevent the deleterious effects of palmitate and high glucose on human pancreatic beta-cell
turnover and function. Diabetes 52:726–733
8. Maedler K, Spinas GA, Dyntar D, Moritz W, Kaiser N, Donath MY (2001) Distinct effects of saturated and monounsaturated fatty
acids on beta-cell turnover and function. Diabetes 50:69–76
9. Jetton TL, Everill B, Lausier J et al (2008) Enhanced beta cell mass without increased proliferation following chronic mild glucose
infusion. Am J Physiol Endocrinol Metab 294:E679–E687
10. Laury MC, Takao F, Bailbe D et al (1991) Differential effects of prolonged hyperglycemia on in vivo and in vitro insulin secretion
in rats. Endocrinology 128:2526–2533
11. Leahy JL, Cooper HE, Deal DA, Weir GC (1986) Chronic hyperglycaemia is associated with impaired glucose influence on insulin secretion. A study in normal rats using chronic in vivo glucose infusions. J Clin Invest 77:908–915
12. Steil GM, Trivedi N, Jonas JC et al (2001) Adaptation of beta-cell mass to substrate oversupply: enhanced function with normal gene expression. Am J Physiol Endocrinol Metab 280:E788–E796 13. Thibault C, Guettet C, Laury MC et al (1993) In vivo and in vitro
increased pancreatic beta-cell sensitivity to glucose in normal rats
submitted to a 48-h hyperglycaemic period. Diabetologia 36:589–595
14. Alonso LC, Yokoe T, Zhang P et al (2007) Glucose infusion in mice:
a new model to induce beta-cell replication. Diabetes 56:1792–1801
15. Bonner-Weir S, Deery D, Leahy JL, Weir GC (1989) Compensa-tory growth of pancreatic beta-cells in adult rats after short-term
glucose infusion. Diabetes 38:49–53
16. Paris M, Bernard-Kargar C, Berthault MF, Bouwens L, Ktorza A (2003) Specific and combined effects of insulin and glucose on functional pancreatic beta-cell mass in vivo in adult rats.
Endocrinology 144:2717–2727
17. Topp BG, McArthur MD, Finegood DT (2004) Metabolic adapta-tions to chronic glucose infusion in rats. Diabetologia 47:1602–1610 18. Magnan C, Collins S, Berthault MF et al (1999) Lipid infusion lowers sympathetic nervous activity and leads to increased beta-cell responsiveness to glucose. J Clin Invest 103:413–419 19. Goh TT, Mason TM, Gupta N et al (2007) Lipid-induced beta-cell
dysfunction in vivo in models of progressive beta-cell failure. Am
J Physiol Endocrinol Metab 292:E549–E560
20. Lutz TA, Rand JS (1995) Pathogenesis of feline diabetes mellitus.
Vet Clin North Am Small Anim Pract 25:527–552
21. Cefalu WT (2006) Animal models of type 2 diabetes: clinical presentation and pathophysiological relevance to the human
condition. ILAR J 47:186–198
22. Henson MS, O'Brien TD (2006) Feline models of type 2 diabetes mellitus. ILAR J 47:234–242
23. Lutz TA, Rand JS (1997) Detection of amyloid deposition in various regions of the feline pancreas by different staining techniques. J Comp Pathol 116:157–170
24. Appleton DJ, Rand JS, Sunvold GD (2001) Insulin sensitivity decreases with obesity, and lean cats with low insulin sensitivity are at greatest risk of glucose intolerance with weight gain. J
Feline Med Surg 3:211–228
25. Butler AE, Janson J, Bonner-Weir S, Ritzel R, Rizza RA, Butler PC (2003) Beta-cell deficit and increased beta-cell apoptosis in
humans with type 2 diabetes. Diabetes 52:102–110
26. Rand JS, Fleeman LM, Farrow HA, Appleton DJ, Lederer R (2004) Canine and feline diabetes mellitus: nature or nurture? J
Nutr 134(8 Suppl):S2072–S2080
27. Crenshaw KL, Peterson ME (1996) Pretreatment clinical and laboratory evaluation of cats with diabetes mellitus: 104 cases
(1992–1994). J Am Vet Med Assoc 209:943–949
28. Reusch CE, Haberer B (2001) Evaluation of fructosamine in dogs and cats with hypo- or hyperproteinaemia, azotaemia, hyper-lipidaemia and hyperbilirubinaemia. Vet Rec 148:370–376 29. Lien YH, Huang HP, Chang PH (2006) Iatrogenic
hyperadreno-corticism in 12 cats. J Am Anim Hosp Assoc 42:414–423 30. Wareham NJ, Phillips DI, Byrne CD, Hales CN (1995) The 30
minute insulin incremental response in an oral glucose tolerance test as a measure of insulin secretion. Diabet Med 12:931 31. Kipar A, Leutenegger CM, Hetzel U et al (2001) Cytokine mRNA
levels in isolated feline monocytes. Vet Immunol Immunopathol
78:305–315
32. Orci L, Ravazzola M, Perrelet A (1984) (Pro)insulin associates with Golgi membranes of pancreatic B cells. Proc Natl Acad Sci
U S A 81:6743–6746
33. Donath MY, Gross DJ, Cerasi E, Kaiser N (1999) Hyperglycemia-induced beta-cell apoptosis in pancreatic islets of Psammomys
obesus during development of diabetes. Diabetes 48:738–744
34. Toreson WE (1951) Glycogen infiltration (so-called hydropic degeneration) in the pancreas in human and experimental diabetes mellitus. Am J Pathol 27:327–347
35. Campbell J, Pierluissi J, Kovacs K (1981) Pancreatic islet ultrastruc-ture, serum and pancreatic immunoreactive insulin in somatotrophic and metasomatotrophic diabetes in dogs. J Submicrosc Cytol
13:599–608
36. Dohan FC, Lukens FDW (1948) Experimental diabetes produced
by the administration of glucose. Endocrinology 42:244–262
37. Malaisse WJ, Marynissen G, Sener A (1982) Possible role of glycogen
accumulation in B cell glucotoxicity. Metabolism 41:814–819
38. Liu Z, Tanabe K, Bernal-Mizrachi E, Permutt MA (2008) Mice with beta cell overexpression of glycogen synthase kinase-3beta have
reduced beta cell mass and proliferation. Diabetologia 51:623–631
39. Paolisso G, Gambardella A, Amato L et al (1995) Opposite effects of short- and long-term fatty acid infusion on insulin secretion in
healthy subjects. Diabetologia 38:1295–1299
40. Stefan N, Wahl HG, Fritsche A, Häring H, Stumvoll M (2001) Effect of the pattern of elevated free fatty acids on insulin sensitivity and insulin secretion in healthy humans. Horm Metab Res 33:432–438 41. Ceron JJ, Eckersall PD, Martýnez-Subiela S (2005) Acute phase
proteins in dogs and cats: current knowledge and future perspectives. Vet Clin Pathol 34:85–99
42. Wellen KE, Hotamisligil GS (2005) Inflammation, stress, and
diabetes. J Clin Invest 115:1111–1119
43. Ehses JA, Perren A, Eppler E et al (2007) Increased number of islet-associated macrophages in type 2 diabetes. Diabetes