HAL Id: hal-01946510
https://hal.archives-ouvertes.fr/hal-01946510
Submitted on 27 Nov 2020
HAL is a multi-disciplinary open access
archive for the deposit and dissemination of
sci-entific research documents, whether they are
pub-lished or not. The documents may come from
teaching and research institutions in France or
abroad, or from public or private research centers.
L’archive ouverte pluridisciplinaire HAL, est
destinée au dépôt et à la diffusion de documents
scientifiques de niveau recherche, publiés ou non,
émanant des établissements d’enseignement et de
recherche français ou étrangers, des laboratoires
publics ou privés.
Testing for selection on the androgen-binding protein in
the Danish mouse hybrid zone
Barbara Dod, Carole Smadja, Robert Karn, Pierre Boursot
To cite this version:
Barbara Dod, Carole Smadja, Robert Karn, Pierre Boursot. Testing for selection on the
androgen-binding protein in the Danish mouse hybrid zone. Biological Journal of the Linnean Society, Linnean
Society of London, 2005, 84 (3), pp.447-459. �hal-01946510�
Biological Journal of the Linnean Society, 2005, 84, 447–459. With 3 figures
Blackwell Science, LtdOxford, UKBIJBiological Journal of the Linnean Society0024-4066The Linnean Society of London, 2005? 2005 843
447459 Original Article
SELECTION IN MOUSE HYBRID ZONE B. DOD
ET AL.
*Corresponding author. E-mail: [email protected]
The genus Mus as a model for evolutionary studies
Edited by J. Britton-Davidian and J. B. Searle
Testing for selection on the androgen-binding protein in
the Danish mouse hybrid zone
BARBARA DOD
1*, CAROLE SMADJA
2, ROBERT C. KARN
3and PIERRE BOURSOT
1 1Laboratoire Génome Populations Interactions Adaptation, Université Montpellier II, F34095 Montpellier,
France
2
Laboratoire Génétique et Environnement, ISEM,Université Montpellier II, F34095 Montpellier, France
3
Department of Biological Sciences, Butler University, Indianapolis, IN 46208, USA
Received 3 November 2003; accepted for publication 7 October 2004The three peripheral subspecies of the house mouse Mus musculus have fixed specific variants of the
androgen-bind-ing protein (ABP) that have been proposed to be part of a recognition mechanism that could participate in sexual
iso-lation between the subspecies. We tested for selection on Abpa by characterizing the pattern of Abpa introgression
across a transect of the hybrid zone between M. m. musculus and M. m. domesticus in Jutland. On the musculus side,
the cline for Abpa resembled that of a nearly neutral allozyme more than that of strongly selected X and Y
chro-mosome markers. However, the high central step which displaces the tail of introgression of Abpa to higher
fre-quencies was best accounted for by linkage to a locus under strong selection against hybrids. Still, we cannot exclude
that this pattern results from weak selection against Abpa in the tail of introgression, which would be compatible
with an assortative choice mechanism. On the domesticus side there was little introgression close to the hybrid zone,
presumably due to a geographical barrier to migration. However, substantial frequencies of musculus alleles
occurred further away, suggesting mixed colonization patterns as well as flow across the hybrid zone. © 2005 The
Linnean Society of London, Biological Journal of the Linnean Society, 2005, 84, 447–459.
ADDITIONAL KEYWORDS:
assortative mating – gene flow – genetic barrier – Mus musculus domesticus –Mus musculus musculus.
INTRODUCTION
Androgen-binding protein (ABP) is a member of the secretoglobin family (Laukaitis & Karn, 2005, this issue) and a major component of saliva that mice transfer to their pelts and territories when grooming. The role this protein plays is unknown, but, as it is able to bind male sex steroid hormones and because distinct structural variants have been fixed alterna-tively in the peripheral subspecies of the house mouse
Mus musculus, it has been proposed to be part of a
mate recognition mechanism (Karn & Dlouhy, 1991). This idea was reinforced considerably by the results of
behavioural studies (Laukaitis, Crister & Karn, 1997) and odour preference tests (Talley, Laukaitis & Karn, 2001), which showed that female mice belonging to inbred and outbred strains of mice derived from
M. m. musculus and M. m. domesticus made
assorta-tive mate choices based on their ABP genotypes. The rapid evolution of the gene coding for the alpha
subunit of this dimeric protein (Abpa) is also
consis-tent with a role in mediating assortative mating. The alleles found in the peripheral subspecies show a large excess of non-synonymous differences and a lack of
both exon and intron polymorphism (Hwang et al.,
1997; Karn & Nachman, 1999; Karn et al., 2002). This
pattern of evolution suggests that the new ABP vari-ants were fixed in a series of selective sweeps.
How-448
B. DOD ET AL.ever, the situation prevailing in the central parts of the species range does not support this idea (Karn
et al., 2002). Not only is there extensive intron and
exon polymorphism, but there is also evidence for
sec-ondary admixture of subspecies-specific Abpa variants
in the regions of transition between the peripheral subspecies and the central populations. Furthermore, these authors also found phylogenetic evidence that
interspecific exchanges between M. musculus and
the three other Palaearctic species, M. spretus,
M. spicilegus and M. macedonicus, may have occurred
in the past.
Our aim was to investigate the role that selection
plays in shaping the introgression of Abpa in the
hybrid zone that results from the secondary contact
between M. m. domesticus and M. m. musculus in
Europe (for review see Boursot et al., 1993). Early
studies on three different transects of this zone in Denmark, Germany and Bulgaria showed them all to be characterized by narrow genetic transitions of sim-ilar widths (Hunt & Selander, 1973; Sage, Whitney &
Wilson, 1986; Vanlerberghe et al., 1988a;
Vanler-berghe et al., 1988b; Prager et al., 1993). In the Danish
and Bavarian transects, the clines of both sex chromo-some markers are much narrower compared with
those of the autosomal allozymes (Tucker et al., 1992;
Dod et al., 1993), which suggests that genes on both
sex chromosomes are more strongly affected by hybrid dysgenesis than are the autosomal loci. The limited introgression of the Y chromosome in Bulgaria
(Van-lerberghe et al., 1986) and East Holstein (Prager,
Boursot & Sage, 1997) also supports this idea. How-ever, a preliminary study across a transect in Western
Bohemia (Munclinger et al., 2002) suggests that the
situation is more complex than originally supposed, as here the centres of the clines for the two sex chromo-somes are not concordant and the Y transition appears
to occur over a wide area. Raufaste et al. (2005, this
issue) showed that eight allozymes on six different autosomal chromosomes could be characterized by a series of concordant clines with central steps in fre-quency flanked by smooth tails of introgression. This is consistent with the idea that this hybrid zone is a tension zone maintained by the balance between migration and selection against hybrids (Barton & Hewitt, 1985). The shapes of the allozyme clines sug-gest that the loci themselves are only weakly selected against but are submitted to an overall barrier to gene flow created by selection against other loci in hybrid genomes.
To test for selection on Abpa we compared its
intro-gression pattern across the Danish transect of the hybrid zone in Jutland with those of an X and a Y chro-mosome marker that are both strongly affected by selection against hybrids, as well as with those of the weakly selected allozymes mentioned above.
METHODS
MICEMice were live-trapped inside buildings using multi-capture traps along a transect of the hybrid zone in Jutland, during seven field trips between 1984 and 2000. The localities sampled are shown in Figure 1. A number of localities were sampled more than once and were treated as independent samples. The list of sam-ples with their geographical position in universal transverse mercator (UTM) grid coordinates is given in the Appendix.
GENETICANALYSIS
DNA from spleen or tail tissue was extracted using standard phenol/chloroform procedures. An
allele-spe-cific PCR reaction was used to type the Abpa variants.
The two forward primers included the fixed non-synonymous differences in the exon sequences of
Abpaa (M. m. domesticus) and Abpab (M. m. musculus)
while the reverse primers fell in the following intronic
sequence and were not subspecies specific (Karn et al.,
2002). Two PCR reactions were performed in 10-mL
Figure 1. Map showing the geographical position of the
Mus musculus musculus samples on the transect and the centre of the hybrid zone. Latitude and longitude are given as universal transverse mercator (UTM) grid coordinates (in km). The estimated centre of the transect is shown as a thick grey line. The position of the transect is indicated on the map of the Jutland peninsula in the insert. The filled triangles on the southernmost part of the map cor-respond to the localities with the least overall introgres-sion referred to in the text. Those that are introgressed for Abpa are encircled.
N 6120 6140 6160 6180 6200 6220 475 495 515 535 555 575
SELECTION IN MOUSE HYBRID ZONE
449
aliquots in the presence of 25 ng DNA and 0.125 U Taq
polymerase with 2- and 2.5-mM MgCl2 for the Abpaa
and Abpab primer pairs, respectively. After an initial
incubation at 95 ∞C for 3 min the reactions were
amplified for 35 cycles. The annealing and elongation conditions are given with the primer sequences in Table 1. The two amplification products were analysed on the same 1.5% agarose gels. The shorter one
(Abpaa, 192 bp) was loaded first and run for 15 min
before the longer one (Abpab, 290 bp) was loaded.
The Zfy2 deletion in the M. m. musculus Y
chromo-some (Boissinot & Boursot, 1997) and a SINE (B1)
insertion in the Btk gene in the M. m. domesticus X
chromosome (Munclinger, Boursot & Dod, 2003) were used to differentiate between the two subspecies.
The eight allozyme loci used to calculate the average
autosomal locus referred to in this study were: Amy1,
chromosome (chr.) 3; Es1, Es2, chr. 8; Es10, chr. 14;
Gpd, chr. 4; Mpi, chr. 9; Np, chr. 14 and Pgm, chr. 5.
None of these markers are on the same chromosome as
Abpa, which is 10 cM from the centromere of
chromo-some 7.
CLINEANALYSIS
The variations of allele frequencies were studied along the direction of the maximum frequency gradient, which was determined using the eight allozyme loci,
as described in detail in Raufaste et al. (2005, this
issue). The shapes of the clines describing the change in allele frequencies of the different loci along a one-dimensional representation of the transect were determined by comparing the maximum likelihood estimations of three single-locus cline models of increasing complexity using the computer package ANALYSE (by N. Barton and S. Baird, http:// helios.bto.ed.ac.uk/evolgen/Mac/Analyse/). The sim-plest was a symmetrical sigmoidal model in which only the geographical position of the centre and width were varied. The next was a symmetrical cline model with a central step and two symmetrical tails of intro-gression, described by two additional parameters. The most complex model was asymmetrical with two fur-ther parameters that allowed for different tails of introgression on either side. Likelihood ratio tests
were then used to choose the best acceptable model with a minimum number of parameters. The parame-ters describing the most complex model were the
posi-tion of the cline centre, cline width (w), which is the
inverse of the maximum frequency gradient in the
central step, B0/w and B1/w, the ratios of the barrier
to gene flow to the width of the clines on the left and
right hand sides of the centre, respectively, and q0 and
q1, which correspond to the square of the rate of decay
of allele frequencies in the tails of introgression. B
rep-resents the barrier to gene flow and is the distance of habitat that would have to be crossed by a neutral allele in order to observe a change of frequency
equiv-alent to that caused by the central step. The value of q
can be used to estimate the ratio of the selection on the locus itself to the overall selection (Barton & Hewitt, 1985; Barton & Gale, 1993). A detailed description of the procedures used to find the direction of maximum gradient, to correct sample sizes for inbreeding and random fluctuations, and to fit the cline shapes is
given in Raufaste et al. (2005, this issue). For the
haplo/diploid X chromosome locus the males and females were first analysed separately and, as no sig-nificant difference between the sexes was found, they were then grouped.
RESULTS
The musculus allele frequencies of the Abpa, Zfy (on
the Y chromosome) and Btk (on the X chromosome) loci
were measured in a large number of samples along a
transect of the hybrid zone between M. m. musculus
and M. m. domesticus in Jutland. The musculus allele
frequencies of the three loci in the different samples are given in the Appendix together with the effective sample size, the name of the locality, the sampling year, its geographical position and the derived coordi-nate that defined its position on the one-dimensional cline representation. The average musculus allele fre-quency of the eight allozymes taken from Raufaste et
al. (2005, this issue) are also included.
The variations of the musculus allele frequencies of
Abpa, Zfy, Btk and the average frequency of eight
autosomal loci across the one-dimensional transect are shown in Figure 2. The Y chromosome behaved
Table 1. Primer sequences and the annealing and elongation conditions used to amplify the Abpa fragments specific to
Mus musculus domesticus (Abpaa) and M. m. musculus (Abpab)
Primer
pair Forward Reverse
Annealing Elongation
∞C s ∞C s
Abpaa GAAACAATTCAATGAAAACACTAAAG TGTGCCACTGCTCTGTATTC 55 30 72 30
450
B. DOD ET AL.very differently compared with the other three loci. The transition from the domesticus to the musculus variant was almost complete within a few km from the centre of the hybrid zone. The Y chromosome is there-fore clearly under very strong selection in the hybrid genome.
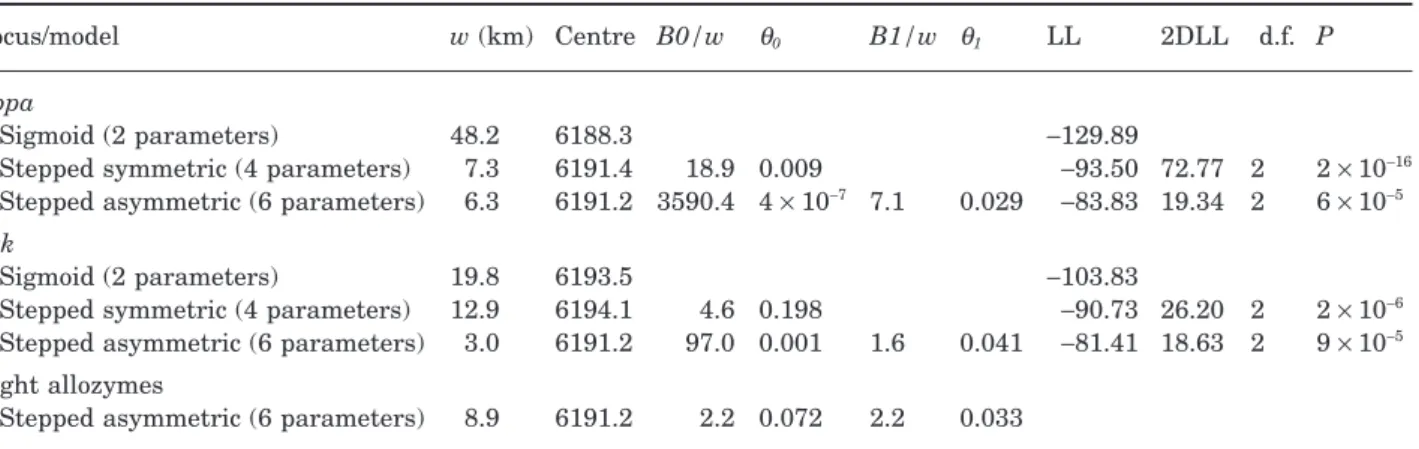
The shapes of the clines for the Abpa and Btk loci were fitted to the three classes of models and it can be seen in Table 2 that in both cases the likelihood ratio test showed that the most complex model, correspond-ing to a stepped cline with asymmetrical tails of intro-gression, was significantly better. The maximum likelihood positions of the centre of both these loci coincided with that determined for the eight allozymes by Raufaste et al. (2005, this issue). Although the cline models used for these two loci were not applicable to the very abrupt Y transition it is obvious that it occurred in much the same place as the other loci. The shapes of the fitted clines are shown in Figure 2.
On the domesticus side of the transect, the intro-gression of Btk was limited to a small number of local-ities (7 of 52) spread over a wide geographical area. On the other side of the zone, an extremely variable range of musculus allele frequencies (from 0.2 to 1) was found in the first 16 km, but then they increased rap-idly so that all the populations further than 20 km from the centre were fixed. This was modelled by a steep frequency step of almost 0–0.5 on the domesticus side followed by a rapid exponential decay on the
mus-culus side. In fact, most of the admixture occurred on
the musculus side of the inferred centre. Although this atypical cline shape made the estimated selection parameters unreliable, the Btk locus clearly showed much less introgression compared with the average autosomal locus, and is obviously under much stron-ger selection.
The frequency changes of the Abpa alleles did not follow the same pattern as those of Btk. Although there was also a sharp step on the domesticus side, it only continued for about 2 km beyond the centre. This means that, although most of the intermixing also occurred on the musculus side, it spanned a much nar-rower spectrum of frequencies (mostly above 0.6) than did Btk. Furthermore, this zone of admixture stretched out as far as 58 km from the centre. As a result the fitted cline had a high central frequency step with a rather steep gradient that was flanked by a right hand tail which decayed slowly but was clearly displaced to higher musculus frequencies compared with the average allozyme cline. The parameters defining the best cline fits for these two loci (Table 2) suggest that there is a stronger barrier to the intro-gression of Abpa (B1 = 50 km) than there is for the average autosomal locus (B1 = 20 km), even though
both had similar rates of decay (q1 = 0.029 and 0.033,
respectively). Table 3 compares the cline parameters
Figure 2. Variations of Mus musculus musculus allele
fre-quencies along the one-dimensional transect across the hybrid zone. The grey spots correspond to the real data and their area is proportional to the effective sample size. The black spots give the best cline fit and the position of the centre of the transect is represented by the vertical dotted line. Y chromosome –0.2 0 0.2 0.4 0.6 0.8 1 1.2 Eight allozymes –0.2 0 0.2 0.4 0.6 0.8 1 1.2 Abpa –0.2 0 0.2 0.4 0.6 0.8 1 1.2 Btk –0.2 0 0.2 0.4 0.6 0.8 1 1.2 Coordinate on transect Frequency of musculus alleles 6140 6160 6260 6240 6220 6200 6180 6140 6160 6180 6200 6220 6240 6260 6140 6160 6180 6200 6220 6240 6260 6140 6160 6180 6200 6220 6240 6260
SELECTION IN MOUSE HYBRID ZONE
451
obtained for the eight allozyme loci individually (taken from Raufaste et al., 2005, this issue), the aver-age allozyme locus and Abpa on the musculus side of the transect. Although there were variations across loci, the width of the Abpa cline was comparable to those of most of the allozyme loci, but its barrier tended to be higher. The only locus with a higher bar-rier was Amy which had a much wider atypical cline.
The rate of decay q1 for Abpa fell within the range of
values found for the other loci. However, one should note that the two log-likelihood limits of these param-eter estimates were quite wide, and most intervals overlapped across loci.
The situation for Abpa on the domesticus side was a bit more confusing. Although musculus alleles appeared to decay rapidly immediately south of the centre, they occurred again, sometimes at rather high frequencies, in a large number of populations further south. As a result, the best fit was a flat tail of intro-gression that provided a very poor description of the data. Btk also showed a rather flat decay on the
domesticus side and showed occasional sporadic
intro-gression, like several of the allozymes studied by Rau-faste et al. (2005, this issue). As a consequence, the cline parameters fitted on the domesticus side did not appear to be very meaningful, and the model applied did not provide a satisfactory representation of the data. The possible reasons for this are discussed in more detail in Raufaste et al. (2005, this issue). We therefore did not attempt to compare the left hand introgression tail parameters across loci but rather examined the levels of sporadic introgression that occurred at several of the loci. The distribution of the
musculus allele frequencies of Abpa in the samples
from the localities south of the Kolding Fjord more than 20 km from the transect centre (the first 19 sam-ples in the Appendix), differed significantly from that of the average autosomal locus (Wilcoxon matched pairs test, P < 0.047). To investigate the reasons for this difference we compared the frequency distribu-tion of Abpa musculus alleles with those of Amy1, Es1,
Es10, Mpi, Np and Pgm. Data were missing for Es2
Table 3. Comparison of the parameters of the clines on the musculus side of the hybrid zone, for eight allozymes and Abpa
Locus w (km) (2LL limits) B1 (2LL limits) q1 (2LL limits)
Amy1 20.6 (15.2–26.4) 199.0 (64.4–2148.0) 0.037 (0.001–0.157) Es1 11.0 (2.2–25.2) 7.2 (0.6–25.6) 0.172 (0.010–0.999) Es10 6.4 (4.9–11.7) 25.3 (13.9–58.9) 0.016 (0.008–0.055) Es2 3.8 (1.3–9.2) 24.2 (10.1–53.6) 0.003 (0.000–0.019) Gpd 6.3 (3.4–13.0) 6.9 (4.2–16.8) 0.032 (0.009–0.135) Mpi 6.2 (2.2–18.9) 18.7 (4.6–52.4) 0.041 (0.004–0.453) Np 5.9 (3.8–44.6) 14.0 (5.9–137.3) 0.009 (0.002–0.715) Pgm 6.8 (4.0–9.1) 16.3 (12.7–30.2) 0.035 (0.010–0.061) Eight loci 8.9 (7.7–12.4) 19.9 (13.7–28.1) 0.033 (0.023–0.063) Abpa 6.3 (3.7–10.2) 44.5 (16.0–103.7) 0.029 (0.009–0.104)
2LL limits, two log-likelihood support limits.
Table 2. Test of different cline models for the Abpa and Btk loci, and comparison with the best fit for the eight allozyme loci
Locus/model w (km) Centre B0/w q0 B1/w q1 LL 2DLL d.f. P
Abpa
Sigmoid (2 parameters) 48.2 6188.3 -129.89
Stepped symmetric (4 parameters) 7.3 6191.4 18.9 0.009 -93.50 72.77 2 2 ¥ 10-16
Stepped asymmetric (6 parameters) 6.3 6191.2 3590.4 4 ¥ 10-7 7.1 0.029 -83.83 19.34 2 6 ¥ 10-5
Btk
Sigmoid (2 parameters) 19.8 6193.5 -103.83
Stepped symmetric (4 parameters) 12.9 6194.1 4.6 0.198 -90.73 26.20 2 2 ¥ 10-6
Stepped asymmetric (6 parameters) 3.0 6191.2 97.0 0.001 1.6 0.041 -81.41 18.63 2 9 ¥ 10-5
Eight allozymes
Stepped asymmetric (6 parameters) 8.9 6191.2 2.2 0.072 2.2 0.033 LL, log-likelihood; 2 DLL, twice the difference between the LLs of two models.
452
B. DOD ET AL.and Gpd in six and nine of these samples, respectively, so they could not be included in the tests. A Friedman two-way analysis of variance of the musculus allele frequencies of the six allozyme markers in 16 samples (samples 187, 189 and 92 were not considered because of missing data) showed that only three of them were introgressed for musculus alleles to a significantly dif-ferent extent (with all 16 localities as variables,
P < 0.00015, and when the samples with the three
highest ranks, 87, 88 and 174, were removed,
P < 0.06382). A second Friedman test was done on the
13 samples with the lowest degree of allozyme intro-gression with Abpa and the six allozyme loci taken as variables (with all seven loci, P < 0.00127, with Abpa
removed, P < 0.01648, and with Amy1 removed,
P < 0.25057). These results showed the Abpa and Amy musculus alleles to be significantly more widespread
compared with those of Es1, Es10, Mpi, Np and Pgm in this region. The positions of these samples are indi-cated as triangles on the map in Figure 1 with the localities introgressed for Abpa encircled and it can be seen that they are not all clustered in one particular geographical area.
DISCUSSION
Two earlier studies on rather limited datasets sug-gested that the sex chromosomes are under stronger selection in the hybrid genome than is the average autosomal locus (Tucker et al., 1992; Dod et al., 1993). Our results on a much larger sample confirm that both the Y chromosome and the X chromosome locus Btk are under strong selection in the Jutland transect. We have also shown that the Y chromosome transition in the centre of the hybrid zone is even more abrupt than our preliminary study suggested (Dod et al., 1993). Very few localities harbour both variants or a Y vari-ant that does not correspond to the overall local genetic background. It should be noted that the sam-ple with a high frequency of domesticus variants on the musculus side of the zone, more than 10 km from the centre, was from Givskud zoo. The introgression found is almost certainly due to escapees from their mouse-breeding colony which was closed soon after this sample was caught (1991). None of the males caught in 1987 and 1998 in the same place carried a
domesticus Y.
Assessing the involvement of selection in shaping the Abpa cline is not straightforward. We have seen that the central step of the Abpa cline is higher com-pared with that of the average autosomal locus, which means that the right hand tail of introgression is dis-placed to higher musculus frequencies. The most likely estimate of the cline parameter B1, given in Table 3, suggests that Abpa is subjected to a stronger barrier to gene flow than are most allozymes.
How-ever, the corresponding estimate of the parameter q1,
which reflects the ratio of the selection on the locus itself to the overall selection caused by the rest of the genome, suggests that Abpa itself is not submitted to significantly stronger selection than are the alloz-ymes. This situation could result from the linkage of
Abpa to a locus under strong selection in the centre of
the hybrid zone. However, we have seen that there is considerable uncertainty with respect to these param-eter estimates. Figure 3 gives graphical
representa-tions of the log-likelihood support limits for B1 and q1
for the Abpa cline and it can be seen that they are neg-atively correlated so that the Abpa data could also be
Figure 3. Likelihood (LL) surface of the values of B1 (A)
and q1 (B) that fall within the two log-likelihood support
limits. (C) envelope of the corresponding values of q1 and
B1 for all the models that fall within the confidence interval.
–83.5 –84 –84.5 –85 –85.5 –86 0 20 40 60 80 100 120 A LL B1 –83.5 –84 –84.5 –85 –85.5 –86 0.12 0.08 0.06 0.04 0.02 0 0 20 40 60 80 100 120 0.1 0 0.02 0.04 0.06 0.08 0.10 0.12 B LL q1 q1 B1 C
SELECTION IN MOUSE HYBRID ZONE
453
described acceptably by a barrier as low as that found for the average allozyme locus (around 20 km) but
with a higher value for the parameter q1. If this were
the case it would imply direct selection on Abpa in the tail of introgression. Assuming a barrier for Abpa of the order of 20 km, the maximum acceptable value for
parameter q1 would be around 0.1 (Fig. 3), which
implies direct selection on Abpa of the order of 0.005 if the intensity of the overall selection acting in the hybrid zone is taken as 0.05, as estimated by Raufaste
et al. (2005, this issue). However, it is not certain that
such a small selection coefficient can be measured with any confidence using this kind of approach.
The situation on the domesticus side of the zone can-not be interpreted in the same way. The asymmetry of the Abpa cline is due to a very abrupt frequency change on the domesticus side of the estimated centre. This is also the case for a number of the allozyme markers and Raufaste et al. (2005, this issue) suggested that it is at least partially due to the influence of a geographical barrier to gene flow that occurs on the domesticus side of the zone. Such a barrier would contribute to the abruptness of the frequency change observed for Abpa but it makes the high frequency of musculus Abpa alle-les found further south even more surprising. Recent long-distance migration from the musculus side of the transect is unlikely to explain all the observed Abpa introgression since it is not geographically aggregated and in the majority of the localities concerned the only other locus introgressed to a similar extent is Amy1. A possible explanation is that the domesticus mice which colonized south Jutland were already introgressed for certain loci before they arrived. All the islands along the eastern side of the Jutland peninsula have
mus-culus populations and secondary contact between the
two subspecies occurs further south in Holstein (Prager et al., 1993) and in northern Germany, so opportunities for introgression were multiple. It has been shown that the takeover of M. m. musculus mtDNA by a domesticus haplotype in Northern Jut-land (Ferris et al., 1983) occurred at the time of colo-nization, rather than by flow across the hybrid zone (Vanlerberghe et al., 1988b). The settlement of farmers within the last 150 years in large areas of previously unoccupied land in Jutland could also have contrib-uted to sporadic introgression. Whatever their origin, the persistence of such high frequencies of musculus
Abpa alleles makes it unlikely that this variant is
selected against in a domesticus background.
In conclusion, we find that Abpa seems to be more affected by selection in the hybrid zone than is the average autosomal locus. The most likely explana-tion is linkage to a gene under selecexplana-tion in the hybrid genome. However, we cannot exclude the pos-sibility that the pattern is due to weak selection on
Abpa itself in the musculus tail of introgression,
which would be consistent with the behavioural results of Bímová, Karn & Piálek (2005, this issue), who found some evidence for weak preferences at the edges of a Czech transect of the hybrid zone. However, before considering the possibility that behaviour at the edges of the cline influences the shape of the introgression tails, as suggested earlier by Laukaitis et al. (1997), we need better estimates of selection than we were able to make in the com-plex Jutland transect.
ACKNOWLEDGEMENTS
We would like to thank Patrick Makoundou, Cathy Litel and Sam Steevenson for helping with the genetic typing and Guila Ganem for kindly sharing some of the samples. This research was partially supported by the Holcomb Research Institute at Butler University and that support is gratefully acknowledged.
REFERENCES
Barton NH, Gale KS. 1993. Genetic analysis of hybrid zones.
In: Harrison RG, ed. Hybrid zones and the evolutionary pro-cess. Oxford: Oxford University Press, 13–45.
Barton NH, Hewitt GM. 1985. Analysis of hybrid zones.
Annual Review of Ecology and Systematics 16: 113–148.
Bímová B, Karn RC, Piálek J. 2005. The role of salivary
androgen-binding protein in reproductive isolation between two subspecies of house mouse: Mus musculus musculus and Mus musculus domesticus. Biological Journal of the Linnean Society 84: 349–361.
Boissinot S, Boursot P. 1997. Discordant phylogeographic
patterns between the Y chromosome and mitochondrial DNA in the house mouse: selection on the Y chromosome? Genetics
146: 1019–1033.
Boursot P, Auffray J-C, Britton-Davidian J, Bonhomme F. 1993. The evolution of house mice. Annual Review of
Ecol-ogy and Systematics 24: 119–152.
Dod B, Jermiin LS, Boursot P, Chapman VM, Nielsen JT, Bonhomme F. 1993. Counterselection on sex chromosomes
in the Mus musculus European hybrid zone. Journal of Evo-lutionary Biology 6: 529–546.
Ferris SD, Sage RD, Huang C-M, Nielsen JT, Ritte U, Wil-son AC. 1983. Flow of mitochondrial DNA across a species
boundary. Proceedings of the National Academy of Sciences, USA 80: 2290–2294.
Hunt WG, Selander RK. 1973. Biochemical genetics of
hybridisation in European house mice. Heredity 31: 11– 33.
Hwang JM, Hofstetter JR, Bonhomme F, Karn RC. 1997.
The microevolution of mouse salivary androgen-binding pro-tein (ABP) paralleled subspeciation of Mus musculus. Hered-ity 88: 93–97.
Karn RC, Dlouhy SR. 1991. Salivary androgen-binding
pro-tein variation in Mus and other rodents. Journal of Heredity
454
B. DOD ET AL.Karn RC, Nachman MW. 1999. Reduced nucleotide
variabil-ity at an androgen-binding protein locus (Abpa) in house mice: evidence for positive natural selection. Molecular Biol-ogy and Evolution 16: 1192–1197.
Karn RC, Orth A, Bonhomme F, Boursot P. 2002. The
com-plex history of a gene proposed to participate in a sexual iso-lation mechanism in house mice. Molecular Biology and Evolution 19: 462–471.
Laukaitis CM, Crister ES, Karn RC. 1997. Salivary
andro-gen-binding protein (ABP) mediates assortative mate selec-tion in Mus musculus. Evoluselec-tion 51: 2000–2005.
Laukaitis CM, Karn RC. 2005. Evolution of the
secretoglo-bins: a genomic and proteomic view. Biological Journal of the Linnean Society 84: 493–501.
Munclinger P, Boursot P, Dod B. 2003. B1 insertions as
easy markers for mouse population studies. Mammalian Genome 14: 359–366.
Munclinger P, Bo íková E, ugerková M, Piálek J, Macholán M. 2002. Genetic variation in house mice (Mus,
Muridae, Rodentia) from the Czech and Slovak Republics. Folia Zoologica 51: 81–92.
Prager EM, Sage RD, Gyllensten U, Thomas WK, Hübner R, Jones CS, Noble L, Searle JB, Wilson AC. 1993.
Mito-chondrial DNA sequence diversity and colonization of Scandinavia by house mice from East Holstein. Biological Journal of the Linnean Society 50: 85–122.
Prager EM, Tichy H, Sage RD. 1996. Mitochondrial DNA
variation in the eastern house mouse, Mus musculus: Com-parison with other house mice and report of a 75-bp tandem repeat. Genetics 143: 427–446.
zˇ Sˇ
Raufaste N, Orth A, Belkhir K, Senet D, Smadja C, Baird SJE, Bonhomme F, Dod B, Boursot P. 2005. Inferences
of selection and migration in the Danish house mouse hybrid zone. Biological Journal of the Linnean Society 84: 593–616.
Sage RD, Whitney JB III, Wilson AC. 1986. Genetic
analy-sis of a hybrid zone between domesticus and musculus mice (Mus musculus complex): hemoglobin polymorphisms. In: Potter M, Nadeau JH, Cancro MP, eds. The wild mouse in immunology. Berlin: Springer-Verlag, 75–85.
Talley HM, Laukaitis CM, Karn RC. 2001. Female
prefer-ence for male saliva: implications for sexual isolation of Mus musculus subspecies. Evolution 55: 631–634.
Tucker PK, Sage RD, Warner J, Wilson AC, Eicher EM. 1992. Abrupt cline for sex chromosomes in a hybrid zone
between two species of mice. Evolution 46: 1146–1163.
Vanlerberghe F, Boursot P, Catalan J, Gerasimov S, Bonhomme F, Botev BA, Thaler L. 1988a. Analyse
géné-tique de la zone d’hybridation entre les deux sous-espèces de souris Mus musculus domesticus et Mus musculus musculus en Bulgarie. Genome 30: 427–437.
Vanlerberghe F, Boursot P, Nielsen JT, Bonhomme F. 1988b. A steep cline for mitochondrial DNA in Danish mice.
Genetical Research 52: 185–193.
Vanlerberghe F, Dod B, Boursot P, Bellis M, Bonho-mme F. 1986. Absence of Y-chromosome introgression
across the hybrid zone between Mus musculus domesticus and Mus musculus musculus. Genetical Research 48: 191– 197.
SELECTION IN MOUSE HYBRID ZONE
455
APPENDIX
Locality
, sampling year
, geographical coordinates
, derived coordinate that defi
nes its position on the one dimensional c
line , fr equency of Mus musculus musculus alleles (fr mus
) and effective sample size (
Ne
) of each sample for loci
Abpa
,
Btk
,
Zfy
and the average autosomal locus
. Numbers in the fi
rst
col-umn refer to the samples analysed in
Raufaste et al . (2005, this issue ). No . Locality Y ear Longitude Latitude Transect Btk A verage autosomal locus Abpa Zfy fr mus Ne fr mus Ne fr mus Ne fr mus N 186 Ringtved 2000 522.13 6125.52 6143.49 0.00 4.00 0.00 14.00 0.00 6.00 115 Simmersted A 1985 525.00 6128.50 6146.80 0.00 6.27 0.00 54.00 0.00 6.76 0.00 4.00 114 Simmersted 1991 525.00 6128.50 6146.80 0.00 4.92 0.00 195.00 0.13 7.69 0.00 2.00 113 Simmersted 1990 525.00 6128.50 6146.80 0.00 2.00 0.03 32.00 0.00 4.00 181 Kastvra 2000 521.36 6129.05 6146.90 0.00 3.00 0.00 24.00 0.00 6.00 182 Kastvra A 2000 522.15 6129.22 6147.17 0.00 16.00 0.01 174.00 0.04 26.00 187 Sillerup 2000 535.74 6128.38 6147.29 0.00 8.76 0.06 43.00 0.07 9.02 189 Slusen 2000 538.15 6133.66 6152.34 0.00 1.00 0.00 10.00 0.50 2.00 92 Oedis 1984 524.40 6140.50 6158.64 0.56 4.84 0.12 28.00 0.64 3.50 0.00 6.00 88 Maltbaek Mark 1992 505.10 6144.75 6160.50 0.00 3.48 0.13 40.00 0.33 2.70 93 Oedis F 1985 526.30 6142.30 6160.66 0.00 1.50 0.13 18.00 0.50 1.50 87 Maltbaek 1992 504.10 6145.25 6160.88 0.00 9.01 0.11 107.00 0.00 11.93 0.00 7.00 184 Lauritzminde 2000 541.41 6144.14 6161.99 0.00 26.00 0.00 194.00 0.45 36.47 175 Binderup 2000 535.09 6143.27 6162.19 0.00 4.00 0.00 34.00 0.00 4.00 188 Skartved 2000 534.22 6145.88 6164.84 0.00 2.00 0.04 24.00 0.00 2.00 190 Soender Stenderup 2000 538.65 6146.51 6164.95 0.00 1.00 0.00 12.00 0.00 2.00 174 Baeklund 2000 516.18 6149.29 6166.36 0.00 12.04 0.05 57.00 0.05 6.76 179 Gelballe 2000 522.60 6149.29 6167.14 0.20 5.00 0.00 46.00 0.14 7.00 154 Vranderup 1998 524.80 6149.75 6167.87 0.00 3.09 0.19 20.00 0.33 2.52 0.00 1.00 33 Gesten 1998 511.20 6154.70 6171.12 0.00 1.91 0.28 9.00 0.00 1.17 0.00 1.00 133 Trelde 1998 549.10 6162.30 6172.89 0.00 1.28 0.14 9.00 0.50 1.28 140 V ejlby 1998 545.40 6162.95 6176.24 0.00 1.97 0.14 25.00 0.00 3.87 0.00 1.00 10 Baekke 1998 509.70 6160.60 6176.80 0.13 5.95 0.21 31.00 0.04 3.95 0.00 8.00 151 V iuf 1998 531.70 6158.85 6177.74 0.00 6.22 0.14 36.00 0.06 4.57 0.00 5.00 153 V orbasse sk 1992 507.10 6162.20 6178.07 0.00 1.00 0.06 16.00 0.00 2.00 0.00 1.00 101 Rands A 1998 543.65 6164.20 6178.38 0.00 2.00 0.00 6.00 0.00 2.00 152 V orbasse 1992 503.50 6163.15 6178.57 0.00 4.88 0.25 22.00 0.16 2.79 0.00 8.00 100 Rands 1998 543.40 6164.75 6178.93 0.00 2.66 0.23 21.00 0.00 2.66 124 Starup 1998 487.10 6166.80 6180.20 1.00 1.00 0.19 10.00 0.00 1.23 0.00 1.00 24 Egtved 1 1990 519.50 6163.30 6180.67 0.00 1.00 0.19 12.00 0.00 1.45 Egtved 1991 522.00 6164.25 6181.92 0.00 1.00 0.00 8.00
456
B. DOD ET AL. 7 Ammistbol 1990 525.60 6165.50 6183.60 0.00 2.55 0.25 16.00 0.00 1.00 128 T oerskind 1984 519.88 6166.90 6184.29 0.00 8.42 0.10 69.00 0.00 7.90 0.00 9.00 129 T oerskind 1985 519.88 6166.90 6184.29 0.50 3.62 0.10 46.00 0.10 5.51 0.00 4.00 130 T oerskind 1991 519.88 6166.90 6184.29 0.00 7.81 0.20 28.00 0.04 5.89 0.00 4.00 8 Ammistbol A 1992 527.30 6166.50 6184.80 0.25 10.00 137 Tufkaer Mark 1998 531.60 6166.05 6184.87 0.00 1.00 0.21 9.00 0.00 1.28 95 Oedsted 1990 523.90 6167.25 6185.13 0.44 7.00 0.00 0.84 94 Oedsted 1991 523.90 6167.25 6185.13 0.00 1.37 0.16 16.00 0.00 2.09 0.00 2.00 96 Oedsted 1992 523.90 6167.25 6185.13 0.00 8.79 0.20 46.00 0.04 6.21 0.00 8.00 14 Bindeballe 1992 517.60 6168.30 6185.40 0.14 4.39 0.23 31.00 0.00 3.94 0.00 2.00 Stubberup 1990 528.50 6167.05 6185.49 0.00 2.00 0.00 2.00 Mejsling 1998 526.90 6168.70 6186.93 0.00 1.00 0.00 2.00 117 Skoldbjerg 1992 505.85 6171.85 6187.49 0.05 8.97 0.20 51.00 0.12 6.89 52 Hojen Kirke 1998 531.00 6168.90 6187.63 0.00 6.93 0.18 33.00 0.04 5.30 0.00 3.00 72 J erlev V 1992 527.45 6170.20 6188.49 0.17 7.64 0.09 49.00 0.00 6.26 0.00 5.00 71 J erlev A 1998 528.00 6170.25 6188.60 0.00 3.87 0.12 24.00 0.00 3.01 118 Smakaer 1998 520.40 6171.20 6188.62 0.00 1.88 0.34 27.00 0.25 3.56 0.50 2.00 134 Troellund 1992 502.50 6173.80 6189.02 0.00 6.79 0.26 36.00 0.21 4.41 0.00 7.00 102 Ra vning 1992 521.85 6171.55 6189.15 0.00 8.74 0.41 58.00 0.05 7.69 0.00 2.00 125 Store Lihme 1987 519.70 6172.30 6189.63 0.40 3.92 0.38 43.00 0.75 2.80 1.00 3.00 99 Plougslund A 1992 505.90 6174.04 6189.67 0.00 7.03 0.29 39.00 0.23 5.13 0.00 4.00 98 Plougslund 1992 505.95 6174.05 6189.69 0.00 7.47 0.26 38.00 0.21 4.86 0.00 12.00 70 J erlev 1998 528.00 6171.70 6190.04 0.00 1.00 0.64 13.00 0.00 1.80 0.00 1.00 73 Kaerbolling 1987 525.40 6172.70 6190.72 1.00 0.75 0.57 5.00 0.50 0.75 145 V ilstrup 1992 529.35 6172.30 6190.80 0.33 3.00 0.27 36.00 0.50 2.00 0.00 1.00 20 Bredsten 1985 523.20 6173.10 6190.85 0.67 3.00 0.52 52.00 0.50 4.00 21 Bredsten 1987 523.20 6173.10 6190.85 0.67 2.40 0.47 16.00 1.00 2.17 1.00 1.00 Bredsten 1991 523.20 6173.10 6190.85 1.00 2.00 26 Englesholm Mark 1998 521.10 6173.55 6191.04 0.00 1.00 0.56 8.00 0.50 1.06 1.00 1.00 13 Balle A 1987 523.70 6174.10 6191.90 1.00 1.00 0.44 16.00 1.00 1.94 0.00 1.00 44 Grene Kirke 1998 504.40 6176.50 6191.93 0.20 4.60 0.33 27.00 0.33 3.38 0.00 1.00 11 Balle 1992 522.80 6174.65 6192.34 0.65 11.85 0.60 110.00 0.43 14.14 1.00 6.00 12 Balle 1998 522.80 6174.65 6192.34 0.00 1.00 0.64 14.00 0.75 2.44 1.00 1.00 120 Soedover 1985 521.55 6174.95 6192.48 1.00 2.80 0.50 64.00 1.00 3.29 1.00 2.00 121 Soedover 1992 521.55 6174.95 6192.48 1.00 1.00 0.50 12.00 1.00 1.46 80 Lildfrost 1998 525.90 6174.80 6192.87 0.67 2.28 0.56 14.00 0.25 1.88 No . Locality Y ear Longitude Latitude Transect Btk A verage autosomal locus Abpa Zfy fr mus Ne fr mus Ne fr mus Ne fr mus NAPPENDIX
ContinuedSELECTION IN MOUSE HYBRID ZONE
457
15 Braendgaarde 1998 512.20 6176.70 6193.08 0.50 2.24 0.67 15.00 1.00 1.93 1.00 2.00 45 Grinsted 1992 497.85 6178.90 6193.52 0.88 15.00 142 V ester Hornstrup 1998 526.20 6175.90 6193.99 0.51 8.68 0.47 39.00 0.61 4.68 1.00 17.00 138 Uhre 1998 531.60 6175.60 6194.35 0.75 1.27 0.63 10.00 1.00 1.27 143 V ester Hornstrup A 1998 526.80 6176.20 6194.36 1.00 1.00 0.50 11.00 1.00 1.77 1.00 1.00 31 Gammelby 1992 520.75 6177.35 6194.77 0.00 1.00 0.58 35.00 1.00 2.00 1.00 2.00 32 Gammelby 1998 520.75 6177.35 6194.77 1.00 1.32 0.69 11.00 1.00 1.32 25 Elkaer 1998 504.80 6179.50 6194.96 1.00 1.00 0.81 11.00 1.00 1.33 1.00 1.00 106 Rugballe 1992 527.80 6176.80 6195.08 0.18 5.67 0.53 37.00 0.93 4.14 1.00 7.00 107 Rugballe A 1992 527.70 6177.00 6195.27 1.00 1.03 0.69 8.00 1.00 1.39 1.00 1.00 22 Brunbjerg 1998 502.80 6180.10 6195.31 1.00 1.00 0.69 8.00 0.50 0.97 1.00 1.00 108 Rugballe B 1991 528.00 6177.05 6195.35 1.00 4.75 0.71 26.00 1.00 2.86 109 Rugballe B 1992 528.00 6177.05 6195.35 0.33 2.29 0.60 18.00 0.75 1.90 0.50 2.00 110 Rugballe B 1998 528.00 6177.05 6195.35 0.50 1.11 0.58 14.00 0.50 1.61 1.00 1.00 61 Hovertoft 1998 532.50 6176.50 6195.36 1.00 2.32 0.75 17.00 0.75 1.94 60 Hover Kirke A 1998 531.00 6176.70 6195.37 1.00 1.00 0.63 8.00 1.00 0.94 1.00 1.00 81 Lille Hoegsholt 1998 531.00 6176.75 6195.42 1.00 1.00 0.88 16.00 1.00 2.00 1.00 1.00 59 Hover Kirke 1998 529.90 6177.10 6195.64 0.67 2.53 0.69 19.00 1.00 2.47 97 Oelgod 1998 478.85 6184.00 6196.26 0.00 1.19 0.31 10.00 0.00 1.19 135 Trollerup 1992 522.70 6178.70 6196.35 1.00 1.58 0.46 23.00 0.75 2.60 1.00 2.00 136 Trollerup 1998 522.70 6178.70 6196.35 1.00 2.69 0.72 22.00 1.00 2.92 1.00 1.00 82 Lindeballe 1992 512.25 6180.30 6196.66 0.55 5.05 0.61 23.00 0.41 3.03 1.00 5.00 67 J elling bis 1987 526.10 6178.80 6196.86 1.00 1.00 0.88 21.00 1.00 2.14 83 Lindeballe A 1992 513.00 6180.65 6197.10 1.00 1.00 0.44 9.00 74 Kiddelund 1998 522.90 6179.50 6197.16 0.75 2.66 0.80 18.00 0.83 2.39 1.00 2.00 89 Moelvang 1990 522.85 6179.60 6197.26 0.67 2.72 0.50 22.00 1.00 1.72 90 Moelvang 1992 522.85 6179.60 6197.26 0.50 1.10 0.75 9.00 1.00 1.10 Moelvang 1991 522.85 6179.60 6197.26 1.00 1.00 1.00 2.00 66 J elling 1990 526.45 6179.25 6197.35 0.75 3.04 0.82 20.00 0.67 3.09 50 Hoerup 1990 530.15 6179.50 6198.05 0.64 2.64 0.67 25.00 0.70 2.79 51 Hoerup 1991 530.15 6179.50 6198.05 0.69 4.52 0.71 20.00 0.92 2.49 1.00 14.00 48 Hoegelund 1998 509.80 6182.10 6198.15 0.92 12.79 0.67 95.00 0.95 10.96 0.83 6.00 47 Hjortlund 1998 504.20 6182.80 6198.16 0.25 10.11 0.64 64.00 0.91 9.34 1.00 3.00 30 Gadbjerg 1987 520.50 6181.20 6198.56 0.50 0.87 0.67 5.00 1.00 0.87 91 Norskov 1992 515.30 6182.05 6198.77 1.00 1.20 0.66 13.00 0.50 1.20 1.00 1.00 78 Langelund S 1998 508.25 6183.15 6199.00 1.00 4.68 0.56 24.00 0.79 2.92 1.00 9.00 131 T ofthoj 1987 521.20 6181.70 6199.14 1.00 1.14 0.50 8.00 0.50 1.14 119 Smidstrup 1992 516.85 6182.35 6199.26 0.50 5.20 0.69 42.00 0.50 5.18 1.00 2.00 29 F ilskov A 1992 500.10 6184.50 6199.35 1.00 1.62 0.81 13.00 0.50 1.62 16 Brandbjerg 1985 529.30 6181.15 6199.58 1.00 3.88 0.82 32.00 0.67 2.32 17 Brandbjerg 1991 529.30 6181.15 6199.58 0.74 16.10 0.85 85.00 0.94 10.95 1.00 19.00 18 Brandbjerg 1992 529.30 6181.15 6199.58 1.00 1.00 0.69 7.00 1.00 0.88 63 Hygum 1990 527.40 6181.40 6199.60 1.00 1.00 0.81 10.00 1.00 1.27 64 Hygum A 1998 526.00 6181.60 6199.63 1.00 2.91 0.91 29.00 1.00 3.67 1.00 1.00 No . Locality Y ear Longitude Latitude Transect Btk au tosoma l locus Abpa Zfy fr mus Ne fr mus Ne fr mus Ne fr mus N458
B. DOD ET AL. 28 F ilskov 1992 499.20 6185.05 6199.78 1.00 2.35 0.78 15.00 0.50 2.04 19 Bredal 1998 538.00 6179.30 6199.86 0.40 3.70 0.69 31.00 0.88 3.82 1.00 2.00 77 Langelund F 1998 504.25 6184.80 6200.15 1.00 4.47 0.74 27.00 1.00 3.61 65 Hygum B 1998 527.70 6182.60 6200.83 0.92 7.71 0.86 40.00 1.00 4.98 1.00 5.00 146 V indelev M 1985 530.30 6182.60 6201.14 1.00 1.00 0.73 41.00 1.00 1.64 1.00 3.00 147 V indelev M 1987 530.30 6182.60 6201.14 1.00 1.00 0.86 11.00 1.00 1.60 1.00 1.00 148 V indelev M 1991 530.30 6182.60 6201.14 1.00 4.14 0.69 23.00 0.64 4.99 1.00 2.00 149 V indelev S 1991 530.05 6182.70 6201.21 0.96 4.49 0.74 21.00 0.80 2.82 1.00 6.00 150 V indelev S 1992 530.05 6182.70 6201.21 1.00 7.48 0.66 43.00 0.71 5.26 1.00 13.00 111 Sandvad 1990 528.00 6183.45 6201.71 0.92 5.05 0.79 27.00 0.75 3.32 1.00 4.00 112 Sandvad 1991 528.00 6183.45 6201.71 1.00 1.98 0.63 8.00 1.00 0.98 84 Lindved 1990 536.10 6183.00 6202.37 1.00 2.91 0.83 25.00 1.00 2.29 1.00 2.00 103 Riis A 1998 520.10 6185.50 6202.78 1.00 2.75 0.69 14.00 1.00 1.89 1.00 1.00 36 Givskud Z 1987 522.00 6185.40 6202.91 1.00 3.53 0.86 32.00 1.00 3.53 1.00 1.00 37 Givskud Z 1991 522.00 6185.40 6202.91 0.68 15.34 0.75 93.00 0.70 11.93 0.17 6.00 38 Givskud Z 1998 522.00 6185.40 6202.91 1.00 9.82 0.80 45.00 0.87 5.86 1.00 12.00 35 Givskud E 1991 521.95 6185.95 6203.45 1.00 3.29 0.84 19.00 0.75 1.77 1.00 2.00 2 Aadel A 1991 528.70 6185.40 6203.73 1.00 1.03 0.44 8.00 1.00 1.03 3 Aadel A 1998 528.70 6185.40 6203.73 1.00 3.60 0.71 34.00 1.00 5.53 1.00 1.00 62 Hvejsel 1998 526.45 6185.70 6203.75 0.33 3.68 0.81 24.00 0.88 3.12 1.00 1.00 9 Baastrup 1987 540.50 6182.55 6203.96 0.86 6.43 0.77 39.00 0.65 4.86 1.00 7.00 34 Give Mark 1992 514.40 6187.45 6204.02 1.00 4.74 0.88 33.00 1.00 3.74 1.00 2.00 116 Skaerhoved 1998 517.20 6187.40 6204.31 0.75 14.00 1.00 1.69 1 Aadel 1990 529.00 6186.00 6204.36 1.00 2.41 0.81 21.00 122 Soendersthoved 1998 510.50 6188.30 6204.39 1.00 3.20 0.81 22.00 1.00 2.91 1.00 3.00 104 Riis 1998 519.90 6187.40 6204.64 1.00 4.92 0.81 41.00 0.75 5.22 1.00 2.00 144 V ibjerg 1998 517.70 6188.10 6205.07 1.00 1.00 0.88 16.00 0.50 1.99 1.00 1.00 F ousing 1990 528.65 6186.97 6205.28 1.00 1.00 2.00 46 Hedegaard 1998 510.80 6189.20 6205.32 1.00 1.00 0.88 16.00 1.00 2.00 1.00 1.00 4 Aalsted Moelle 1991 529.20 6187.20 6205.57 1.00 3.02 0.80 14.00 0.92 1.98 1.00 1.00 No . Locality Y ear Longitude Latitude Transect Btk A verage autosomal locus Abpa Zfy fr mus Ne fr mus Ne fr mus Ne fr mus NAPPENDIX
ContinuedSELECTION IN MOUSE HYBRID ZONE