HAL Id: hal-02326694
https://hal.archives-ouvertes.fr/hal-02326694
Submitted on 22 Oct 2019
HAL is a multi-disciplinary open access
archive for the deposit and dissemination of
sci-entific research documents, whether they are
pub-lished or not. The documents may come from
teaching and research institutions in France or
abroad, or from public or private research centers.
L’archive ouverte pluridisciplinaire HAL, est
destinée au dépôt et à la diffusion de documents
scientifiques de niveau recherche, publiés ou non,
émanant des établissements d’enseignement et de
recherche français ou étrangers, des laboratoires
publics ou privés.
M. Szulkin, P.-A. Gagnaire, N. Bierne, A. Charmantier
To cite this version:
M. Szulkin, P.-A. Gagnaire, N. Bierne, A. Charmantier. Population genomic footprints of fine-scale
differentiation between habitats in Mediterranean blue tits. Molecular Ecology, Wiley, 2016, 25 (2),
pp.542-558. �10.1111/mec.13486�. �hal-02326694�
For Review Only
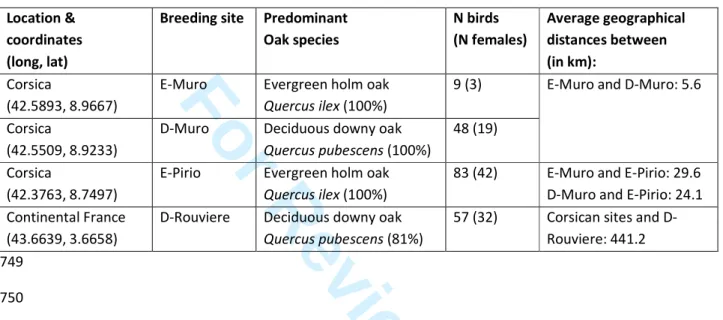
Population genomic footprints of fine-scale differentiation
between habitats in Mediterranean blue tits
Journal: Molecular Ecology
Manuscript ID MEC-15-0774.R3
Manuscript Type: Original Article
Date Submitted by the Author: n/a
Complete List of Authors: Szulkin, Marta; CEFE, UMR 5175 CNRS
Gagnaire, Pierre-Alexandre; ISEM, UMR 5554 CNRS
Bierne, Nicolas; Institut des Sciences de l'Evolution, Integrative Genomics
Charmantier, Anne; CEFE, UMR 5175 CNRS
Keywords:
blue tit, Population Genetics - Empirical, Landscape Genetics, local
adaptation, RAD sequencing, genomic differentiation
For Review Only
1
Population genomic footprints of fine-scale differentiation between
1
habitats in Mediterranean blue tits
2
3
M. Szulkin
1§*
, P.-A. Gagnaire
2,3*
, N. Bierne
2,3
& A. Charmantier
1
4
1
Centre d’Ecologie Fonctionnelle et Evolutive, UMR 5175 Campus CNRS, 1919 Route de Mende,
5
34293 Montpellier cedex 5, France
6
2
Université Montpellier 2, Place Eugène Bataillon, 34095 Montpellier Cedex 5, France
7
3
![The wind of the B[e] supergiant Henize S22 viewed through a reflection nebula in DEM L106](data:image/gif;base64,R0lGODlhAQABAIAAAP///wAAACH5BAEAAAAALAAAAAABAAEAAAICRAEAOw==)