arXiv:astro-ph/0212462v1 19 Dec 2002
Reflection Nebula in DEM L 106
You-Hua Chu1,2, C.-H. Rosie Chen1, Charles Danforth2,3, Bryan C. Dunne1, Robert A.
Gruendl1, Ya¨el Naz´e4,5, M. S. Oey6, Sean D. Points2,7
ABSTRACT
Narrow-band HST WFPC2 images reveal a bow-shock-like halo around the H II region N30B toward the B[e] supergiant Hen S22 located within the larger DEM L 106 nebula in the Large Magellanic Cloud. High-dispersion spectra of N30B show a narrow Hα emission component from the ionized gas; the velocity variations indicate a gas flow of −5 to −10 km s−1 in the vicinity of the H II
regions, which is resultant from interactions with Hen S22’s stellar wind and responsible for the bow-shock morphology. Spectra of N30B’s halo show broad Hα profiles extending over > 1000 km s−1, similar to that of Hen S22, indicating
that the halo is a reflection nebula of Hen S22. Broad-band morphologies of N30B’s halo are also consistent with the reflection nebula interpretation. We use dust-scattering properties and the observed brightnesses of the reflection nebula and Hen S22 to constrain the reflection geometry. The reflected stellar Hα emission and absorption vary across the reflection nebula as a result of viewing S22’s anisotropic wind across varying angles. This reflection nebula, together with the edge-on orientation of Hen S22’s disk, provides an invaluable opportunity to study the disk and polar winds of a B[e] supergiant.
1Astronomy Department, University of Illinois, 1002 W. Green Street, Urbana, IL 61801;
[email protected], [email protected], [email protected], [email protected]
2Visiting astronomer, Cerro Tololo Inter-American Observatory
3Department of Physics and Astronomy, Johns Hopkins University, 3400 N. Charles Street, Baltimore,
MD 21218; [email protected]
4Institut d’Astrophysique et de G´eophysique, All´ee du 6 Aoˆut 17, Bat. B5c, B 4000 Li`ege (Sart-Tilman),
Belgium; [email protected]
5Research Fellow FNRS (Belgium)
6Lowell Observatory, 1400 W. Mars Hill Rd., Flagstaff, AZ 86001; [email protected]
7Department of Physics and Astronomy, Northwestern University, 2145 Sheridan Rd., Evanston, IL 60208;
Subject headings: Magellanic Clouds — HII regions — ISM: individual (DEM L 106) — Stars: emission-line, Be — Stars: mass loss
1. Introduction
A Hubble Space Telescope (HST) WFPC2 Hα image of the H II region DEM L 106 (Davies, Elliott, & Meaburn 1976) in the Large Magellanic Cloud (LMC) revealed a pair of bright, compact H II regions embedded within a large shell nebula (Chen et al. 2000). DEM L 106 has been previously cataloged by Henize (1956) as N30, and the two compact HII regions were identified as an H II knot and designated as N30B. As shown in Figure 1, while the main body of N30B is unremarkable, it is surrounded by a halo with sharp edges on the northern rim facing the luminous B[e] supergiant Hen S22 (= HD 34664; Henize 1956). B[e] supergiants are known to possess stellar winds (Zickgraf et al. 1996). The nebular morphology and relative location of Hen S22 and N30B thus appear to suggest that the halo of N30B is a bow shock produced by dynamical interactions with the wind of Hen S22.
A two-component stellar wind model has been proposed for B[e] supergiants: (1) a cool, slow wind along a dusty equatorial disk which gives rise to narrow, low-excitation emission lines of, e.g., FeII, [Fe II], and [OI], and (2) a hot, fast polar wind that is responsible for the broad, high-excitation absorption lines of, e.g., C IV, Si IV, and N V (Zickgraf et al. 1985, 1986). IUE spectra of Hen S22 in the 1800–3200 ˚A range are dominated by P Cygni type lines of FeII, from which it is derived that the equatorial disk is viewed nearly edge-on and the terminal wind velocity along the disk is ∼ 80 km s−1(Zickgraf et al. 1996); while IUE
spectra in the 1150–1950 ˚A range show blue-shifted absorption of SiIVand CIV indicating that the polar wind of Hen S22 has an expansion velocity >1000 km s−1 (Bensammar et al.
1983; Zickgraf et al. 1986). N30B is projected at 20′′–30′′ (or 5–7.5 pc for a distance of 50
kpc, Feast 1999) from Hen S22; its 24′′ spatial extent (Figure 1) has a good chance to be
partially located above the disk and interact with the polar wind of Hen S22.
To determine the nature and physical properties of the bow-shock-like halo around N30B, we have obtained high-dispersion, long-slit echelle spectra of N30B, its bow-shock-like halo, its surrounding interstellar medium, and Hen S22. We find that the bow-shock-bow-shock-like halo shows surprisingly broad Hα line profiles similar to that of Hen S22, suggesting that it is a reflection nebula. Furthermore, the spectral features vary from the east side to the west side of N30B, indicating that N30B indeed sees the wind of Hen S22 along a range of viewing angles. Recently archived HST WFPC2 images of N30B obtained by the Hubble Heritage
Project provide additional support to the interpretation of a reflection nebula for the halo of N30B. In this paper, we report these observations, and discuss the physical properties of N30B, the nature of its halo, and the implication of our results on the disk and polar winds of the B[e] supergiant Hen S22.
2. Observations and Data Reduction
2.1. HST WFPC2 Images
Our HST WFPC2 images of DEM L 106 (PI: Chu) were obtained on 1998 November 14. The observations were made through the F656N (Hα) filter for 3 × 800 s. The images were processed using the standard HST data pipeline and then combined to remove cosmic rays and to produce an image with a total exposure time of 2400 s. We further processed the resultant image with the standard procedures outlined in Chen et al. (2000) to extract Hα fluxes.
Two corrections have been applied to these Hα fluxes due to the ∼300 km s−1 red-shift
of the LMC. First, the filter transmission of the red-shifted Hα line is ∼ 93% of the peak transmission, so the extracted Hα fluxes are multiplied by a correction factor of 1.07. Second, the [NII] λ6548 line is red-shifted into the Hα passband at ∼ 90% of the peak transmission. Using the [N II] λ6548/Hα ratio measured from our echelle spectra (see §2.2), we find that the [NII] λ6548 line contributes to ∼ 4% of the Hα flux. Therefore, an additional correction factor of 0.96 is applied to the extracted Hα fluxes.
The HST WFPC2 images of DEM L 106 for the Hubble Heritage Project (PI: Noll) were obtained on 2001 October 18. The observations were made with the F 439W (WFPC2 B), F 555W (WFPC2 V ), F 814W (WFPC2 I), F 502N ([OIII]), and F 673N ([SII]) filters for exposure times of 2 × 160, 2 × 40, 2 × 100, 2 × 500, and 2 × 1100 s, respectively. Note that the broad-band images may contain contributions from nebular lines, e.g., the B band contains the Hγ, Hδ, and Hǫ lines and the V band contains the Hβ line. We have processed these images using standard procedures. We have also adjusted the coordinates using as-trometric solutions calculated from the GSC2.28 positions of 9 stars on the WF2 chip; our
8The Guide Star Catalogue-II is a joint project of the Space Telescope Science Institute and the
Osserva-torio Astronomico di Torino. Space Telescope Science Institute is operated by the Association of Universities for Research in Astronomy for the National Aeronautics and Space Administration under contract NAS5-26555. The participation of the Osservatorio Astronomico di Torino is supported by the Italian Council for Research in Astronomy. Additional support is provided by European Southern Observatory, Space Tele-scope European Coordinating Facility, the International GEMINI project and the European Space Agency
final coordinates should have ∼ 0.′′2 accuracy. The WFPC2 images of N30B are presented
in Figure 2.
2.2. High-Dispersion Echelle Spectroscopy
High-dispersion spectra of DEM L 106 were obtained with the echelle spectrograph on the 4 m telescope at Cerro Tololo Inter-American Observatory (CTIO) from two observing runs, 2000 January 22 and December 7. Both runs used the 79 line mm−1 echelle grating
in the single-order, long-slit observing configuration, in which a flat mirror replaced a cross disperser and a post-slit Hα filter was inserted to isolate a single order. The red long focus camera and the 2000×2000 SITe2K 6 CCD were used to record data. The 24 µm pixel size corresponds to roughly 0.082 ˚A along the dispersion and 0.′′26 perpendicular to the dispersion.
Limited by the optics of the camera, the useful spatial coverage is ∼3′. The spectral coverage
is wide enough to include both the Hα line and the flanking [N II] λλ6548, 6583 lines. A slitwidth of 250 µm (1.′′64) was used and the resultant FWHM of the instrumental profile
was 13.5 ± 0.5 km s−1. The spectral dispersion was calibrated by a Th-Ar lamp exposure
taken in the beginning of the night, but the absolute wavelength was calibrated against the geocoronal Hα line present in the nebular observations. The journal of echelle observations is given in Table 1.
3. Discussion
The two small H II regions in N30B are aligned roughly along the east-west direction, thus we call these two regions N30B-E and N30B-W, respectively. In the Hα image, apart from the bow-shock-like halo, the bright central regions of these two HIIregions have simple morphologies expected for Str¨omgren spheres. N30B-E is about 7′′ (1.7 pc) in diameter and
shows a bright spot at its northern edge, while N30B-W is 6′′ (1.45 pc) across and has a
rather uniform surface brightness.
3.1. Densities and Ionization of the HII Regions in N30B
The HST WFPC2 Hα image, with stellar emission excised, can be used to estimate the Hα luminosities and required ionizing fluxes of the HIIregions in N30B. We have made two
measurements which differ in their assumption as to whether the halo is a reflection nebula or part of the HII regions. If the halo around the HII regions is an envelope reflecting the light from Hen S22, a background component similar to the halo should be subtracted. The resultant integrated Hα fluxes for the 7′′ and 6′′ Str¨omgren spheres of N30B-E and N30B-W
are (5.0±0.5)×10−13ergs cm−2 s−1 and (3.3±0.4)×10−13ergs cm−2 s−1, respectively. These
fluxes have been corrected for the filter transmission and [NII] contamination. If the halo is ionized, a low background exterior to N30B should be used and the integrated fluxes of the HII regions including the halo would be about 80% larger; however, as we show in §3.3 this is not the case, so these large fluxes will not be used in further discussions. Adopting the extinction of D106-10 in N30B-W, E(B − V ) = 0.14 (Oey 1996a), and a distance of 50 kpc, we derive Hα luminosities of (2.0 ± 0.2) × 1035 ergs s−1 and (1.4 ± 0.2) × 1035 ergs s−1 and
required ionizing fluxes of (1.7 ± 0.2) × 1047 photons s−1 and (1.1 ± 0.2) × 1047 photons s−1
for the Str¨omgren spheres of N30B-E and N30B-W, respectively. Using the average surface brightness and adopting an emitting path length similar to the diameter of the HII region, we have further derived the rms densities of N30B-E and N30B-W, both ∼75 H-atoms cm−3.
To examine the stellar content and to estimate the available ionizing fluxes in N30B, we have carried out photometry for stars brighter than V = 20, using the WFPC2 B and V images. Such bright stars are expected to be of early types, so it is possible to apply constant zeropoints to transform the WFPC2 B and V to Johnson B and V . The color-magnitude diagram of Johnson V versus B −V is presented in Figure 3. Using the colors and magnitudes and assuming that these stars are still on the main sequence, we can deredden the stars and estimate their spectral types. This is easily done by projecting the position of a star in the color-magnitude diagram along the dereddening direction back to the main sequence. The photometric measurements and estimated spectral types are given in Table 2. Most of these stars have also been studied by Oey (1996b) using ground-based observations. The differences between her results and the new WFPC2 results are also given in Table 2 for comparison. Excellent agreements in photometry are found for stars in isolation, but the ground-based measurements for faint stars in crowded regions may have errors as large as ∆V ∼ 1 mag.
In N30B and its vicinity, stars brighter than V = 20 are all B stars. Ionizing fluxes from early-type stars have been given by Panagia (1973) down to B3 and Schaerer & de Koter (1997) down to B0.5. The ionizing fluxes of B0 V and B0.5 V stars given by the latter are significantly higher than those of the former. N30B-E contains only one early B star, star #13 in Table 2; the ionizing flux of this B2.5 V star is < 1045photons s−1 (Panagia 1973), two
orders of magnitude lower than that required to ionize N30B-E. It is possible that the B[e] supergiant Hen S22, of spectral type B0–B0.5 (Zickgraf et al. 1986), plays a significant role in the photoionization of N30B-E. N30B-W contains the bright star #6, which is saturated in
the WFPC2 images, but has been previously classified spectroscopically as a B1.5 V star (= D106-10; Oey 1996a). The ionizing flux of a B1.5 V star given by Panagia (1973) is 2×1045
photons s−1, which is also about two orders of magnitude lower than the required. However,
extrapolating from the ionizing fluxes of B0 V and B0.5 V stars given by Schaerer & de Koter (1997), we find that the ionizing flux of the B1.5 V star #6 (D106-10) is sufficient to ionize N30B-W.
3.2. Relationship between N30B and the Giant Shell DEM L 106
The relationship between the H II regions in N30B and the surrounding giant shell DEM L 106 may be assessed from their kinematic properties. An example of our echelle observations is illustrated in Figures 4a and 4b in two stretches to show the Hα and [N II] λ6548 lines from the E-W slit centered near the star #6 in N30B-W. The vertical axis is spatial with east on top, and the horizontal axis is spectral with wavelength increasing to the right. For convenience, we have converted wavelengths to heliocentric velocities of the Hα line and marked them along the horizontal axis in Figure 4. (All radial velocities in this paper are heliocentric.) The narrowest lines with uniform surface brightness along the slit are telluric Hα and OH lines, located near 0, −425, and +660 km s−1. The nebular Hα and [NII]
λ6548 lines can be found at +300 and −380 km s−1, respectively. The Hα line in Figures
4a and 4b shows a bright, narrow component and a faint, broad component. The spatial extent of the broad component coincides with that of N30B’s halo; this component will be discussed in §3.3. The narrow Hα component arises from ionized gas. The two Hα emission peaks near the center of Figure 4a correspond to the H II regions N30B-E and N30B-W, while the fainter Hα emission extending throughout the entire slit length corresponds to the giant shell in DEM L 106. No line splitting is detected in Hα or [N II] for either N30B or DEM L 106.
To analyze the kinematics of ionized gas quantitatively, we have extracted velocity profiles of the Hα and [NII] lines along each slit, made Gaussian fits, and plotted the results in Figure 5. The fitted velocities are plotted along the slit positions, with Hα in filled symbols and [N II] in open symbols; the fitted FWHM of the Hα line is plotted as the “error bar” at each position, except where data points are densely packed. The observed FWHM of the Hα line is the quadratic sum of the instrumental FWHM (13.5 km s−1), the thermal FWHM
(21.4 km s−1 at a temperature of 104 K), and the turbulent FWHM. Thus the observed Hα
FWHM of ∼26 km s−1for the H IIregions in N30B implies a turbulent FWHM of ∼6 km s−1.
This small internal turbulence is consistent with the expectation for HII regions ionized by early B-type stars, because they lack strong fast stellar winds. The giant shell in DEM L 106
has a larger observed FWHM in Hα, 35–40 km s−1, implying a turbulent FWHM of 24–31
km s−1. The lack of line splitting suggest that this large turbulent FWHM is dominated by
turbulence instead of a systematic shell expansion.
Further kinematic information is provided by the velocity variations shown in Figure 5. The average heliocentric velocity of DEM L 106 is ∼ 300 km s−1. Gradual velocity
excursions of up to ±10 km s−1 from the average velocity are seen. Along the NS slit
centered on Hen S22, a systematic blue-shift of −10 km s−1 is seen in the [NII] λ6583 line.
(The nebular Hα line is too contaminated by the stellar emission to be measured near the star.) These blue-shifts provide the only evidence that the internal motion of DEM L 106 does contain a component of systematic expansion at a level of ∼10 km s−1. The kinematics
of DEM L 106 show that this giant shell, formed by Hen S22 and the other massive stars in the OB association LH38 (Lucke & Hodge 1970), is by no means a simple expanding shell with a large central cavity. The interior of DEM L 106 may still contain a significant amount of gas in the form of dense cloudlets, and the dynamical interactions between the fast stellar winds and the cloudlets contribute to the large turbulent FWHM observed in DEM L 106.
The systemic velocities of the H II regions in N30B are similar to that of DEM L 106, suggesting that N30B is physically associated with DEM L 106. The gas in the vicinity of N30B and especially between its two HIIregions shows blue-shifts of −5 to −10 km s−1from
the systemic velocity (see Figure 5). Low-velocity flows can be produced by an evaporation off the ionization fronts in H II regions or dynamic interactions between stellar winds and H II regions. In an evaporation flow, the gas projected outside the H II disk would have motions perpendicular to the line of sight and show no offsets from the systemic velocity. In a dynamic interaction scenario, if the stellar wind source is on the far side of an H II
region, the ablation of the HII region by the stellar wind would produce a gas flow toward us. The ubiquitous blue-shifts observed in the vicinity of N30B indicate that the dynamic interaction between the stellar wind of Hen S22 and the HII regions in N30B is responsible for these low-velocity gas flow. N30B is probably one of the dense clouds within DEM L 106; its visibility is attributed to the early-B stars formed in its interior.
3.3. Spectra and Physical Nature of the Halo of N30B
We initially speculated that the bow-shock-like halo around N30B was produced by interactions between the fast polar wind of Hen S22 and the H II regions, and expected to see corresponding supersonic kinematic features within the spatial extent of the halo. The Hα+[N II] echellogram of N30B in Figure 4 shows that the only kinematic feature that matches the spatial extent of the halo is a prominent, broad Hα emission component. The
continuous distribution of this broad component over 18′′, from the eastern edge of N30B-E’s
halo to the western edge of N30B-W’s halo, indicates that the halo envelopes the HIIregions of N30B. The broad Hα emission is centered near 300 km s−1 and detected over a velocity
range greater than 1000 km s−1. Such high velocities obviously cannot be accelerated by
the wind of Hen S22; furthermore, such strong shocks would have produced more dramatic dynamic effects, such as X-ray emission, which is not seen (Chu et al. 1995).
Large velocity widths (> 1000 km s−1) have been observed in other H II regions, for
example, the Carina Nebula in our Galaxy and the giant H II region NGC 5471 in M101. The broad hydrogen Balmer line emission in the Car II region in the Carina Nebula has been attributed to the dust-scattered Balmer emission of η Carinae and is detected at as far as 5 pc from η Car (Lopez & Meaburn 1986). The broad Hα and [NII] lines in NGC 5471 have been suggested to be powered by supernova explosions and fast stellar winds (Casta˜neda, V´ılchez, & Copetti 1990). Clearly, N30B cannot be associated with supernova explosions, since no X-ray emission has been detected from this region (Chu et al. 1995). Furthermore, N30B does not show broad [NII] lines as are seen in NGC 5471, and therefore it should not have the same physical nature as the broad-line region in NGC 5471. We will thus focus on whether the broad Hα line from the halo of N30B may be dust-scattered Hα emission of the B[e] supergiant Hen S22.
To compare the broad Hα emission from the halo of N30B to that of Hen S22, we display the echellogram and Hα line profiles of Hen S22 in Figure 4c–d, below the echellogram of N30B. While they show qualitatively similar profiles with an absorption component blue-shifted from the centroid of the broad Hα emission, the widths and depths of the absorption are different. A similar behavior is observed in the reflection nebula Car II near η Car. Lopez & Meaburn (1986) extracted Hα line profiles from six positions in Car II; these broad profiles (in their Figure 3) all show an absorption component on the blue side of the nebular line, but the absorption strength decreases radially from η Car. Lopez & Meaburn (1986) suggested that the spatial variations in the dust-scattered Hα line in Car II reflected the temporal variability of the Hα profile of η Car (Ruiz, Melnick, & Ortiz 1984). However, after monitoring the Hα profiles of η Car and Car II from 1985 to 1997, Boumis et al. (1998) show that the the absorption feature in the reflected Hα line is spatially variable across Car II but temporally invariable over the 12-yr span, and conclude that the reflection nebula is located within a 46◦-wide cone of light from η Car along the axis of its bipolar Homunculus nebula.
We suggest that the broad Hα line from N30B’s halo is also dust-scattered Hα emission from a nearby Hα-emitting star, Hen S22 in this case. The position-dependence of the broad Hα line in N30B is also caused by different viewing angles, instead of a temporal variability of Hen S22, as discussed further in §3.5.
The reflection nebula around N30B is not unique in the vicinity of Hen S22. Our echelle observations also detected broad Hα line profiles in the nebulosity at 20′′ east of N30B, at a
much fainter level. The bow-shock-like morphology of the reflection nebula around N30B is also not unique among reflection nebulae, as a similar nebula has been observed around the B2 V star LSS 3027 in our Galaxy (Chu 1983). In both cases, the bow-shock-like structure curves with the apex toward an OB association, LH 38 for N30B (Oey 1996a) and Stock 16 for LSS 3027 (Chu 1983). The relative nebular and stellar positions are highly suggestive that the stellar radiation and winds from the OB association are responsible for the bow-shock-like morphology of the reflection nebula. For N30B, the dynamical interaction is further supported by the small blue-shift, −5 to −10 km s−1, of the ionized gas in the vicinity of
the two HII regions. This flow velocity, −5 to −10 km s−1, is subsonic for 104 K ionized gas
but supersonic for cold neutral gas. Since the reflective envelope of N30B contains dust and mostly neutral gas, flow velocities of 5–10 km s−1 would be supersonic; thus the morphology
of N30B’s halo may indeed be produced by a bow shock.
3.4. Geometry of the Reflection
The nature of N30B’s halo as a reflection nebula is supported by the WFPC2 B, V , and I images in Figure 2. These three broad-band images show similar morphologies among one another, with almost uniform surface brightness across N30B. Hardly any enhancement is seen over the Str¨omgren spheres where bright Hα emission is present, indicating that the contribution of nebular line emission from the H II regions is minimal compared to the scattered stellar continuum and line emission. Therefore, we may use the observed broad-band surface brightness of N30B’s reflection nebula and a few simple assumptions to determine the likely position of N30B relative to the B[e] star Hen S22. First, we assume a single value for the spherical albedo of every dust grain. We also assume that the reflection nebula is optically thick, i.e., every photon from Hen S22 incident upon the reflection nebula is either absorbed or scattered. It has been shown that dust scattering has an angular dependence and follows the phase function Φ(α) = γ(1−g4π2)(1 + g2 −2g cos α)−3/2, where α
is the deviation of the photon from the forward direction, γ is the spherical albedo of the dust grains, and g is a measurement of the asymmetry of the phase function as given by the expression, γg =R Φ(α) cos α dω (Henyey & Greenstein 1941). We have adopted dust grain properties reported by Lillie & Witt (1976) for wavelengths longward of 3000 ˚A, γ = 0.7 and g = 0.60. As shown in Figure 6, the scattering angle α is related to the projected distance d from Hen S22 to the reflection nebula by sin α = 5 pc/d. Using the phase function and the brightness of Hen S22, we can calculate the surface brightness of the reflection nebula expected for a given geometry of the reflection.
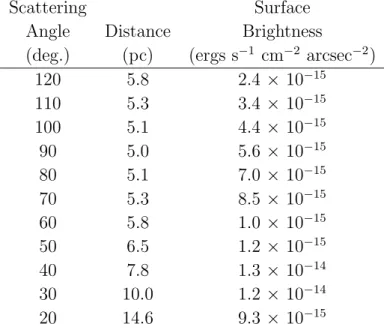
The broad-band photometry of Hen S22 from 1957 to 1991 show stable brightnesses and colors: V = 11.80 ± 0.05 and B − V = +0.28 (Zickgraf et al. 1986, 1996). The reddening of Hen S22, E(B − V ) = 0.25–0.30, is higher than those of the other stars in DEM L 106 because of its edge-on disk (Zickgraf et al. 1986). The broad-band photometry of Hen S22 made by Oey (1996a,b) in 1994 shows a similar V = 11.879 ± 0.004, but a higher E(B − V ) = 0.46. We have adopted an E(B − V ) of 0.25 to deredden the Johnson B magnitude of Hen S22, and converted it to the WFPC2 B (F 439W ) magnitude. We then calculate the expected surface brightness of the reflection nebula in the WFPC2 B band for a range of scattering angles. To compare these predictions to observations, a reddening appropriate for the reflection nebula needs to be applied. As the reflection nebula is on the surface of N30B, its extinction should be no greater than the minimum extinction found among stars in N30B, E(B − V ) ∼ 0.06. We have applied this amount of extinction to the expected surface brightness of the reflection nebula, and the results are presented in Table 3. The maximum expected surface brightness comes at a scattering angle of ∼40◦, which corresponds to a
distance of ∼8 pc between Hen S22 and the reflection nebula. We have measured an average surface brightness of 1.6 × 10⁻¹⁴ ergs s−1 cm−2 arcsec−2 for N30B’s reflection nebula in
the WFPC B band. This observed surface brightness is 20% higher than the maximum expected surface brightness. Considering that our assumptions and calculation are crude, the observed and expected surface brightness of the reflection nebula are in remarkably good agreement. As discussed in §3.5, the reflection nebula is above the equatorial disk and sees a less reddened Hen S22, the expected surface brightness of the reflection nebula is thus higher and would be in even better agreement with the observations. We conclude that the reflection nebula around N30B is consistent with forward scattering by the dust grains, i.e., N30B is on the near side of Hen S22. The most likely position of N30B is ∼8 pc from Hen S22 and the scattering angle α is ∼40◦.
3.5. Periscopic Views of the Polar and Disk Winds of Hen S22
The broad Hα line profiles from the reflection nebula around N30B not only change with position (Figure 7) but also differ from that of Hen S22 (Figure 4). Adopting the most likely geometry of reflection suggested in §3.4, d ∼ 8 pc and α ∼ 40◦, the light travel time
from Hen S22 to us via the reflection nebula is 6 yrs longer than the direct travel time. Thus the spectra of the reflection nebula should be compared to the spectra of Hen S22 taken 6 yrs earlier; unfortunately none are vailable with sufficient resolution.
Spectra of Hen S22 available in the literature were taken from the late 1960’s to early 1980’s. While these observations yield a consistent systemic velocity of Hen S22, 293 ±
3 km s−1 (Zickgraf et al. 1986), different blue-shifts (from the systemic velocity) of the
absorption component in the hydrogen Balmer lines have been reported: −70 km s−1derived
from the H8 to H31 lines observed with a reciprocal dispersion of 20 ˚A mm−1 in the years
1968–1975 (Muratorio 1978), −87 km s−1from the Hα line observed with 38 ˚A mm−1in 1979,
and −40 km s−1 from the Hβ, Hγ, and Hδ lines observed with 20 ˚A mm−1 in 1982 (Zickgraf
et al. 1986). Since these measurements were made for different Balmer lines with different spectral dispersion at different epochs, it is not clear whether the differences in the blue-shifts of the absorption component are caused by atmospheric effects (low and high Balmer lines have different profiles) or temporal variations in the stellar wind. Our echelle observations of Hen S22 were made in 2000 January and December with a reciprocal dispersion of 3.4 ˚A mm−1. These two spectra show almost identical Hα profiles, with the absorption component
detected at 260 km s−1. Relative to a systemic velocity of 293 km s−1, the blue-shift of our
Hα absorption is −33 km s−1. To compare our Hα profiles to that reported by Zickgraf et
al. (1986), we have convolved our spectra with a Gaussian with σ = 32 km s−1, but we find
that the overall Hα profiles do not match that presented in their Figure 5. This mismatch might be caused by an incorrect wavelength scale in their Figure 5, where the displacement of the absorption dip from the systemic velocity appears to be <50 km s−1, significantly less
than what they reported in their text.
From the above comparisons we find no conclusive or convincing evidence to indicate that the Hα line profile of Hen S22 varied. Furthermore, the V magnitude and the B − V color of Hen S22 did not change for more than 0.1 mag from 1957 to 1996 (Zickgraf et al. 1986, 1996; Oey 1996b). Therefore, we cannot attribute the spatial variations of the broad Hα line from the refection nebula to hypothetical temporal variations of the Hα line of Hen S22.
Figure 7 shows smooth spatial variations of the broad Hα profile, especially the ab-sorption component, across N30B, similar to what has been observed in Car II (Boumis et al. 1998). The explanation of this spatial variation is best illustrated by the Homunculus nebula of η Car, as described and analyzed in detail by Smith (2002). The bipolar lobes of the Homunculus are dusty and scatter the incident starlight of η Car; the reflected spectra at higher latitudes show Hα absorption extending to larger blue-shifts. As the Homunculus is smaller than 1 ly in size, temporal variations in the spectrum of η Car are negligible over the differential light travel time; therefore, the latitude-dependence of the Hα absorption in the reflected spectra must indicate an anisotropic stellar wind from η Car. Hen S22 has been shown to possess both a slow disk wind and a fast polar wind (Zickgraf et al. 1986), conse-quently its spectral properties should also be latitude-dependent. Thus, the variations in the absorption component in the reflected Hα emission at N30B must be a result of viewing Hen S22 from different latitudes, too. The reflected spectra on the west side of N30B resemble
better the observed Hα line of Hen S22, while those on the east side show the absorption component extending to larger blue-shifts, almost −100 km s−1 from Hen S22’s systemic
velocity of 293 km s−1. These variations suggest that the east side of N30B views the wind
of Hen S22 from a higher latitude and the west side of N30B is close to the disk plane. The absorption component in the Hα line of a B[e] star arises from the dense, disk component of the wind close to the star, as illustrated in the cartoon in Figure 7 of Zickgraf et al. (1985). The variations of the absorption component in the reflected stellar Hα line emission across N30B thus offer an invaluable opportunity to study the transition from the disk component to the polar component of the stellar wind of a B[e] star. Future high-S/N, high-resolution spectroscopic observations and stellar atmospheric modeling are needed for a better understanding of the stellar wind of the hybrid-spectrum B[e] supergiant Hen S22.
4. Summary
HST WFPC2 Hα images reveal a bow-shock-like halo around the compact HIIregions in N30B on the side that faces the B[e] supergiant Hen S22. Long-slit, high-resolution spectroscopic observations of the Hα line show both narrow and broad emission components in N30B. The narrow component originates from the ionized gas in the H II regions; its velocity variations reveal a gas flow at −5 to −10 km s−1 relative to the H II regions,
indicating dynamic interactions with the stellar wind from Hen S22.
The broad Hα emission component has the same spatial extent as the halo of N30B, but its width (>1000 km s−1) is too high to have been produced dynamically without detectable
X-ray emission. The spectral shape of the broad Hα emission is similar to that of Hen S22, both having a blue-shifted absorption component. We suggest that the halo of N30B is a reflection nebula scattering the stellar emission of Hen S22. HST WFPC2 broad-band images show morphologies consistent with this interpretation. The bow-shock-like morphology is probably indeed formed as a bow shock, as the downstream flow velocity of −5 to −10 km s−1 is supersonic to the neutral gas in the halo of N30B.
Assuming typical properties of interstellar dust, we have modeled the surface brightness of the reflection nebula of N30B for a range of scattering angles. We find that the observed surface brightness of the reflection nebula in the WFPC2 B band is within 20% from that expected from dust-scattering at a distance of ∼8 pc from Hen S22 for a scattering angle of ∼40◦.
The absorption component in the broad Hα emission profile varies across the reflection nebula of N30B as a result of different viewing angles. The west side of N30B lies closer to
the equatorial disk plane of Hen S22, while the east side of N30B is at higher latitudes. We suggest that the anisotropic wind of the B[e] supergiant Hen S22 can be studied by modeling the broad Hα line profile and the blue-shifted absorption component, taking into account the 3-dimensional geometry. This unique opportunity could reveal important insights on the physical conditions and evolution of these enigmatic massive stars.
We thank the anonymous referee for pointing out the existence of monitoring obser-vations of η Car and its reflection nebula Car II. We also thank Nathan Smith and Nolan Walborn for useful discussions, Jayanne English for suggesting DEM L 106 to the Hubble Heritage Project, and Monica Shaw for assistance in initial data analyses. This research was supported by the Hubble Space Telescope grant STI6698.01-95A.
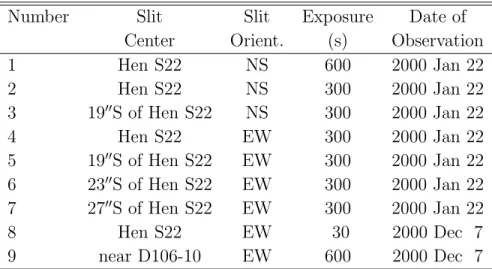
Table 1: Journal of Echelle Observations
Number Slit Slit Exposure Date of
Center Orient. (s) Observation
1 Hen S22 NS 600 2000 Jan 22 2 Hen S22 NS 300 2000 Jan 22 3 19′′S of Hen S22 NS 300 2000 Jan 22 4 Hen S22 EW 300 2000 Jan 22 5 19′′S of Hen S22 EW 300 2000 Jan 22 6 23′′S of Hen S22 EW 300 2000 Jan 22 7 27′′S of Hen S22 EW 300 2000 Jan 22 8 Hen S22 EW 30 2000 Dec 7 9 near D106-10 EW 600 2000 Dec 7
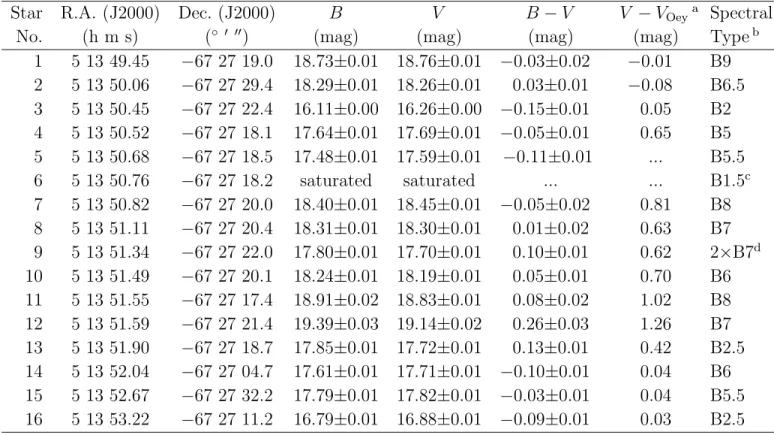
Table 2: Photometric Measurements of Stars in the Vicinity of N30B
Star R.A. (J2000) Dec. (J2000) B V B − V V − VOeya Spectral
No. (h m s) (◦ ′ ′′) (mag) (mag) (mag) (mag) Typeb
1 5 13 49.45 −67 27 19.0 18.73±0.01 18.76±0.01 −0.03±0.02 −0.01 B9 2 5 13 50.06 −67 27 29.4 18.29±0.01 18.26±0.01 0.03±0.01 −0.08 B6.5 3 5 13 50.45 −67 27 22.4 16.11±0.00 16.26±0.00 −0.15±0.01 0.05 B2 4 5 13 50.52 −67 27 18.1 17.64±0.01 17.69±0.01 −0.05±0.01 0.65 B5 5 5 13 50.68 −67 27 18.5 17.48±0.01 17.59±0.01 −0.11±0.01 ... B5.5 6 5 13 50.76 −67 27 18.2 saturated saturated ... ... B1.5c 7 5 13 50.82 −67 27 20.0 18.40±0.01 18.45±0.01 −0.05±0.02 0.81 B8 8 5 13 51.11 −67 27 20.4 18.31±0.01 18.30±0.01 0.01±0.02 0.63 B7 9 5 13 51.34 −67 27 22.0 17.80±0.01 17.70±0.01 0.10±0.01 0.62 2×B7d 10 5 13 51.49 −67 27 20.1 18.24±0.01 18.19±0.01 0.05±0.01 0.70 B6 11 5 13 51.55 −67 27 17.4 18.91±0.02 18.83±0.01 0.08±0.02 1.02 B8 12 5 13 51.59 −67 27 21.4 19.39±0.03 19.14±0.02 0.26±0.03 1.26 B7 13 5 13 51.90 −67 27 18.7 17.85±0.01 17.72±0.01 0.13±0.01 0.42 B2.5 14 5 13 52.04 −67 27 04.7 17.61±0.01 17.71±0.01 −0.10±0.01 0.04 B6 15 5 13 52.67 −67 27 32.2 17.79±0.01 17.82±0.01 −0.03±0.01 0.04 B5.5 16 5 13 53.22 −67 27 11.2 16.79±0.01 16.88±0.01 −0.09±0.01 0.03 B2.5 aV
Oeyis from Oey (1996b).
b
The spectral types are estimated from the color and magnitude of the stars assuming that they are on the main sequence.
c
This star was cataloged as D106-10 and spectroscopically classified as B1.5 V by Oey (1996a).
d
The photometric measurements include two stars of similar brightness. The spectral type is estimated assuming two identical stars.
Table 3: Expected Surface Brightness of the Reflection Nebula around N30B
Scattering Surface
Angle Distance Brightness
(deg.) (pc) (ergs s−1 cm−2 arcsec−2)
120 5.8 2.4 × 10⁻¹⁵ 110 5.3 3.4 × 10⁻¹⁵ 100 5.1 4.4 × 10⁻¹⁵ 90 5.0 5.6 × 10⁻¹⁵ 80 5.1 7.0 × 10⁻¹⁵ 70 5.3 8.5 × 10⁻¹⁵ 60 5.8 1.0 × 10⁻¹⁵ 50 6.5 1.2 × 10⁻¹⁵ 40 7.8 1.3 × 10⁻¹⁴ 30 10.0 1.2 × 10⁻¹⁴ 20 14.6 9.3 × 10⁻¹⁵
REFERENCES
Bensammar, S., Friedjung, M., Muratorio, G., & Viotti, R. 1983, A&A, 126, 427 Boumis, P., Meaburn, J., Bryce, M., & Lopez, J. A. 1998, MNRAS, 294, 61 Casta˜neda, H. O., Vilchez, J. M., & Copetti, M. V. F. 1990, ApJ, 365, 164 Chen, C.-H. R., Chu, Y.-H., Gruendl, R. A., & Points, S. D. 2000, AJ, 119, 1317 Chu, Y.-H. 1983, PASP, 95, 873
Chu, Y.-H., Chang, H.-W., Su, Y.-L., & Mac Low, M.-M. 1995, ApJ, 450, 157 Davies, R. D., Elliott, K. H., & Meaburn, J. 1976, MemRAS, 81, 89
Feast, M. 1999, in IAU Symposium 190, New Views of the Magellanic Clouds, eds. Y.-H. Chu, et al., 542
Henyey, L. C. & Greenstein, J. L. 1941, ApJ, 93, 70 Henize, K. G. 1956, ApJS, 2, 315
Lillie, C. F. & Witt, A. N. 1976, ApJ, 208, 64
Lopez, J. A., & Meaburn, J. 1986, Revista Mexicana de Astronomia y Astrofisica, 13, 27 Lucke, P. B., & Hodge, P. W. 1970, AJ, 75, 171
Muratorio, G. 1978, A&AS, 33, 125 Oey, M. S. 1996a, ApJ, 465, 231 Oey, M. S. 1996b, ApJS, 104, 71 Panagia, N. 1973, AJ, 78, 929
Ruiz, M. T., Melnick, J., & Ortiz, P. 1984, ApJ, 285, L19 Schaerer, D., & de Koter, A. 1997, A&A, 322, 598
Smith, N. 2002, PhD thesis, University of Minnesota
Zickgraf, F.-J., Humphreys, R. M., Lamers, H. J. G. L. M., Smolinski, J., Wolf, B., Stahl, O., 1996, A&A, 315, 510
Zickgraf, F.-J., Wolf, B., Stahl, O., Leitherer, C., & Klare, G. 1985, A&A, 143, 421
Figure Captions
Fig. 1.— (a) CTIO Curtis Schmidt Hα image of DEM L 106. (b) HST WFPC2 Hα image of Hen S22 and N30B. The echelle slit positions centered at 19′′S, 23′′S, and 27′′S of Hen S22
are marked by brackets.
Fig. 2.— HST WFPC2 images of N30B in (a) Hα, (b) [OIII], (c) [SII], (d) B, (e) V , and (f) I. Stars marked in (e) are brighter than V = 20 mag and have photometric measurements given in Table 2.
Fig. 3.— The color-magnitude diagram of V versus B − V for stars in the vicinity of N30B. The identification of the stars are marked in Figure 2e and the photometric measurements are listed in Table 2. The location of the main sequence is plotted for a distance of 50 kpc, or a distance modulus of 18.5 mag. A reddening vector of AV = 1 mag is also plotted.
Fig. 4.— (a) and (b) Echellogram of the Hα and [NII] λ6547 lines for the E-W slit position centered near the star D106-10 (star #6 in Figure 2e) presented in two stretches to show the bright and faint features. (c) Echellogram of the Hα line of Hen S22 observed in 2000 December. (d) Hα line profiles of Hen S22 observed in 2000 January and December. The horizontal axis is heliocentric velocity of the Hα line. See text for more explanations.
Fig. 5.— Position-velocity plots along four echelle slit positions. The radial velocities are heliocentric. The zero point and direction of the position axis are given on the top margin of each plot. The filled symbols are Hα measurements and open symbols [NII] measurements. The FWHMs of the Hα line are plotted as error bars. The E-W slit position centered at 19′′
south of Hen S22 is almost coincident with that centered near D106-10, so their measurements are plotted in the same panel with the former plotted in squares and the latter in triangles.
Fig. 6.— Geometry of the reflection.
Fig. 7.— Hα echellogram and line profiles of N30B along an E-W slit centered near the star D106-10 in N30B-W. The Hα line profiles are extracted from apertures p1, p2, p3, and p4 marked in the top panel. The horizontal axis is in heliocentric velocity of the Hα line. The narrow lines at VHel = −3 and +660 km s−1 are telluric Hα and OH lines, respectively.