HAL Id: hal-02169193
https://hal.archives-ouvertes.fr/hal-02169193
Submitted on 30 Jun 2019
HAL is a multi-disciplinary open access
archive for the deposit and dissemination of
sci-entific research documents, whether they are
pub-lished or not. The documents may come from
teaching and research institutions in France or
abroad, or from public or private research centers.
L’archive ouverte pluridisciplinaire HAL, est
destinée au dépôt et à la diffusion de documents
scientifiques de niveau recherche, publiés ou non,
émanant des établissements d’enseignement et de
recherche français ou étrangers, des laboratoires
publics ou privés.
Tyrrhenian Sea variability
Milena Menna, Pierre-Marie Poulain, Daniele Ciani, Andrea M. Doglioli,
Giulio Notarstefano, Riccardo Gerin, Marie-Hélène Rio, Rosalia Santoleri,
Adam Gauci, Aldo Drago
To cite this version:
Milena Menna, Pierre-Marie Poulain, Daniele Ciani, Andrea M. Doglioli, Giulio Notarstefano, et al..
New insights of the Sicily Channel and southern Tyrrhenian Sea variability. Water, MDPI, 2019, 11
(7), pp.1355. �10.3390/w11071355�. �hal-02169193�
Notarstefano, Giulio and Gerin, Riccardo and Rio, Marie-Helene and Santoleri, Rosalia and Gauci,
Adam and Drago, Aldo
TITLE = New Insights of the Sicily Channel and Southern Tyrrhenian Sea Variability
JOURNAL = Water
VOLUME = 11
YEAR = 2019
NUMBER = 7
ARTICLE-NUMBER = 1355
DOI = 10.3390/w11071355
ISSN = 2073-4441
URL = https://www.mdpi.com/2073-4441/11/7/1355
ABSTRACT = The dynamics of the Sicily Channel and the southern Tyrrhenian Sea are highly
influenced by the seasonal variability of the Mediterranean basin-wide circulation, by the
interannual variability of the numerous mesoscale structures present in the Channel, and by the
decadal variability of the adjacent Ionian Sea. In the present study, all these aspects are investigated
using in-situ (Lagrangian drifter trajectories and Argo float profiles) and satellite data (Absolute
Dynamic Topography, Sea Level Anomaly, Sea Surface Temperature, wind products) over the
period from 1993 to 2018. The availability of long time series of data and high-resolution
multi-sensor surface currents allow us to add new details on the circulation features and on their driving
mechanisms and to detect new permanent eddies not yet described in literature. The structures
prevailing in winter are mainly driven by wind, whereas those prevailing in summer are regulated
by topographical forcing on surface currents. The strength of the surface structures located at the
western entrance of the Ionian Sea and of the mesoscale activity along the northern Sicily coast is
modulated by the large-scale internal variability. The vertical hydrological characteristics of these
mesoscale eddies are delineated using the Argo float profiles inside these structures
Water 2019, 11, x; doi: FOR PEER REVIEW www.mdpi.com/journal/water Article
1
New insights of the Sicily Channel and southern
2
Tyrrhenian Sea variability
3
Milena Menna1, Pierre-Marie Poulain1,2, Daniele Ciani3, Andrea Doglioli4, Giulio Notarstefano1,
4
Riccardo Gerin1, Marie-Helene Rio5, Rosalia Santoleri3, Adam Gauci6, Aldo Drago6
5
1 Istituto nazionale di Oceanografia e Geofisica Sperimentale, OGS, Sgonico (TS), Italy; mmenna@inogs.it,
6
rgerin@inogs.it, gnotarstefano@inogs.it
7
2 Centre for Marine Research and Experimentation, CMRE, La Spezia, Italy;
Pierre-8
Marie.Poulain@cmre.nato.int
9
3 Consiglio Nazionale delle Ricerche, Istituto di Scienze Marine, CNR-ISMAR, Via del Fosso del Cavaliere,
10
100, 00133, Rome, Italy; daniele.ciani@cnr.it, rosalia.santoleri@cnr.it
11
4 Mediterranean Institute of Oceanography, MIO, Marseilles, France; andrea.doglioli@univ-amu.fr
12
5 European Space Research Institute, ESA-ESRIN, Frascati, Italy; Marie-Helene.RIO@esa.int
13
6 Physical Oceanography Research Group, Department of Geosciences, University of Malta, Malta;
14
adam.gauci@um.edu.mt, aldo.drago@um.edu.mt
15
16
* Correspondence: mmenna@inogs.it; Tel.: +39 0402140302
17
Received: date; Accepted: date; Published: date
18
Abstract: The dynamics of the Sicily Channel and southern Tyrrhenian Sea is highly influenced by
19
the seasonal variability of the Mediterranean basin-wide circulation, by the interannual variability
20
of the numerous mesoscale structures present in the Channel, and by the decadal variability of the
21
adjacent Ionian Sea. In the present study, all these aspects are investigated using in-situ (Lagrangian
22
drifter trajectories and Argo float profiles) and satellite data (Absolute Dynamic Topography, Sea
23
Level Anomaly, Sea Surface Temperature, wind products) over the period 1993-2018. The
24
availability of long time series of data and high resolution multi-sensor surface currents, allow us to
25
add new details on the circulation features and on their driving mechanisms and to detect new
26
permanent eddies not yet described in literature. The structures prevailing in winter are mainly
27
driven by wind, whereas those prevailing in summer are regulated by topographical forcing on
28
surface currents. The strength of the surface structures located at the western entrance of the Ionian
29
Sea and of the mesoscale activity along the northern Sicily coast is modulated by the large–scale
30
internal variability. The vertical hydrological characteristics of these mesoscale eddies are
31
delineated using the Argo float profiles inside these structures.
32
Keywords: Sicily Channel; spatial and temporal variability; mesoscale eddies
33
34
1. Introduction
35
Thanks to its location in the centre of the Mediterranean Basin, the Sicily Channel (SC) plays a crucial
36
role in connecting the western and eastern Mediterranean basins and modulating their exchange of
37
the surface and intermediate waters [1,2]. The SC is characterised by a complex bottom topography,
38
with submarine ridge and shallow banks, and it is delimited to the north by the Tyrrhenian Sea and
39
the Sicily coast, to the south by the Libyan coast, to the west by the Tunisia coast and to the east by
40
the Ionian Sea (Figure 1a). Its circulation can be schematized on the vertical as a two-layer exchange
41
with an eastward flow of Atlantic Water (AW) superposed to a westward flow of intermediate water,
42
dominated by the Levantine Intermediate Water (LIW) [3]. Microstructure measurements taken in
43
the SC show that it is a hotspot for turbulent mixing [4,5]. Consequently, the SC is a key area for the
regulation of salt exchanges between Eastern and Western basins, with an impact on the deep-water
45
formation processes [6].
46
Circulation in the upper layer of the SC and in the southern Tyrrhenian Sea is mainly dictated by the
47
large-scale Mediterranean thermohaline circulation, the wind-driven currents along the shelf, the
48
upwelling events off Sicily, the sub-basin scale and mesoscale permanent and quasi-permanent
49
structures [1,3,7,8,9]. The recent results of AW circulation schemes, derived by numerical model
50
simulation [1,3], are summarized in Figure 1b (both permanent and seasonal circulation structures
51
are depicted with the same colour in Figure 1b; more details on the time scales and variability of these
52
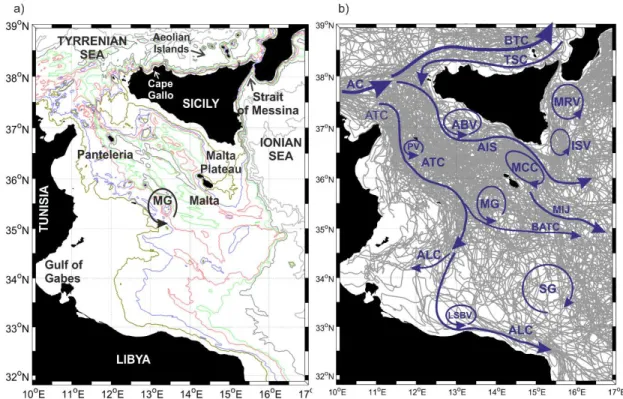
structures are available in Section 3; acronyms are defined in Table1). The sub-basin scale structures
53
are characterised by a prominent seasonal variability [9-12] associated with large wind stress
54
fluctuations [13]. The numerous mesoscale structures located in the SC are mainly driven by the
55
instability of the large scale circulation, by the the interactions between currents and bathymetry and
56
by the direct wind forcing [1].
57
58
Figure 1. (a) Bathymetry of the SC (100 m, 200 m, 400 m, 600 m, 1000 m, 2000 m isobaths) and
59
geographical references. (b) Low-pass filtered drifter trajectories in the SC between 1993 and 2018
60
superimposed with the schematic surface circulation adapted from [1] and [3]; acronyms are listed in
61
Table 1.
62
Nowadays, the availability of long time series of in-situ and satellite data and of sophisticated
63
statistical techniques, allow us to add new details on the mesoscale features and on their driving
64
mechanisms. In this study, Lagrangian drifter trajectories, Argo float profiles and satellite data
65
(Absolute Dynamic Topography, Sea Level Anomaly, Sea Surface Temperature, wind products) are
66
used to describe the surface circulation of the SC and the southern Tyrrhenian Sea over the period
67
1993-2018. The simultaneous use of all these datasets leads to overcome the intrinsic limitations of
68
each of them, e.g. the accurate but discontinuous spatial and temporal drifter sampling and the low
69
accuracy of altimetry gridded data in the identification of the mesoscale field [14]. Moreover, the
70
knowledge of the mesoscale field is ameliorated using the multi-sensor currents (defined hereafter as
71
‘optimal currents’) derived from the merging of the satellite altimetry data and the Sea Surface
72
Temperature (SST) fields [15]. This product enables to improve the description of eddy dynamics and
non geostrophic dynamical features [15]. The vertical structures and the hydrological characteristics
74
of the mesoscale eddies are delineated using the Argo float profiles inside these structures. All these
75
data and products enhance the knowledge on the temporal variability of the mesoscale structures,
76
with detection of new features not yet described in the literature, and the addition of new insights on
77
the formation mechanisms of these structures.
78
2. Materials and Methods
79
The datasets used for this study are:
80
The OGS Mediterranean drifter dataset in the SC and Southern Tyrrhenian Sea,
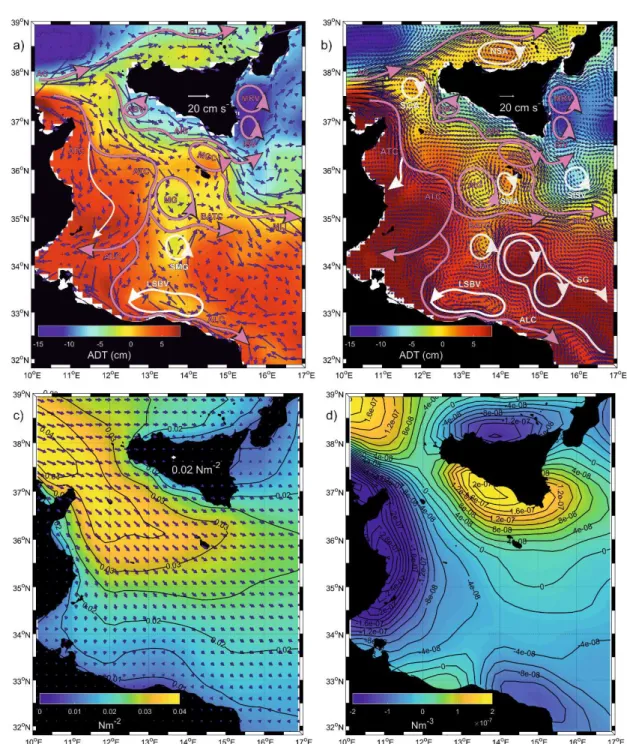
81
composed of 377 drifter tracks collected between 1993 and 2018 (Figure 1b). Drifter data
82
were retrieved from the OGS own projects, but also from databases collected by other
83
research institutions and by international data centres (Global Drifter Program, SOCIB,
84
CORIOLIS, MIO, etc.). These data were cleaned from potential outliers and elaborated
85
with standard procedures (editing, manual editing and interpolation; [16,17]). In
86
particular, we use the low-pass filtered and interpolated (6 hours) drifter tracks which
87
represent the near-surface currents between 0 m and 15 m depth.
88
The daily (1/8º Mercator projection grid) Absolute Dynamic Topography (ADT) and
89
correspondent Absolute Geostrophic Velocities (AGV) derived from altimeter and
90
distributed by CMEMS in the period 1993-2018 (product user manual
CMEMS-SL-91
QUID_008-032-051). The ADT was obtained by the sum of the sea level anomaly and a
92
20-years synthetic mean estimated by [18] over the 1993-2012 period.
93
The Argo float vertical profiles of temperature and salinity from the upper 2000 m of the
94
water column and the horizontal currents displacements at the parking depth. In the
95
Mediterranean Sea, the Argo floats are generally programmed to execute 5-day cycles
96
with a drifting depth of 350 m (parking depth). Additionally, they alternate the profiling
97
depth between 700 m and 2000 m (see the MedArgo program in [19]). When a float drifts
98
in a shallow area and touches the ground, it can increase its buoyancy to get away from
99
bottom, or can stay there until it is time to ascent (depending on how it is programmed).
100
Information about grounding events is contained in the Argo float trajectory file. Among
101
all the data available in the Mediterranean Sea, we selected of the part of the Argo floats
102
trajectories which correspond to a float entrapped in the mesoscale structures of the SC
103
and southern Tyrrhenian Sea. These data were used to define the vertical hydrographic
104
peculiarities of the mesoscale features. Details about the missions of the seven floats
105
selected for this work are listed in Table 2.
106
The optimal currents, estimated by [15] and presently available in the period 2012-2016.
107
This product was used to confirm the occurrence of the mesoscale structure derived from
108
altimetry and to estimate their interannual variability. Indeed, the optimal currents are
109
based on the synergy of the daily 1/8° Copernicus CMEMS altimeter-derived geostrophic
110
velocities (data ID: SEALEVEL_MED_PHY_L4_REP_OBSERVATIONS_008_051) and
111
the daily 1/24° CMEMS sea-surface temperatures for the Mediterranean Sea (data ID:
112
SST_MED_SST_L4_REP_OBSERVATIONS_010_021). The optimal reconstruction
113
method is based on the inversion of the ocean heat conservation equation in the mixed
114
layer [15]. The principles of the optimal currents are thoroughly described in [15,20,21].
115
Such method takes advantage of the high-resolution spatial temporal gradients of the
116
satellite-derived SST to improve the temporal (1 day) and spatial (1/24°) resolution of the
117
altimeter derived geostrophic currents at the basin scale. The reconstruction method of
118
the optimal currents yielded positive improvements for both the components of the
119
motion in the SC [15].
The Cross-Calibrated, Multi-Platform (CCMP) V2.0 ocean surface wind velocity which
121
were downloaded from the NASA Physical Oceanography DAAC for the period July
122
1993 – May 2016 [22]. These products were created using a variational analysis method
123
to combine wind measurements derived from several satellite scatterometers and
micro-124
wave radiometers. The temporal resolution of the CCMP product is six hours, the spatial
125
resolution is 25 km (level 3.0, first-look version 1.1).
126
Drifter velocities were divided in bins of 0.25°x0.25° and pseudo-Eulerian statistics were computed
127
over the period 1993-2018 and qualitatively compared with the ADT derived from altimetry. The
128
mean current field was also estimated in the period 2012-2016 using the optimal currents. The
129
seasonal variability of the drifter, altimetry and optimal currents fields was estimated by dividing the
130
dataset in two extended seasons: the extended summer corresponding to May-October, and the
131
extended winter to November-April, as suggested by [9].
132
The CCMP six-hourly gridded analyses were used to quantify the wind stress and the vertical
133
component of the wind stress curl [curl τ]z over the study area:
134
;
,
,
10 y x y x D w w zcurl
C u v U
x
y
(1)135
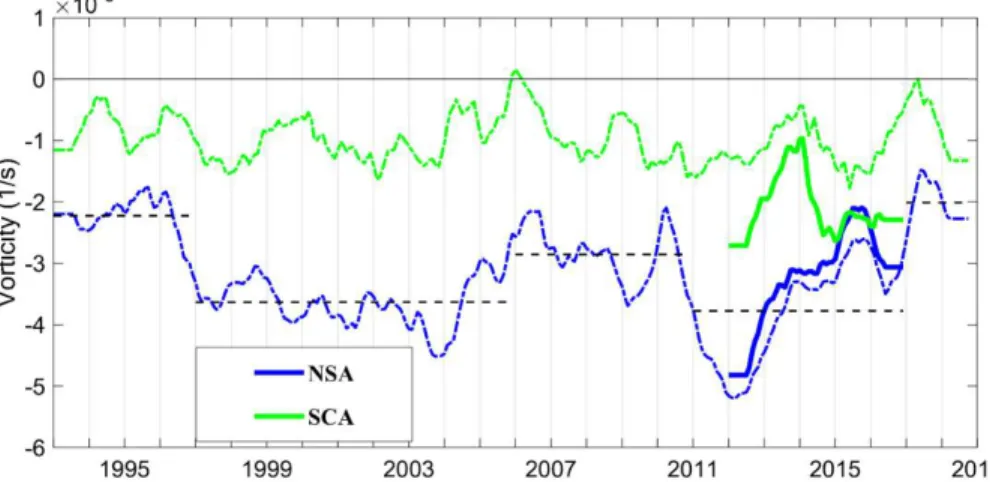
where (τx,τy) are the wind stress components, ρ (1.22 Kg/m3) is the density of air, (uw,vw) and U10 are
136
the components and the magnitude of the wind speed at 10 meters, respectively, and CD is the drag
137
coefficient already used in the Mediterranean Sea by [23,24]:
138
3 10 D C 10 3 m U s
139
3 2 10 10 3.1 7.7 (0.29 ) 10 D C U U 3 10 6 m U m s s
(2)
140
3 10 (0.6 0.07 ) 10 D C U 10 6m U 26m s s
141
Wind stress and wind stress vorticity fields were used to speculate on the link between the wind
142
variations and the seasonal and/or interannual variability of mesoscale structures.
143
Monthly means of the AGV and optimal currents fields were used to estimate the relative vorticity
144
(𝜻), defined as the vertical component of the velocity field curl:
145
𝜻 =𝝏𝑽 𝝏𝒙− 𝝏𝑼 𝝏𝒚; (3)146
where U and V are the velocity components. The resulting current vorticity fields were spatially
147
averaged in the regions of the main mesoscale structures listed in Table 1 and filtered (13-month
148
moving average) in order to remove the seasonal and intra-annual variations.
149
3. Results
150
3.1 Mean currents and wind fields
151
The qualitative comparison between the ADT and drifter data shows that the two datasets fit rather
152
well (Figure 2a), and allow us to update the pseudo-Eulerian current maps described in [9] and
153
enhancing the schematic circulation maps published by [1] and [3] and summarized in Figure 1b. The
154
averages were made over different periods in accordance with the availability of data: 1993-2018 for
the drifter and altimetry data (Figure 2a), 2012-2016 for the optimal currents (Figure 2b) and
1993-156
2016 for the wind (Figures 2c, 2d). The time periods are rather long and the statistics rather robust to
157
consider the average in Figure 2a comparable with those in Figures 2c and 2d and representative of
158
the mean conditions in the SC. The optimal currents are available over a reduced period, and are
159
therefore not directly compared with the other datasets. They are rather used to bring out some
160
aspects of the current field that are not obvious using only drifters and altimetry data. The structures
161
emphasized in white in Figures 2a and 2b, are here described for the first time or with different shapes
162
and positions with respect to those schematized in Figure 1b.
163
Table 1. List of acronyms used in this paper
164
Geographical names
SC Sicily Channel
Water masses
AW Atlantic Water
LIW Levantine Intermediate Water Currents
AC Algerian Current
AIS Atlantic Ionian Stream
ALC Atlantic Libyan Current ATC Atlantic Tunisian Current
MIJ Mid-Ionian Jet
BTC Bifurcation Tyrrhenian Current BATC Bifurcation Atlantic Tunisian Current TSC Tyrrhenian Sicilian Current
Gyres and eddies
ABV Adventure Bank Vortex
ISV Ionian Shelf break Vortex LSBV Libyan Shelf Break Vortex
MG Medina Gyre
MCC Maltese Channel Crest
MRV Messina Rice Vortex
NSA Northern Sicily Anticyclone
PV Pantelleria Vortex
SCA Sicily Channel Anticyclone
SG Sidra Gyre
SISV Southern Ionian Shelf break Vortex
SMG Southern Medina Gyre
SMA Southern Maltese Anticyclone Physical properties
ADT Absolute Dynamic Topography AGV Absolute Geostrophic Velocities
The Atlantic Tunisian Current (ATC) originates from the branch of the Algerian Current (AC) that
165
enters in the SC and flows southward between Pantelleria Island and the Tunisian coast [9]. It shows
166
a complex pattern only partially described by the previous model studies. Indeed, the ATC splits in
167
two branches at about 36.5°N (Figure 2a): one branch continues to move southward along the
168
Tunisian coast (shown in white color), whereas another branch moves eastward south of Pantelleria
169
Island. At about 35.5°N and 13°E the ATC splits another time: a part of the current forms the
170
Bifurcation Atlantic Tunisian Current (BATC), the other part turns southward towards the Libyan
171
coast at ~ 13°E. The latter branch describes the Atlantic Libyan Current (ALC; [1,3]), that move
172
westward towards the Gulf of Gabes and eastward along the Libyan coast (Figures 1b, 2a).
173
Drifter and altimetry data confirm the well known meandering pattern of the Atlantic Ionian Stream
174
(AIS) and outline the edge of the Maltese Channel Crest (MCC) located on the Maltese Plateau. The
175
Medina Gyre (MG) is located on the west and/or southwest side of the Malta Island in agreement
176
with the scheme of [3]. The region where the ATC splits and forms the BATC is characterized by a
177
sudden reduction of depth due to the shelf extension (see the location of MG in Figure 1a) that
178
probably facilitates the cyclonic rotation of the surface currents around 35°-36°N and 13°-14.5°E. It is
179
interesting to note that [1] located the MG in a different position southeast of Malta (see Figure 2 of
180
[1]). South of the MG, altimetry and drifter data detect another permanent cyclonic mesoscale
181
structure that has never been described before in the literature; hereafter we will refer to this structure
182
as the Southern Medina Gyre (SMG) (emphasized in white Figure 2a). The Libyan Shelf Break Vortex
183
(LSBV) is well described only by altimetry data (Figure 2a) because of a scarce quantity of drifter
184
tracks along the Libyan coast; this structure appears meridionally elongated and squeezed along the
185
Libyan coast, showing a different shape and location with respect to [1].
186
The higher spatial resolution of the mean circulation derived by optimal currents (2012-2016; Figure
187
2b) permits a more detailed description of the mesoscale structure of the SC and the southern
188
Tyrrhenian Sea. The anticyclonic structure, clearly visible along the northern coast of Sicily and
189
located between the Aeolian Islands and Cape Gallo (38.1-38.5°N; 13.5-15°E), was observed by [25] in
190
September 2012 but it was not described by these authors; hereafter it will be defined as the Northern
191
Sicily Anticyclone (NSA). Another mesoscale anticyclone is located at the entrance of the SC
(37.5-192
38°N; 11.5-12°E) and represents a kind of watershed between the waters entering the Tyrrhenian Sea
193
(Bifurcation Tyrrhenian Current – BTC) and those entering the SC; hereafter we will define it as the
194
Sicily Channel Anticyclone (SCA). A third mesoscale anticyclone is squeezed between the MG and
195
Malta Island (35.5°-36° N; 14°-14.5° E) and we will define it hereafter as the Southern Maltese
196
Anticyclone (SMA). Similarly, southeast of the Ionian Shelf break Vortex (ISV), there is another steady
197
cyclonic structure hereafter defined as the Southern Ionian Shelf break Vortex (SISV). In addition, the
198
optimal currents reveal new information on the shape of the Sidra Gyre (SG), which appears as a
199
large anticyclone that involves two smaller anticyclonic structures (Figure 2b), and confirms the
200
existence of the SMG (Figure 2b). The cyclonic circulation in the region of the Adventure Bank Vortex
201
(ABV; 37-37.5°N; 12-13°E) is detected by the three datasets (drifter, altimetry and optimal currents)
202
but the vortex is not well resolved by any of them; it appears more like a cyclonic meander rather
203
than a vortex (Figure 2, upper panels).
204
In the study area the mean wind stress is oriented to the east in the southern Tyrrhenian Sea and to
205
the southeast in the SC (Figure 2c) with amplitude (range of values between 0 and 0.04 Nm-2) and
206
directions in agreement with the results of [12]. The regions mostly impacted by the wind stress are
207
located in the band north of 35°N and south of the southern Sicily coast (Figure 2c). The rotating
208
motion induced by the wind (wind stress curl Figure 2d) is cyclonic (positive) along the southern and
209
eastern Sicily coasts and on the Malta plateau, whereas it is anticyclonic (negative) along the Tunisia
210
coast and in the southern Tyrrhenian Sea (along the northern Sicily coast). We can speculate that the
211
wind field plays an important role in shaping the sub-basin circulation (e.g. the branch of the ATC
212
that moves southward along the Tunisia coast) and in defining the sense of rotation of the mesoscale
structures located around the Sicily coast (e.g. the ABV, the Messina Rise Vortex -MRV, the ISV and
214
the NSA).215
216
217
Figure 2. Mean drifter currents (a) in spatial bins of 0.25°x0.25° (blue vectors) superimposed on mean
218
maps of absolute dynamic topography (colours) during the period 1993-2018; mean optimal currents
219
(b) in spatial bins of 1/12° (vectors; one vector every two grid point is plotted) superimposed on mean
220
maps of absolute dynamic topography (colours) during the period 2012-2016. The structures
221
emphasized with white arrows in panels (a) and (b) are new or with different shapes and positions
222
with respect to those described in Figure 1b; the structures already known are highlighted with pink
223
arrows. (c) Mean map of the wind stress amplitude (colours) and direction (vectors) and (d) wind
224
stress curl over the period 1993-2016.
3.2 Seasonal variability of currents and wind fields
226
The seasonal variability of the drifter-derived and optimal current fields is shown in Figure 3 together
227
with the altimetry data. Results substantially confirm the paths described in [9], but add new insights.
228
The BTC is a permanent feature as shown by [1], and it is stronger in winter (Figures 3b and 3d;
229
winter speeds larger than 20 cm/s; mean summer speeds of ~ 10 cm/s), whereas the NSA is much
230
more intense in summer (Figures 3a and 3c; mean winter speeds of ~ 5 cm/s; mean summer speeds of
231
~ 10 cm/s). Along the northern coast of Sicily the drifter data describe a westward current during
232
summer, with the consequent inflow of surface water in the SC (Figure 3a), whereas the coastal
233
currents moves eastward during winter (Figure 3b). This summer westward current (mean speeds of
234
~ 10 cm/s) was already described in [3] and defined as the Tyrrhenian Sicilian Current (TSC). The TSC
235
is not identified by the optimal currents (Figures 3c and 3d).
236
The ATC is part of the permanent pattern of the SC, in agreement with [3] and it is more intense and
237
more meandering in nature during the extended winter (Figures 3b, 3d; maxima winter speeds of ~
238
30 cm/s; maxiama summer speeds of ~ 20 cm/s); it is interesting to note that [1] described it as a winter
239
structure. The cyclonic Pantelleria Vortex (PV) is observed only during the extended winter (Figures
240
3b, 3d; speeds of 10-15 cm/s), in agreement with the optimal currents and with [3] and in
241
disagreement with [1], that describe this as part of the permanent pattern. The MCC is stronger
242
during the extended summer (speeds larger than 15 cm/s), as well as the AIS (Figures 3a, 3c; mean
243
winter speed of ~ 5 cm/s; mean summer speeds of ~ 15 cm/s). The SG is stronger and larger in size
244
during summer (Figures 3a and 3c; mean winter speeds of ~ 7 cm/s; mean summer speeds of ~ 12
245
cm/s; winter longitudinal extension of ~ 100 km; summer longitudinal extendion larger than 250 km),
246
in agreement with the results of [26] that report the SG seasonal expansion in summer and contraction
247
in winter. The ISV and the MRV are permanent structures, in agreement with [1], and they are
248
stronger in winter (Figures 3b, 3d; mean winer speeds of ~ 9 cm/s; mean summer speeds of ~ 6 cm/s);
249
also the SISV is a permanent structure more intense in winter, according to the optimal currents
250
(Figures 3d; mean winer speeds of ~ 10 cm/s; mean summer speeds of ~ 5 cm/s). The BATC is
251
predominant during winter south of the MG (Figures 3b and 3d; maxima winer speeds of ~ 20 cm/s;
252
maxima summer speeds of ~ 10 cm/s), in agreement with [1]. The ALC is stronger in winter (Figures
253
3b and 3d; speeds larger than 15 cm/s), whereas the LSBV is stronger in summer (Figures 3a, 3c;
254
speeds larger than 25 cm/s).
255
The wind stress and the wind stress curl are more intense in winter (Figure 4) influencing the seasonal
256
variability of some sub-basin currents such as the BTC, the ALC, the BATC; the winter intensification
257
of the BATC and its interaction with the topography lead to an intensification of the MG. The wind
258
stress does not impact the circulation structures which are more intense in summer (MCC, AIS, NSA,
259
SG), when the wind stress and the wind stress curl are weakened. The seasonal variability of these
260
structures is presumably related to other forcings such as the instability of the surface currents and
261
the interaction with the topography. The behaviour of the AIS and of the MCC confirms this insight:
262
the AIS is stronger in summer (Figure 3a), when the wind stress is weaker (Figure 4a) and its meander
263
on the Malta Plateau (the MCC) is anticyclonic, although the vorticity induced by the wind in this
264
region is substantially cyclonic (Figure 4c). Along the northern coast of the Sicily, the amplitude of
265
the wind stress and the anticyclonic vorticity induced by the wind are stronger in winter (Figure 4),
266
whereas the strengthening of the NSA is observed in summer (Figures 3a and 3c). This result suggests
267
that the wind influences the sense of rotation of the surface circulation in the NSA, but other forcings
268
modulate the strength of the seasonal and interannual variability of this circulation structure. The
269
summer intensification of the LSBV appears to be instead related to the intensification of the cyclonic
270
wind stress curl along the western Libyan coast (Figure 4c). The SG shows a pronounced longitudinal
271
extension in summer (Figure 3a), when the wind stress is weaker but the vorticity induced by the
272
wind is essentially anticyclonic in the southeastern region of the SC (Figure 4a); its southern margin
273
is oriented parallel to the Libyan coast following the 400 m isobath.
275
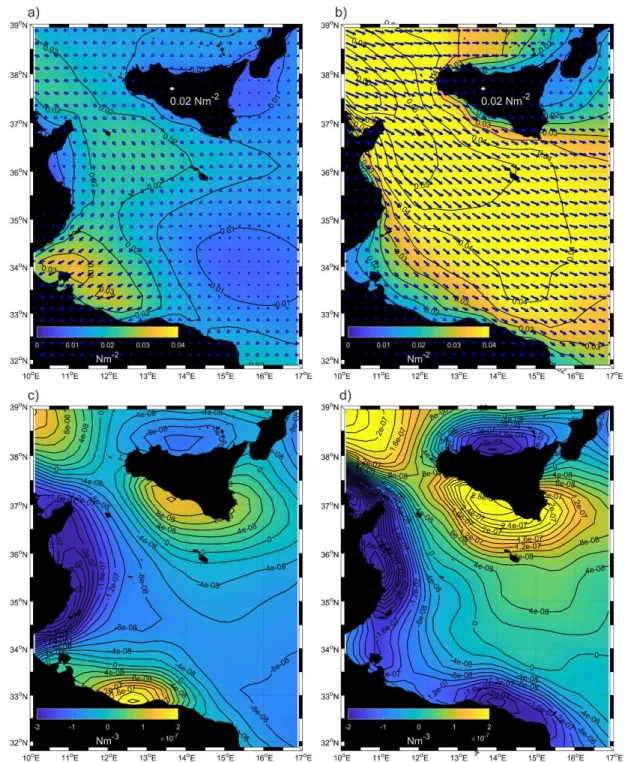
Figure 3. Pseudo-Eulerian drifter statistics (blue vectors) superimposed on mean maps of the absolute
276
dynamic topography (colours) for the (a) extended summer and (b) extended winter. The schematic
277
circulation structures superimposed on the currents field are coloured with red arrows (a) when they are
278
most intense in summer and with light blue arrows (b) when they are most intense in winter. Mean optimal
279
currents in spatial bins of 1/12° (blue vectors: one vector every two grid point is plotted) superimposed on
280
mean maps of absolute dynamic topography (colours) during the period 2012-2016 for the (c) extended
281
summer and (d) extended winter.
283
Figure 4.Mean map of the wind stress (upper panels) amplitude (colours) and direction (vectors) and (d) wind
284
stress curl (lower panels) over the extended summer (a, c) and extended winter (b, d).
285
3.3 Decadal variations
286
Decadal variations are emphasized by removing the mean ADT and AGV (1993-2018) fields from the
287
interannual composite mean over the time periods characterised by the anticyclonic (1993-1996, 2006
288
– 2010 and 2016-2017) and cyclonic (1997-2005 and 2011 – 2016) circulation modes in the northern
289
Ionian (Figure 5). In the region located between Pantelleria and Malta islands (35.5°N-37°N,
11°E-290
15°E), the surface currents are samller than the mean field during the anticyclonic mode (Figure 5a;
291
current anomalies are oriented in an opposite direction with respect to the mean field) and larger
during the cyclonic mode (Figure 5b). Along the northern coast of the Sicily, the NSA is reduced in
293
intensities with respect to the mean field during the anticyclonic mode (Figure 5a; the current
294
anomalies are oriented ciclonically) and increased during the cyclonic mode.
295
The largest variations are observed east of 15°E, in agreement with the results of [24]. The MRV and
296
the SISV are less intense than the mean currents during the anticyclonic mode (Figure 5a) and slightly
297
more intense during the cyclonic mode (Figure 5b). The AIS tends to be deflected towards the
298
northern Ionian during the anticyclonic circulation mode (northeastward currents along the Sicily
299
eastern coast) and the MIJ is reduced in intensity with respect to the mean currents (Figure 5a).
300
During the cyclonic circulation mode the AIS feeds the MIJ, that shows larger intensities with respect
301
to the mean, and the currents are mainly directed southwestward along the western coasts of the
302
Ionian Sea (Figure 5b).
303
304
Figure 5.Mean maps of absolute geostrophic velocity anomalies (vectors) superimposed to the absolute dynamic
305
topography anomalies (colours) during a) anticyclonic (1993-1996, 2006-2010, 2017-2018) and b) cyclonic
(1997-306
2005 and 2011-2016) circulation modes in the northern Ionian.
307
3.4 Interannual variability and vertical structure of the quasi-permanent mesoscale eddies in the Sicily Channel
308
and southern Tyrrhenian Sea
309
The main quasi-permanent mesoscale eddies of the SC and southern Tyrrhenian are analysed in term
310
of their interannual variability, using the time series of spatially averaged vorticity fields derived
311
both from altimetry and optimal currents data. In the period in which the optimal currents are
312
available the accuracy of the vorticity derived by the AGV is generally improved, showing larger
313
complexity in the temporal variability of the signal (see Figures 6, 8, 11). The thermohaline properties
314
and the vertical extension in the water column of these mesoscale eddies is studied using the Argo
315
float profiles.
316
3.4.1 Southern Tyrrhenian Sea and Sicily Channel entrance
317
The analysis of the vorticity field in the areas of the NSA (38.1-38.5°N; 13.5-15°E) and SCA (37.5-38°N;
318
11.5-12°E) confirms that the anticyclonic nature of these regions persists with time (Figure 6). A more
accurate analysis of the temporal evolution of the vorticity in the NSA shows quasi-decadal variations
320
of the intensity of the vorticity field that coincide with the inversions of the surface circulation in the
321
northern Ionian. The black dashed lines in Figure 6 give an indication of the mean vorticity values
322
during each anticyclonic/cyclonic circulation mode. The anticyclonic vorticity of the NSA is reduced
323
during the anticyclonic circulation modes of the northern Ionian (1993-1996, 2006-2010, 2017-2018),
324
whereas it is enhanced during the cyclonic circulation modes (1997-2005, 2011-2016). This result
325
supports the relationship suggested by [27] between the large–scale interior ocean variability in the
326
central Mediterranean Sea and the local dynamics. More specifically, these authors suggest a link
327
between the inversions of the surface circulation in the northern Ionian and the local tidal
328
observations in the area of the Strait of Messina. The present work shows that not only the Strait of
329
Messina, but all the coastal area adjacent to the northern Sicily coast, can be influenced by the
330
variability attributed to the large scale dynamics of the central Mediterranean.
331
332
Figure 6.Time series of the spatially averaged, low pass filtered (13-months) vorticity field over the regions of
333
the NSA and SCA. Dashed-dotted lines are referred to the vorticity field derived from the AGV; Continuous
334
lines are related to the vorticity field derived from optimal currents in 2012-2016. Dashed black lines show the
335
average values of the vorticity over each anticyclonic/cyclonic period of the Northern Ionian Gyre.
336
The vertical structure of the NSA is defined by the profiles of the float WMO 6900981 that circulates
337
on the border of the NSA between late April 2012 and early January 2013 (Figures 7a and 7b). This
338
float shows that the NSA extends about 50 m in depth and confirms its anticyclonic nature with a
339
reduction of density and the deepening of the isopycnal surfaces, in particular between the end of
340
June 2012 and November 2012 when the float profiles were close to the core of the eddy. The trajectory
341
of the float WMO 6900981 gives an indication of the intermediate current displacements at the
342
parking depth (350 m; see Table 2). It is interesting to note that the intermediate currents in the region
343
of the NSA, during the period covered by the float WMO 6900981, flow in an opposite direction
344
(cyclonic displacements; Figure 7a) with respect to the mean surface currents (Figure 2b). The
345
diagram in Figure 7b shows a gap of the float profiles between 1 September 2012 and 20 October 2012.
346
Despite this gap, the float remains confined to the eastern part of the NSA, from which it moves away
347
only in December 2012. Unfortunately, we have no floats entrapped in the SCA.
349
Figure 7.Map of the trajectory (black line) and profile positions (first profile: magenta dot; other profiles: black
350
dots) of the float WMO 6900981 superimposed on the mean map of the ADT (between 18-Apr-2012 and
3-Jan-351
2013) (a), and contour diagram of the potential density versus depth and time (b).
352
3.4.2 Malta plateau
353
The surface circulation in the region of the Malta Plateau is strongly influenced by the flow of the AIS
354
that forms a large anticyclonic meander defined as MCC. The permanent anticyclonic vorticity in this
355
region (36.1-36.8°N; 14-15°E) is confirmed by the time series of vorticity field (Figure 8). At local scale,
356
this meander can sporadically create an anticyclonic gyre on the Malta plateau [28].
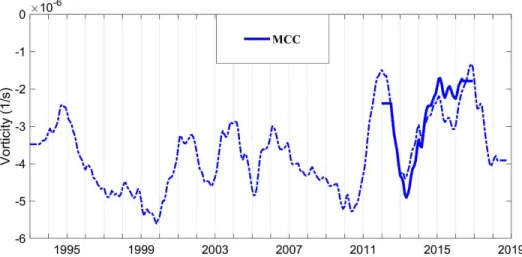
358
Figure 8.Time series of the spatially averaged, low pass filtered (13-months) vorticity field over the regions of
359
the Malta plateau. Dashed-dotted lines are referred to the vorticity field derived from the AGV; continuous lines
360
are related to the vorticity field derived from optimal currents in 2012-2016.
361
In the framework of the Italia-Malta Calypso Project [28], about 38 drifters were deployed on the
362
Malta plateau between December 2012 and September 2016. These drifters were captured by the
363
anticyclonic gyre on the plateau in two specific deployments: December 2012 and March 2014 (Figure
364
9). In December 2012-January 2013, drifters are captured by the anticyclonic gyre for about four weeks
365
(approximately between 14 December 2012 and 10 January 2013) before being transported out of the
366
plateau (Figure 9a). This gyre is also confirmed by the trajectory of the float WMO 6901044 (Figure
367
10a) and by HF radar measurements [29]. On 22 March 2014, six drifters were deployed in the area
368
and were trapped in the gyre for about 2 weeks (Figure 9b). Drifters allow to estimate the radius and
369
the rotation period of the structure considering the centroids computed from all the closed loops of
370
the drifter trajectories. The radius spanned between 11 and 27 km and the period increased from 4.1
371
to 8.4 days, in coincidence with an increasing the distance from the centre.
372
373
Figure 9. Trajectories and deployment positions (black dots) of the drifters deployed on the Malta Plateau in
374
December 2012 (a) and March 2014 (b).
375
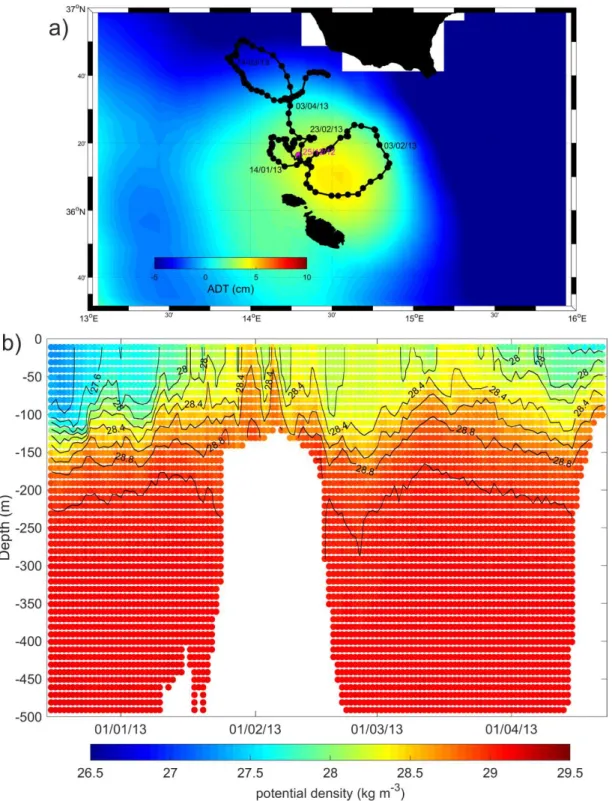
The float WMO 6901044 was entrapped in the MCC between 15 December 2012 and
17-February-376
2013, then it joined a cyclonic structure located north-western of the Malta Plateau (Figures 10a). It
377
had a cycling period of 1 day, and its trajectory gives an indication of the 350 m displacements (see
378
Table 2). In the first part of its tracks, the float sampled the interior of the anticyclonic MCC showing
379
a deepening of the isopycnal surfaces (December 2012-January 2013) and reduced densities; in
380
February 2013 the float moved along the border of the MCC, then it was entrapped in the cyclonic
structure located in the north-western proximities of the Malta plateau (Figure 10b). Both the MCC
382
and the cyclonic structure show a similar vertical structure, extending to a depth of about 200 -250 m
383
(Figure 10b).
384
385
Figure 10. Map of the trajectory (black line) and profile positions (first profile: magenta dot; other profiles: black
386
dots) of the float WMO 6901044 superimposed on the mean map of the ADT (between 16-Dec-2012 and
30-April-387
2013) (a), and contour diagram of the potential density versus depth and time (b).
388
3.4.3 South of Malta
The time series of the vorticity fields obtained at the locations of the mesoscale eddies south and
390
south-west of Malta are shown in Figure 11. The MG (35°-35.5°N; 13°-14°E) and the SMA (35.5°-36°N;
391
14°-14.5°E), two adjacent structures located south-west of the Maltese Islands, show larger
392
variabilities of the vorticity field with respect to the SMG (34°-35°N; 13°-14°E) and LSBV (33°-33.5°N;
393
12.5°-14°E). This behaviour is probably related to the wind-stress, which is more intense in the Malta
394
region than in the southern SC (Figure 2c). The vorticity of SMA increases with time over the
395
considered period.
396
397
Figure 11. Time series of the spatially averaged, low pass filtered (13-months) vorticity field over the regions of
398
MG, SMA, SMG and LSBV. Dashed-dotted lines are referred to the vorticity field derived from the AGV;
399
continuous lines are related to the vorticity field derived from optimal currents in 2012-2016.
400
The float WMO 6903242, became entrapped in the anticyclonic SMA in mid-September 2018,
401
therefore describes five loops around the eddy core before being captured by the eastward BATC
402
(Figure 12a). It had a short cycling period (see Table 2) and its trajectory indicates the mean near
403
surface displacements (0-180 m). The subsurface density distribution clearly shows the net
404
differences between the water masses located east (potential density smaller than 24.8 kg/m3) and
405
south (potential density larger than 26 kg/m3) of the of SMA (Figure 12b). The SMA extends down to
406
a depth of about 40 m (Figure 12c). At the end of October 2018 the float left the cyclonic structures
407
and moves eastward encountering surface waters of eastern origin, denser than 1026 kg/m3.
408
Table 2. List of selected Argo float with dates and positions of the first and the last profile considered in this
409
work, parking and profiling depths and the cycle period of each instrument.
410
Float WMO First profile Last profile depth (m) Parking Profile depth (m) Cycle Period (days)
6900981 38.9°N, 13.6°E 23-Apr-2012 38.8°N, 14.9°E 3-Jan-2013 350 600/2000 5 6901044 36.3°N, 14.3°E 16-Dec-2012 36.7°N, 14.5°E 22-Apr-2013 350 700
1
6903242 35.4°N, 14.4°E 11-Sep-2018 35.2°N, 15.0°E 13-Nov-2018 200 2000.125
1900629 33.7°N, 13.5°E 22-Aug-2007 34.5°N, 13.9°E 05-Mar-2008 350 700/20005
1900948 33.0°N, 15.6°E 19-Jul-2015 32.9°N, 15.0°E 28-Feb-2016 1000 15004
1900954 35.8°N, 15.6°E 16-Oct-2016 35.2°N, 14.8°E 05-Mar-2017 1000 15004
412
Figure 12.Map of the trajectory (black line) and profile positions (first profile: magenta dot; other profiles: black
413
dots) of the float WMO 6903242 superimposed on the mean map of the ADT (between 12-Sep-2018 and
11-Nov-414
2018) (a), map of the potential density measured at 20 m depth (b), and contour diagram of the potential density
415
versus depth and time (c).
416
The float WMO 1900629, coming from the Libyan coast, was entrapped in the cyclonic SMG at the
417
end of 2007 (Figure 13a). This structure is denser than the surrounding waters (Figure 13b). Since in
418
the region of the SMG the maximum depth of the sea bottom is of about 400 m (Figure 1a), and since
419
the cyclonic trajectory of the float WMO 1900629 (Figure 13a) represents the displacements of the
420
currents at the parking depth of 350 m (see Table 2), we can conclude that the cyclonic structure
421
affects the entire water column in this area.
423
Figure 13.Map of the trajectory (black line) and profile positions (first profile: magenta dot; other profiles: black
424
dots) of the float WMO 1900629 superimposed on the mean map of the ADT (between 27-Aug-2007 and
23-Feb-425
2008) (a), and contour diagram of the potential density versus depth and time (b).
426
The cyclonic LSBV is sampled by the float WMO 1900948 during the period October 2015 – February
427
2016 (Figure 14a). The entrance of this float in the LSBV is emphasized in Figure 14b by higher density
428
compared to the surrounding waters, and by changes in the shape of the isopycnal surfaces. Even if
429
the float WMO 1900948 has a parking depth of 1000 m (see Table 2), its displacements represent the
430
current at 350 m depth due to the bathymetry of the LSBV region (see Figures 1a and 14b). We can
431
conclude that the cyclonic structure affects the entire water column in this area (Figure 14b).
432
433
Figure 14. Map of the trajectory (black line) and profile positions (first profile: magenta dot; other profiles: black
434
dots)of the float WMO 1900948 superimposed on the mean map of the ADT (between 19-Jul-2015 and
28-Feb-435
2016) (a), and contour diagram of the potential density versus depth and time (b).
436
437
3.4.4 Ionian cyclones
438
Figure 15a shows the time series of the vorticity field along the eastern coast of Sicily (MRV and ISV
439
area – 36.5°-38°N; 15°-16°E) and in the region of the SISV. Figure 15a show an inconsistency between
440
the vorticity derived from AGV and those derived from the optimal currents in the region of the SISV.
441
From the optimal currents validation carried out by [15], this structure lies in an area where the
442
method degrades the quality of the surface currents (in particular of the meridional component) when
443
compared with the AGV(see Figure 10 of [15]). Therefore the optimal currents could not be consistent
444
in the description of SISV.
445
446
Figure 15.a) Time series of the spatially averaged, low pass filtered (13-months) vorticity field over the regions
447
of the MRV-ISV and SISV. Dashed-dotted lines are referred to the vorticity field derived from the AGV;
448
continuous lines are related to the vorticity field derived from optimal currents in 2012-2016; b) time series of
449
the monthly, spatially averaged low-pass filtered (13-months) wind-stress and c) wind stress vorticity in the
450
MRV region.
451
The MRV and ISV are wind-driven structure [7,24] and their interannual variability is related to the
452
wind-stress along the eastern coast of Sicily (Figures 15b and 15c): e.g. lower values of current
453
vorticity in the MRV-ISV regions are related to lower wind-stress and lower wind stress curl. The
454
SISV (35.5°-36.6°N; 15°-16°) is not influenced by the wind-stress vorticity, whereas it appears to be
455
influenced by the quasi-decadal reversal of the northern Ionian (see black dashed lines in Figure 15a
that give an indication of the mean vorticity value during each anticyclonic/cyclonic circulation
457
mode) in the period 1993-2010. After 2010, the vorticity of the currents is no longer consistent with
458
the decadal variability and seems to be rather linked to some other phenomena, that currently are not
459
detectable from our datasets.
460
The float WMO 1900954, coming from the eastern Ionian, was entrapped in the SISV in December
461
2017 (Figure 16a) and shown an increase of density with respect to the water located north of this
462
mesoscale structure (Figure 16b). Even if the float WMO 1900954 has a parking depth of 1000 m (see
463
Table 2), its displacements represent the current at about 500 m depth due to the bathymetry of the
464
SISV region (see Figures 1a and 16b). The vertical extension of the SISV is about 100 m (Figure 16b).
465
466
Figure 16.Map of the trajectory (black line) and profile positions (first profile: magenta dot; other profiles: black
467
dots) of the float WMO 1900954 superimposed on the mean map of the ADT (between 20-Oct-2016 and
7-Mar-468
2017) (a), and contour diagram of the potential density versus depth and time (b).
4. Discussion and Conclusions
470
The main findings of this work are summarized in Figure 17, where a schematic diagram of the
471
surface circulation, based on the mean circulation map depicted in Figure 2b, is presented. In
472
Figure 17a the main circulation structures are classified according to their seasonal variability,
473
whereas in Figure 17b they are identified based on the main forcing factor that determines them.
474
The basin scale circulation is essentially oriented according to the wind stress direction
475
(northwest – southeast; Figures 2a, 2c, 17). Most of the main sub-basin scale current systems and
476
mesoscale structures are permanent but affected by a strong seasonal variability (Figure 17a);
477
only the TSC and the PV show a seasonal incidence and occur exclusively in summer and winter,
478
respectively. The BTC, ATC, BATC and ALC show a winter intensification (Figure 17a)
479
concurrent with the intensification of the wind stress (Figures 3 and 4); for this reason they are
480
classified as wind-driven features in Figure 17b. The relationship between the sub-basin scale
481
structures and the wind stress variability was already suggested by [13,30]. Other sub-basin scale
482
and mesoscale structures - e.g. the meandering AIS, the SG, and the MCC - are stronger in
483
summer, when the wind stress is weaker. Hence, we exclude the direct impact of the wind on
484
the variability of these structures. Rather, we suggest that they are influenced by other forcings
485
such as the instability of the surface currents and/or their interaction with the complex and
486
relative shallow bottom topography (Figure 17b), characterised by continental shelves and
487
channels.
488
The MG and SMA are located in a highly dynamic region (high level of Eddy Kinetic Energy,
489
see Figure 6 of [24]and Figure 9a of [11]) characterized by the split of the ATC, whose eastward
490
branch forms the BATC, and by a sudden reduction of depth (Figure 1a). These factors probably
491
interact in facilitating the eddies formation and retention. From these considerations, the MG
492
and SMA are influenced by the surface current dynamics and/or topography (Figure 17b). They
493
are stronger in winter because the sub-basin currents, involved in their formation (ATC and
494
BATC), are most intense and energetic in this season (Figure 17a).
495
The ABV, the MRV and the ISV are located along the southern and the eastern coast of Sicily
496
where the wind stress curl is steadily cyclonic (Figures 2d, 4c, 4d). Their strength and their
497
interannual variability are influenced by the temporal evolution of the wind stress amplitude
498
and vorticity (Figures 15, 17b).
499
The SMG is located on the margins of the African shelf break (Figures 1a, 2a, 2b) and its vertical
500
extension affects the entire water column (maximum depth of 400 m) as documented by the float
501
WMO 1900629 (Figure 13); the wind stress is weak and dimly cyclonic in this region (Figure 2
502
lower panels). Therefore, we define the SMG in Figure 17b as strongly influenced by the
503
interaction between the surface currents and the topography.
504
The mesoscale structures located in regions where the influence of the wind stress is lower can
505
be forced by the large-scale internal variability of the ocean. An example of this interaction is the
506
SISV, whose interannual variability is connected to the decadal variability of the surface
507
circulation in the northern Ionian (Figure 15a). However, the most representative example of the
508
influence of internal forcing on the variability of a mesoscale structure is the NSA. This
509
anticyclone, although located in the southern Tyrrhenian Sea, is affected by the decadal
510
variability induced by the adjacent Ionian Sea (Figure 6). This result, as suggested by [27],opens
511
to a new interpretation of the link between different Mediterranean sub-basins and underlines
512
the importance of internal processes on the variability of the mesoscale structures.
513
In summary, the surface circulation in the SC and southern Tyrrhenian Sea is characterized by
514
multi-scale spatial and temporal variability. The main spatial scales involved are the basin,
sub-515
basin and mesoscale. The main temporal scales involved are the seasonal, interannual and
decadal scales. In this work, the complexity of the SC current system was investigated by
517
combining different in-situ data and satellite products. Results provide an updated picture of
518
the surface circulation, detecting new mesoscale features and describing their temporal
519
variability and strength in relation to the main external and/or internal forcings. The winter
520
strengthening of the wind stress directly influence most of the structure stronger in this season.
521
The structures stronger in summer and/or located in high dynamical regions are mainly driven
522
by the instability of the surface current and/or by their interaction with the bottom topography.
523
In the regions where the influence of the external forcings is weaken, the large-scale internal
524
variability of the adjacent Mediterranean basins can influence the local dynamics.
525
526
Figure 17. Schematized representation of the mean surface circulation in the Sicily Channel and Southern
527
Tyrrhenian Sea (black arrows) based on the mean optimal currents circulation map depicted Figure 2b (bright
528
grey vectors). (a) Black arrows emphasized the permanent sub-basin and mesoscale structures; dashed red/blue
529
lines emphasized the seasonal summer/winter structures, respectively; red/blue arrows are superimposed on
530
the black arrows when the structures are permanent but most intense in summer/winter respectively. (b)
Sub-531
basin and mesoscale structures are classified according to the mechanisms that drive them: the wind forcing
532
(orange arrows), the interaction between currents and topographical forcings (light green arrows), the
large-533
scale internal processes (light purple arrows).
534
535
Author Contributions: writing—original draft preparation, M.M.; writing—review and editing, P.-M.P., D.C.,
536
A.Doglioli, G.N. and R.G.; investigation, M.M. and P.-M.P.; data curation, M.M., G.N., R.G., D.C. and M.-H.R.;
537
formal analysis, M.M., G.N. and R.G.; resources, D.C., M.-H.R., A.G. and R.S.; funding acquisition, P.-M.P. and
538
A.Drago.
539
Funding: This research was mainly funded by the Italian Ministry of Education, University and Research as part
540
of the Argo-Italy program, and partly funded by the Italia-Malta Programme – Cohesion Policy 2007–2013,
541
European Union Regional Development Funds (ERDF) through the CALYPSO and CALYPSO FO projects,. The
542
program MISTRALS of CNRS funded the drifters deployed during the PEACETIME cruise (Guieu C., Desboeufs
543
K., 2017, RV Pourquoi pas ?, https://doi.org/10.17600/17000300).
544
Acknowledgments: The authors would like to thanks all the people who have deployed drifters and made their
545
data available in the Mediterranean Sea in the period 1993-2018. We acknowledge Antonio Bussani for his
technical support and his work in the production of the Mediterranean drifter dataset, and Elena Mauri for her
547
constructive comments. We thank the two anonymous reviewers for their constructive comments on the
548
manuscript.
549
Conflicts of Interest: The authors declare no conflict of interest.
550
551
References
552
1. Sorgente R.; Olita, A.; Oddo, P.; Fazioli, L.; Ribotti, A. Numerical simulation and decomposition of kinetic
553
energy in the Central Mediterranean: insight on mesoscale circulation and energy conversion. Ocean Sci.
554
2011, 7, 503-519. doi:10.5194/os-7-503-2011.
555
2. Schroeder, K.; Chiggiato, J.; Josey, S.A.; Borghini, M.; Aracri, S.; Sparnocchia, S. Rapid response to climate
556
change in marginal sea. Sci. Rep. 2017, 7:4065, doi:10.1038/s41598-017-04455-5.
557
3. Jouini, M.; Béranger, K.; Arsouze, T. J.; Beuvier, S.; Thiria, M.; Crepon, I. Taupier-Letage, I. The Sicily
558
Channel surface circulation revisited using a neural clustering analysis of a high-resolution simulation, J.
559
Geophys.Res. Oceans 2016, 121, 4545–4567, doi: https://doi.org/10.1002/2015JC011472.
560
4. Ferron, B.; Bouruet Aubertot, P.; Cuypers, Y.; Schroeder, K.; Borghini, M. How important are diapycnal
561
mixing and geothermal heating for the deep circulation of the Western Mediterranean? Geophys. Res. Lett.
562
2017, 44, 15, 7845-7854, doi: https://doi.org/10.1002/2017GL074169.
563
5. Vladoui, A.; Bouruet-Aubertot P.; Cuypers, Y.; Ferron, B.; Schroeder, K.; Borghini, M.; Leizour, S.; Ben
564
Ismail, S. Turbulence in the Sicily Channel from microstructure measurements. Deep-Sea Res. I 2018, 137,
565
97-122, doi: https://doi.org/10.1016/j.dsr.2018.05.006.
566
6. Millot, C.; Taupier-Letage, I. Circulation in the Mediterranean Sea. Handb. Environ. Chem. 2005, 5(K),
29-567
66.
568
7. Lermusiaux, P.F.J.; Robinson, A.R. Features of dominant mesoscale variability, circulation patterns and
569
dynamics in the Strait of Sicily. Deep-Sea Res. I 2001, 48, 1953-1997.
570
8. Béranger, K.; L. Mortier; Gasparini, G.-P.; Gervasio, L.; Astraldi, M.; Crepon, M. The dynamics of the Sicily
571
Strait: A comprehensive study from observations and models, Deep Sea Res. II, 2004, 51, 411–440.
572
9. Poulain, P. M.; Zambianchi, E. Surface circulation in the central Mediterranean Sea as deduced from
573
Lagrangian drifters in the 1990s. Cont. Shelf Res. 2007, 27, 981–1001.
574
10. Astraldi, M.; Balopoulos, S.; Candela, J.; Font, J.; Gacic, M.; Gasparini, G. P.; Manca, B.; Theocharis, A.;
575
Tintoré, J. The role of straits and channels in understanding the characteristics of Mediterranean circulation,
576
Prog. Oceanogr. 1999, 44, 65–108.
577
11. Poulain, P.-M.; Menna, M.; Mauri, E. Surface geostrophic circulation of the Mediterranean Sea derived from
578
drifter and satellite altimeter data. J. Phys. Oceanogr. 2012, 42(6), 973–990.
https://doi.org/10.1175/JPO-D-579
11-0159.1.
580
12. Pinardi, N.; Zavatarelli, M.; Adani, M.; Coppini, G.; Fratianni, C.; Oddo, P.; Simoncelli, S.; Tonani, M.;
581
Lyubartsev, V.; Dobricic, S.; Bonaduce, A. Mediterranean Sea large-scale low-frequency ocean variability
582
and water mass formation rates from 1987 to 2007: a retrospective analysis (ISSN 0079-6611). Prog.
583
Oceanogr. 2015, 132, 318–332. https://doi.org/10.1016/j.pocean.2013.11.003.
584
13. Molcard, A.; Gervasio, L.; Griffa, A.; Gasparini, G. P.; Mortier, L.; Ozgokmen, T. M. Numerical investigation
585
of the Sicily Channel dynamics: density currents and water mass advection, J. Mar. Syst. 2002, 36, 219–238.
586
14. Amores A.; Jordà, G.; Arsouze, T.; Le Sommer, J. Up to what extent can we characterize ocean eddies using
587
present day gridded altimetric products? J. Geophys. Res.-Oceans 2018, 123,
588
https://doi.org/10.1029/2018JC014140.
589
15. Ciani, D.; Rio, M.-H.; Menna, M.; Santoleri R. A synergetic approach for the space-based sea surface
590
currents retrieval in the Mediterranean Sea, Remote Sens. 2019, 11, 1285, doi:10.3390/rs11111285.
591
16. Menna, M.; Gerin, R.; Bussani, A.; Poulain, P.-M. The OGS Mediterranean drifter database: 1986-2016.
592
Technical report 2017/92 Sez. OCE 28 MAOS, 2017.
593
17. Menna, M.; Poulain, P.-M.; Bussani, A.; Gerin, R. Detecting the drogue presence of SVP drifters from wind
594
slippage in the Mediterranean Sea, Measurement 2018, 125, 447-453,
595
https://doi.org/10.1016/j.measurement.2018.05.022.