HAL Id: hal-01668850
https://hal.sorbonne-universite.fr/hal-01668850
Submitted on 20 Dec 2017
HAL is a multi-disciplinary open access
archive for the deposit and dissemination of sci-entific research documents, whether they are pub-lished or not. The documents may come from teaching and research institutions in France or abroad, or from public or private research centers.
L’archive ouverte pluridisciplinaire HAL, est destinée au dépôt et à la diffusion de documents scientifiques de niveau recherche, publiés ou non, émanant des établissements d’enseignement et de recherche français ou étrangers, des laboratoires publics ou privés.
Quantifying tumor vascular heterogeneity with
DCE-MRI in complex adnexal masses: A preliminary
study
Isabelle Thomassin-Naggara, Narimane Soualhi, Daniel Balvay, Emile Darai,
Charles-Andre Cuenod
To cite this version:
Isabelle Thomassin-Naggara, Narimane Soualhi, Daniel Balvay, Emile Darai, Charles-Andre Cuenod. Quantifying tumor vascular heterogeneity with DCE-MRI in complex adnexal masses: A prelimi-nary study. Journal of Magnetic Resonance Imaging, Wiley-Blackwell, 2017, 46 (6), pp.1776-1785. �10.1002/jmri.25707�. �hal-01668850�
1
Quantitative dynamic contrast-enhanced MR imaging analysis of complex adnexal
masses: A preliminary study
Isabelle Thomassin-Naggara, Narimane Soualhi, Daniel Balvay, Emile Darai, Charles-André Cuenod
Key points
Quantitative DCE MR imaging allows accurate differentiation between malignant and benign tumours
Quantitative DCE MR imaging may help to predict peritoneal carcinomatosis associated with ovarian tumors
Quantitative DCE MR imaging allows to distinguish primary invasive ovarian tumours from borderline tumours
2
ABSTRACT
Objective: To evaluate the ability of quantitative dynamic contrast-enhanced magnetic
resonance imaging (DCE-MRI) to differentiate malignant from benign adnexal tumours.
Methods: Fifty-six women with 38 malignant and 18 benign tumours who underwent MR
imaging before surgery for complex adnexal masses were included. Microvascular
parameters were extracted from DCE-MRI series, using a pharmacokinetic model in the
solid tissue of adnexal tumours. These parameters were tissue blood flow (FT), blood
volume fraction (Vb), permeability-surface area product (PS), interstitial volume fraction
(Ve), lag time (Dt) and area under the enhancing curve (rAUC). Area under the Receiver
Operating Curve (AUROC) was calculated as a descriptive tool to assess the overall
discrimination of parameters.
Results: Malignant tumours displayed higher FT, Vb, rAUC and lower Ve than benign
tumours (p<0.05) . FT was the most relevant factor for discriminating malignant from benign
tumours (AUROC=0.86). Primary invasive ovarian tumours displayed higher FT and shorter
Dt than borderline tumours. Malignant tumours with associated peritoneal carcinomatosis
displayed a shorter Dt than those without peritoneal carcinomatosis at surgery (p=0.01).
Conclusion: Quantitative DCE-MRI is a feasible and accurate technique to differentiate
malignant from benign adnexal tumours and could potentially help the oncological surgeon
to choose the better treatment planning for patients.
Key words: Perfusion, MRI, Complex adnexal masses, Dynamic contrast-enhanced MRI,
3
INTRODUCTION
During the past decade, dynamic contrast-enhanced MR imaging (DCE-MRI) has proved to
be useful for characterising pelvic solid tissue [1, 2]. The contribution of DCE-MRI to
ovarian tumours has been demonstrated by many authors [3, 4] and especially for the
characterisation of complex or indeterminate adnexal masses (ovarian and tubal masses) at
ultrasound [5]. In this setting, descriptive analysis allows three types of curve to be
described which are useful for differentiating benign from malignant tumours [6]. Using
semi-quantitative analysis, the maximal slope of the time-intensity curve has been shown to
be correlated with microvessel parietal immaturity of ovarian malignant tumours and is
therefore an accurate means of differentiating benign from malignant epithelial tumours [5].
However, descriptive and semi-quantitative analyses are based on image signal intensity
analysis and lack reproducibility because they do not take into account the individual
variability of the arterial input function.
In this setting, advances in fast imaging techniques enable pharmacokinetic
physiological modelling using quantitative DCE-MRI analysis [1, 7-9]. However, there are
currently no available data on the use of this technique to analyse the dynamic enhancement
behaviour of benign and malignant adnexal tumours.
We therefore sought to determine the feasibility of MR pharmacokinetics modelling
in adnexal tumours and to evaluate the ability of perfusion kinetic parameters to differentiate
4
MATERIALS AND METHODS
Our institutional ethics committee approved the study and granted a waiver of informed
consent.
Between May 2006 and February 2008, our MR imaging database was
retrospectively queried to identify women who underwent MR imaging with dynamic
contrast-enhanced imaging for ultrasound-complex adnexal masses with subsequent surgery
with pathological correlation (n=87).
Among these 87 patients, DCE-MRI quantitative analysis was not possible in 31
patients (reasons for exclusion: no solid component [n=14], sagittal acquisition plane [n=9],
technical problem including injection or artefact [n=4] and data conversion [n=4]). Thus, our
final cohort included 56 patients (mean age, 54.5 years; age range, 25–87 years).
At surgery, among these 56 patients, ovarian cystectomy was performed in one
woman, salpingo-oophorectomy in 20 women (unilateral in 6 and bilateral in 14), bilateral
salpingo-oophorectomy with hysterectomy in 28 women, and omentectomy and peritoneal
biopsies in 7 women. When bilateral lesions had the same histology (n=18), only the most
complex mass was included in the statistical analysis to limit the intra-correlation effect.
Histopathological findings included 18 benign lesions (9 epithelial cystadenomas, 8
sex-cord tumours, and 1 hydrosalpinx) and 38 malignant tumours (5 epithelial borderline
cystadenomas, 27 cystadenocarcinomas, 1 sex-cord stromal tumour [granulosa cell tumour],
3 metastases and 2 tubal cancers). Peritoneal carcinomatosis was detected at surgery in 25 of
the 38 malignant tumours (65.7%) (22 ovarian cystadenocarcinomas, 2 metastases and 1
5
MR imaging technique
Magnetic resonance imaging sequences were acquired at 1.5 T (Sonata, Siemens,
Erlangen, Germany) using a phased array pelvic coil. All sequences were acquired with
saturation bands placed anteriorly and posteriorly to eliminate the high signal from
subcutaneous fat. Patients fasted for 3 h and received an antispasmodic drug intravenously
(10 mg of tiemonium methylsulphate; Visceralgine; Organon, Livron, France) immediately
before MR imaging to reduce bowel peristalsis.
Before injection, the following sequences were acquired: sagittal (TSE) T2-weighted
turbo spin-echo (TR = 5050, TE = 121, slice thickness = 5 mm, gap interslice = 1 mm, FOV
= 280 x 225, matrix = 512 x 245, NEX = 2, number of slices = 25, acquisition time = 178
sec) and axial T2-weighted turbo spin-echo (TR = 6790, TE = 89, slice thickness = 5 mm,
gap interslice = 1 mm, FOV= 370 x 275, matrix = 512 x 187, NEX = 2, number of slices =
45, acquisition time = 185 sec) and axial gradient-echo T1-weighted sequences with and
without fat suppression (TR = 170, TE = 4.76, flip angle = 70°, slice thickness = 5 mm, gap
interslice = 1 mm, FOV= 320 x 280, matrix = 246 x 145, NEX = 1, number of slices = 15,
acquisition time = 21 s).
Then, an axial or axial oblique dynamic contrast-enhanced (DCE) T1-weighted
gradient-echo sequence (2D FLASH) (TR = 27, TE = 2.24, flip angle = 80°, slice thickness
= 5 mm, gap interslice = 1 mm, FOV = 400 x 200, matrix = 256 x 128, NEX = 1, number of
slices = 3) was acquired during a total acquisition time of 320 sec through the tumour at the
level where “solid tissue” was observed on non-enhanced MR images, as previously
described [6]. “Solid tissue or solid component”, as defined by Timmerman et al. [10],
comprises vegetations, solid portions, and thickened septa. Gadolinium chelate (DOTAREM, Guerbet, Aulnay, France) was given at a dose of 0.2 mL.kg–1 via a Power
6 normal saline to flush the tubing. Images were obtained at 2.4-s intervals beginning 10 s
before the bolus injection, for a total of 320 s and a total of 130 time frames.
Finally, delayed enhanced axial and sagittal T1-weighted gradient-echo images with
breath-hold were performed 6 min after gadolinium injection.
MR imaging analysis
Morphological criteria
Tumour size, presence of a solid and/or cystic component, presence of thickened
septa, vegetation and/or a solid portion within a cystic tumour were recorded. The cystic
component was defined as tissue that had long T1 and T2 characteristics and showed no
enhancement after injection. A tumour was defined either as purely solid or as mixed
(tumour with solid and cystic components). By definition, the solid component showed
enhancement after injection. The size of the solid tissue was also recorded.
Finally, the presence of associated peritoneal carcinomatosis on MR imaging was
noted.
Regions of interest
Dynamic data were analysed using dedicated software developed in-house with
MatLab 7.2 (R2006a; The Mathworks, Natick, MA, USA) and running on a PC (Pentium 4
at 2.8 GHz and 2.5 GB of RAM memory). All the fittings were based on the Levenberg–
Marquardt regression method.
One researcher with 5 years’ experience in pelvic MR imaging and no knowledge of
the patient’s clinical information performed the analysis. Two regions of interest (ROIs)
were drawn for each examination: within the lumen of an external iliac artery (to record an
7 1). Signal–time courses of these ROIs were determined over all 130 time frames for
pharmacokinetic analysis.
Pharmacokinetic analysis
The external iliac artery signal enhancement curve was used as the arterial input function
(AIF) to the pharmacokinetic model (Fig. 2). The signal intensity was converted into
concentration equivalents assuming a near linear relationship between contrast agent
concentration and signal enhancement within the range of 0–3 mM Gd-DOTA values [9].
These data were validated in our laboratory during a previously published study [11] by
phantom experiments using the same MR acquisition parameters:
) ( ) 0 ( ) (t S k C t S − = ⋅
where S(0) and S(t) are the signal intensities before injection and at time t after the
beginning of the contrast agent injection, respectively, C(t) is the contrast agent
concentration in tissue at time t, and k depends on the tissue-specific native longitudinal
relaxation time, acquisition parameters and the contrast media relaxivity. A haematocrit
level of 45% was considered in large vessels and 33% in small vessels [12, 13].
The molecules of contrast agent can leak through the endothelial wall of capillaries
but remain extracellular. Therefore, the evolution of tissue contrast agent concentration
follows the equation of a previously published two-compartmental model (M2) with
exchanges between the capillary and the interstitial spaces (see Appendix) [11, 14-17]. In
addition to tissue blood flow FT (mL.min–1.100 mL–1) and blood volume fraction Vb (%),
this model provides the permeability-surface area product PS (mL.min–1.100 mL–1), the
extracapillary and extracellular (interstitial) volume fraction Ve (%), and the lag time Dt (s),
which is the time required for blood to go to the tissue arterioles from AIF measurement in
8 between the area under the curve of the tumour and the area under the curve of the
individual input artery.
Relevance test of the model
The relevance of the proposed model was assessed using quality criteria designed to identify
bad fitting and poor contrast-to-noise ratio. Quality criteria were fraction of modelling
information (FIM), which identifies poor fit, and fraction of initial information (FII), which
calculates the ratio of informative signal compared with total signal [18], a measure of the
contrast-to-noise ratio.
Statistical analysis
Continuous parametric variables were compared using the Mann–Whitney test and
categorical variables were compared using Fisher’s exact test, as appropriate. Receiver
operating curves (ROC) and the area under the ROC curve (AUROC) were calculated as a
descriptive tool to assess the overall discrimination of parameters.
A p value of less than 0.05 was considered to indicate a statistically significant
9
RESULTS
Morphological MR characteristics
Morphological characteristics of adnexal tumours are described in Table 1. In our
population, 19 tumours were purely solid and 37 were mixed, including 27 tumours with a
solid portion, 16 tumours with vegetations and 13 tumours with thickened septa. No
statistical difference regarding type or size of solid tissue was found between benign and
malignant adnexal tumours.
Among the malignant tumours (n=38), associated peritoneal carcinomatosis was
correctly described on MR imaging in 17/18 tumours (Positive predictive value = 94.4%).
Among the 20 tumours that did not display any peritoneal nodule on MR imaging, only 12
tumours were not associated with peritoneal carcinomatosis at surgery (Negative predictive
value = 60%).
Relevance of the model
Typical adnexal tumour enhancement curves are shown in Fig. 2. The curve fit allows the
capillary and interstitial contribution to tissue enhancement to be separated. Data were fitted
both in benign and malignant adnexal tumours with high quality (FMI = 0·94 [+/-0·05] and
0·96 0·03], respectively) and displayed a high contrast-to-noise ratio (FII = 0·95
[+/-0·14] and 0·99 [+/-0·001], respectively) (Fig. 2).
Comparison of quantitative DCE-MRI parameters between benign and malignant
adnexal tumours
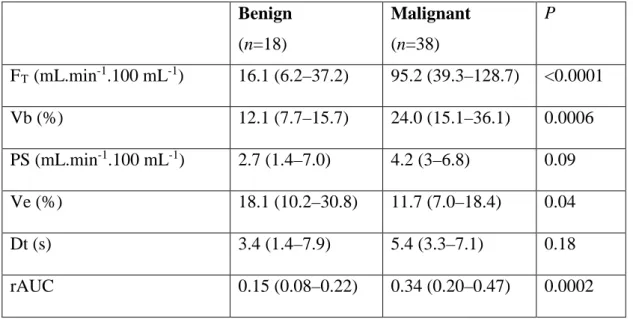
Malignant adnexal tumours displayed a higher tissue blood flow (FT), a higher blood
volume fraction (Vb) and a lower interstitial volume (Ve) than benign adnexal tumours
10 regarding permeability-surface area product (PS) and lag time (Dt) was found between
malignant and benign adnexal tumours; nevertheless, PS tended to be higher for malignant
tumours. On the contrary, the rAUC was significantly higher in malignant than in benign
tumours (p=0.0002).
The results of ROC analysis of all DCE-MRI parameters are summarised in Table 3.
The most relevant factors for discriminating malignant from benign tumours, expressed as
the area under the ROC curve, were tissue blood flow (FT) (AUROC=0.86), rAUC
(AUROC=0.81) and blood volume fraction (Vb) (AUROC=0.79) (Fig. 3). Using ROC
analysis, an FT >39.5 had a sensitivity of 73.7% and a specificity of 88.9% for predicting
malignancy.
Comparison of quantitative DCE-MRI parameters between the different subtypes of
malignant ovarian tumours
Primary invasive ovarian tumours displayed a higher tissue blood flow (FT) and a lower lag
time (Dt) than borderline tumours (p=0.001 and p=0.02) (Fig. 4). No significant difference
regarding blood volume fraction (Vb), permeability-surface area product (PS) and interstitial
volume (Ve) was found between primary invasive ovarian tumours and borderline tumours.
No difference regarding quantitative MR parameters was found between primary invasive
ovarian tumours and metastasis
Comparison of quantitative DCE-MRI parameters between malignant adnexal
tumours with and without peritoneal carcinomatosis
Malignant adnexal tumours associated with peritoneal carcinomatosis detected at surgery
displayed a shorter lag time (Dt) (median 3.9 s; interquartile range [2.7-6.2]) than those
11 (p=0.01). No difference was found between these two groups of malignant tumours
whatever other DCE-MRI parameters were considered.
Using ROC analysis, a Dt <5.47 had a sensitivity of 64% and a specificity of 76.9%
for predicting peritoneal carcinomatosis. Among the eight malignant tumours where
peritoneal carcinomatosis was not detected on MR imaging but was depicted at surgery (i.e.
false-negatives), 4/8 (50%) displayed a Dt <5.47. Thus, adding Dt to the morphological
criteria, peritoneal carcinomatosis could be preoperatively diagnosed in 84% (21/25) of
12
DISCUSSION
Our study demonstrates that pharmacokinetic modelling using a comprehensive
two-compartmental model is a relevant tool for differentiating malignant from benign adnexal
tumours with a high quality and a high contrast-to-noise ratio. Malignant tumours displayed
a higher tissue blood flow (FT), a higher blood fraction volume (Vb), a lower interstitial
volume (Ve) and a higher relative AUC (rAUC) than benign tumours. Primary invasive
ovarian tumors displayed a higher FT and a lower Dt than borderline tumours. Moreover,
malignant adnexal tumours with associated peritoneal carcinomatosisdisplayed a shorter lag
time (Dt) than those without peritoneal carcinomatosis at surgery.
To our knowledge, our study is the first to evaluate in vivo the microvascular
properties of adnexal tumour tissue. By extracting quantitative physiological
microcirculation parameters from DCE-MRI data with high time resolution and high
signal-to-noise ratio, our study shows that a two-compartmental model is comprehensive and
accurate for the analysis of the tissue of adnexal tumours.
The most interesting quantitative dynamic MR parameters to distinguish malignant
from benign tumours were FT, rAUC and Vb with AUROC higher than 0.78. These results
are in agreement with physiopathology: malignant tumours are characterised by the presence
of additive poorly formed and fragile neoangiogenic vessels [19]. In addition, microvessels
of malignant tumours lack a muscular coat and are highly permeable with a low pericyte
coverage index and a high VEGFR-2 receptor expression on both epithelial and endothelial
cells [20-23]. FT and Vb are higher in malignant adnexal tumours, likely due to the presence
of microvessel parietal immaturity. A tissue blood flow <39.5 ml·mn-1.100 ml-1 had a high
sensitivity (88.9%) for predicting benignity. Quantitative analysis may therefore help young
women wishing to preserve childbearing potential to opt for conservative surgery and may
13 Our data confirm that the analysis of early enhancement of adnexal tumours is very
useful to characterise solid tissue in complex adnexal tumours [4, 6, 24]. FT, Vb and Dt
mainly describe the first part of the tissue enhancement curve. Our study confirms that DCE
MR imaging is accurate to differentiate borderline from primary invasive ovarian tumours.
In accordance with time intensity curve (TIC) and semi-quantitative analysis (i.e. maximal
slope and enhancement amplitude) [23], primary invasive ovarian tumours display a steeper
and an earlier enhancement with a higher Ft and a lower Dt than borderline tumours. Due to
the generally good prognosis associated with these last group of tumours, fertility-sparing
surgery has been proposed, underlining the potential crucial role of quantitative DCE MR
analysis in the preoperative assessment.
Contrary to TIC or semi-quantitative measurement that led to considerable variation
between individual examinations [2], internal reference is not necessary for quantitative
analysis (AIF being the individual contrast input reference in quantitative analysis). This
notion is important because outer myometrial enhancement, used for enhancement curve
analysis for adnexal masses, was demonstrated to be significantly different between
post-menopausal women and women of reproductive age with a lower FT, lower Vb, higher PS,
higher Ve and lower Dt [11], and thus the appropriateness of using this organ as an internal
reference could be discussed.
Our results also reveal that interstitial volume (Ve) is lower in the tissular component
of adnexal malignant tumours than in those of benign tumours. In every tissue, there are
three different spaces: blood space (described in our model as Vb), extravascular
extracellular or interstitial space (described in our model as Ve) and cellular space (where
the gadolinium contrast media do not penetrate). In adnexal tumours, apparent diffusion
coefficient (ADC) have been described to be lower or equal in malignant than in benign
14 sequence is related to cellular space. Thus, as (Vb + Ve) described the total volume
distribution of contrast agent and because cellular space is not different or higher in
malignant than in benign adnexal tumours, if Vb is higher in malignant than in benign
tumours as described in our compartmental model, Ve should be lower in malignant than in
benign tumours.
Our results also show that, among malignant tumours, those with peritoneal
carcinomatosis at surgery displayed a shorter lag time (Dt) than those without peritoneal
carcinomatosis. Tumour neoangiogenesis plays a central role in the growth and spread of
tumours and Dt should be provide a means of evaluating the aggressiveness of the tumour,
from DCE data with time resolution of a few seconds. Peritoneal carcinomatosis is the main
form of dissemination of ovarian cancers and imaging techniques are currently unable to
detect accurately all peritoneal implants owing to their potentially very small size whatever
the technique used [28, 29]. Complete cytoreductive resection of all macroscopic disease at
surgery is one of the main prognostic factors of ovarian carcinoma. Thus, functional criteria
that predict peritoneal carcinomatosis are very interesting as new predictors of overall
survival to be integrated into clinical prognostic scores.
Recently, Vergote et al. in a European clinical trial group [30] demonstrated that
neoadjuvant chemotherapy followed by interval debulking surgery was not inferior to
primary debulking surgery followed by chemotherapy as a treatment option for patients with
bulky stage IIIC or IV ovarian carcinoma. As in several other applications [31-33],
quantitative DCE-MRI analysis gives reproducible parameters [34] that should be very
useful in evaluating the tumour response to therapy for these patients.
Finally, DCE-MRI parameters play a potential role in the early prediction of
progression in patients with residual ovarian cancer after surgery, thanks to a good
15 of this technique to predict when subsequent treatment is needed would be of significant
benefit [35].
Our study has several limitations: First of all, our population selection could be
biased. In this series, no difference was found regarding classical morphological criteria of
malignancy because we selected only tumours with solid tissue and thus with a DCE-MRI
sequence. This is why no extensive analysis were performed on morphological criteria.
However, in our series, the absence of difference regarding the median size of solid tissue
between benign and malignant tumours would appear to rule out any major technical
DCE-MRI analysis bias, because a substantial amount of solid tissue is needed to draw a region of
interest on the tissue. Second, interquartile ranges are large for Ve and PS and this likely
explains why the accuracy of Ve using AUROC is not so good and that PS tends to be
higher in malignant than in benign tumours, reflecting higher permeability as demonstrated
in immunohistochemical studies [20-22]. One hypothesis could be that the acquisition time
is not long enough to attempt equalisation of the concentrations between the intra- and
extravascular space and thus to provide optimal information concerning extravascular tissue
characteristics. A recommended time acquisition for DCE-MRI analysis is classically 10
min [36] so that the concentrations can be equalised between the intra- and extravascular
space. Thus, with an acquisition time longer than 320 s, the ability of Ve and PS to
discriminate between benign and malignant adnexal tumours should be improved. Third, due
to the clinical design of our study, no measurement of gadolinium concentration was
performed in the different tissues. However, we performed an optimisation of all acquisition
parameters in vivo to be near from linear relationship between [Gd] and signal intensity.
Despite of a factor of variability due to possible lack of linearity, our two-compartimental
model demonstrated very significant differences regarding quantitative DCE MR parameters
16 parameters was found between primary invasive ovarian tumours and metastasis probably
due to the small number of metastasis in our population.
In conclusion, this preliminary study shows that quantitative MR analysis of adnexal
tumours is feasible and allows accurate differentiation between malignant and benign
tumours. Further studies are needed to test the added value of this technique in a larger
17
REFERENCES
1 Padhani AR, Dzik-Jurasz A (2004) Perfusion MR imaging of extracranial tumor angiogenesis. Top Magn Reson Imaging 15:41-57
2 O'Connor JP, Jackson A, Parker GJ, Jayson GC (2007) DCE-MRI biomarkers in the clinical evaluation of antiangiogenic and vascular disrupting agents. Br J Cancer 96:189-195
3 Van Vierzen PB, Massuger LF, Ruys SH, Barentsz JO (1998) Borderline ovarian malignancy: ultrasound and fast dynamic MR findings. Eur J Radiol 28:136-142 4 Sohaib SA, Sahdev A, Van Trappen P, Jacobs IJ, Reznek RH (2003)
Characterization of adnexal mass lesions on MR imaging. AJR Am J Roentgenol 180:1297-1304
5 Thomassin-Naggara I, Toussaint I, Perrot N, et al. (2011) Characterization of Complex Adnexal Masses: Value of Adding Perfusion- and Diffusion-weighted MR Imaging to Conventional MR Imaging. Radiology 258:793-803
6 Thomassin-Naggara I, Darai E, Cuenod CA, Rouzier R, Callard P, Bazot M (2008) Dynamic Contrast-Enhanced Magnetic Resonance Imaging: a Useful Tool for Characterizing Ovarian Epithelial Tumors. J Magn Reson Imaging 28:111-120 7 Brix G, Semmler W, Port R, Schad LR, Layer G, Lorenz WJ (1991)
Pharmacokinetic parameters in CNS Gd-DTPA enhanced MR imaging. J Comput Assist Tomogr 15:621-628
8 Tofts PS, Kermode AG (1991) Measurement of the blood-brain barrier permeability and leakage space using dynamic MR imaging. 1. Fundamental concepts. Magn Reson Med 17:357-367
9 Larsson HB, Stubgaard M, Sondergaard L, Henriksen O (1994) In vivo
quantification of the unidirectional influx constant for Gd-DTPA diffusion across the myocardial capillaries with MR imaging. J Magn Reson Imaging 4:433-440
10 Timmerman D, Valentin L, Bourne TH, Collins WP, Verrelst H, Vergote I (2000) Terms, definitions and measurements to describe the sonographic features of adnexal tumors: a consensus opinion from the International Ovarian Tumor Analysis (IOTA) Group. Ultrasound Obstet Gynecol 16:500-505
11 Thomassin-Naggara I, Balvay D, Cuenod CA, Darai E, Marsault C, Bazot M (2010) Dynamic contrast-enhanced MR imaging to assess physiologic variations of
myometrial perfusion. Eur Radiol 20:984-994
12 Cenic A, Nabavi DG, Craen RA, Gelb AW, Lee TY (2000) A CT method to measure hemodynamics in brain tumors: validation and application of cerebral blood flow maps. AJNR Am J Neuroradiol 21:462-470
13 Cenic A, Nabavi DG, Craen RA, Gelb AW, Lee TY (1999) Dynamic CT
measurement of cerebral blood flow: a validation study. AJNR Am J Neuroradiol 20:63-73
14 Brix G, Bahner ML, Hoffmann U, Horvath A, Schreiber W (1999) Regional blood flow, capillary permeability, and compartmental volumes: measurement with dynamic CT – initial experience. Radiology 210:269-276
15 Pradel C, Siauve N, Bruneteau G, et al. (2003) Reduced capillary perfusion and permeability in human tumour xenografts treated with the VEGF signalling inhibitor ZD4190: an in vivo assessment using dynamic MR imaging and macromolecular contrast media. Magn Reson Imaging 21:845-851
16 De Bazelaire C, Siauve N, Fournier L, et al. (2005) Comprehensive model for simultaneous MRI determination of perfusion and permeability using a blood-pool agent in rats rhabdomyosarcoma. Eur Radiol 15:2497-2505
18 17 Balvay D, Tropres I, Billet R, et al. (2009) Mapping the zonal organization of tumor
perfusion and permeability in a rat glioma model by using dynamic contrast-enhanced synchrotron radiation CT. Radiology 250:692-702
18 Balvay D, Frouin F, Calmon G, et al. (2005) New criteria for assessing fit quality in dynamic contrast-enhanced T1-weighted MRI for perfusion and permeability imaging. Magn Reson Med 54:868-877
19 Fleischer AC, Rodgers WH, Kepple DM, Williams LL, Jones HWd (1993) Color Doppler sonography of ovarian masses: a multiparameter analysis. J Ultrasound Med 12:41-48
20 Abu-Jawdeh GM, Faix JD, Niloff J, et al. (1996) Strong expression of vascular permeability factor (vascular endothelial growth factor) and its receptors in ovarian borderline and malignant neoplasms. Lab Invest 74:1105-1115
21 Yamamoto S, Konishi I, Mandai M, et al. (1997) Expression of vascular endothelial growth factor (VEGF) in epithelial ovarian neoplasms: correlation with
clinicopathology and patient survival, and analysis of serum VEGF levels. Br J Cancer 76:1221-1227
22 Chen H, Ye D, Xie X, Chen B, Lu W (2004) VEGF, VEGFRs expressions and activated STATs in ovarian epithelial carcinoma. Gynecol Oncol 94:630-635
23 Thomassin-Naggara I, Bazot M, Darai E, Callard P, Thomassin J, Cuenod CA (2008) Epithelial ovarian tumors: value of dynamic contrast-enhanced MR imaging and correlation with tumor angiogenesis. Radiology 248:148-159
24 Bazot M, Nassar-Slaba J, Thomassin-Naggara I, Cortez A, Uzan S, Darai E (2006) MR imaging compared with intraoperative frozen-section examination for the diagnosis of adnexal tumors; correlation with final histology. Eur Radiol 16:2687-2699
25 Thomassin-Naggara I, Darai E, Cuenod CA, et al. (2009) Contribution of diffusion-weighted MR imaging for predicting benignity of complex adnexal masses. Eur Radiol 19:1544-1552
26 Bakir B, Bakan S, Tunaci M, et al. (2010) Diffusion-weighted imaging of solid or predominantly solid gynaecological adnexial masses: is it useful in the differential diagnosis? Br J Radiol 84(1003):600-611.
27 Takeuchi M, Matsuzaki K, Nishitani H (2010) Diffusion-weighted magnetic resonance imaging of ovarian tumors: differentiation of benign and malignant solid components of ovarian masses. J Comput Assist Tomogr 34:173-176
28 Fujii S, Matsusue E, Kanasaki Y, et al. (2008) Detection of peritoneal dissemination in gynecological malignancy: evaluation by diffusion-weighted MR imaging. Eur Radiol 18:18-23
29 Satoh Y, Ichikawa T, Motosugi U, et al. (2011) Diagnosis of peritoneal
dissemination: comparison of 18F-FDG PET/CT, diffusion-weighted MRI, and contrast-enhanced MDCT. AJR Am J Roentgenol 196:447-453
30 Vergote I, Trope CG, Amant F, et al. (2010) Neoadjuvant chemotherapy or primary surgery in stage IIIC or IV ovarian cancer. N Engl J Med 363:943-953
31 Barentsz JO, Berger-Hartog O, Witjes JA, et al. (1998) Evaluation of chemotherapy in advanced urinary bladder cancer with fast dynamic contrast-enhanced MR imaging. Radiology 207:791-797
32 Padhani AR (2002) Dynamic contrast-enhanced MRI in clinical oncology: current status and future directions. J Magn Reson Imaging 16:407-422
33 Padhani AR, Hayes C, Assersohn L, et al. (2006) Prediction of clinicopathologic response of breast cancer to primary chemotherapy at contrast-enhanced MR imaging: initial clinical results. Radiology 239:361-374
19 34 Padhani AR, Hayes C, Landau S, Leach MO (2002) Reproducibility of quantitative
dynamic MRI of normal human tissues. NMR Biomed 15:143-153
35 Mitchell CL, O'Connor JP, Jackson A, et al. (2010) Identification of early predictive imaging biomarkers and their relationship to serological angiogenic markers in patients with ovarian cancer with residual disease following cytotoxic therapy. Ann Oncol 21:1982-1989
36 Padhani AR, Husband JE (2001) Dynamic contrast-enhanced MRI studies in oncology with an emphasis on quantification, validation and human studies. Clin Radiol 56:607-620
20
FIGURES
Figure 1: Regions of interest (ROI)
A: Axial T2-weighted image (TR=6790, TE=89) B: Axial DCE T1-weighted image (TR=27, TE=2.24)
On axial or axial oblique plane DCE T1-weighted images, ROIs were drawn over the external iliac artery (continuous black line = ROI) and the solid tissue of the adnexal mass (dotted white line = ROI). In this example, the adnexal mass was a left ovarian fibroma which corresponded to a purely benign solid adnexal tumour
Figure 2: Typical adnexal enhancement curves of malignant and benign adnexal tumours
Figure 3: Comparison of the accuracy of different AUC of dynamic parameters
Figure 4: Comparison of tissue blood flow (FT ) and lag time (Dt) between different
subtypes of malignant ovarian tumours
21 APPENDIX
In the two-compartment model shown in Figure 2, measurements are translated into quantities of contrast agent in voxels of tissue as follows:
T T T e c T T e c T T T T art art art art b art art art art n q n q q n V Q Q n V Q k n q n C n V Q k + = + + = + + = + = + = + = + = µ µ ,
where µ are the measures of the contrast enhancement S(t)-S(0) in arterial and tissue regions, with S the MRI intensity at a given time t, and the indices indicating the arterial (art), tissue (T), capillary (c) and interstitial (e) zones; V are the volumes of the regions and Q the contrast agent quantities in these regions, and q are the equivalent quantities per volume of the corresponding total measured region. Noise is represented by n and the linear coefficient between contrast enhancement and
concentration by k. Cb,art is the contrast agent concentration in the artery.
Intermediate plasma variables are defined in the blood compartment for a more readable pharmacokinetic model: the tissue plasma volume Vp = (1-Hc)⋅Vb and the tissue plasma perfusion Fp= (1-Hc)⋅Fb, where Hc is the hematocrit in small vessels. Then, the incoming plasma concentration can be determined, at each time t, by:
(
)
(1 )) (
, t q t Dt Ha
Cpart = art − −
where Dt is the artery to tissue delay, corresponding to the time necessary for the blood to go from the large artery (AIF measure) to the arterioles of the tissue of interest, and Ha the hematocrit in large arteries. The outgoing plasma concentration is:
( )
pc vein
p
t
q
t
v
C
,(
)
=
where t min is the minimal arteriole to venule delay and Vp is the plasma volume fraction defined by
vp=Vp/VT. The pharmacokinetic two-compartmental model can then be written as follows:
(
)
⋅ − ⋅ = ⋅ + ⋅ − − ⋅ = e e c p e e e c p vein p art p p c q v PS q v PS dt dq q v PS q v PS t C t C F dt dq ) ( ) ( , ,where dq/dt is the time derivation of the quantity q of the agent in the capillary (c) and interstitial (e) compartments and PS is the permeability-surface product and where the interstitial volume fraction ve is
defined by ve=Ve/VT. When C and q are replaced by μ, the factor k, found in each term of the equation, is
22
TABLES
Table 1: Morphological MR characteristics of adnexal tumours
MR findings Benign (n=18) Malignant (n=38) P Size of tumour (mm) 70.5 (45–110)* 74 (49–117)* 0.74 Purely solid Mixed 50% (9) 50% (9) 26.3% (10) 73.7% (28) 0.12 Thickened septa 11.1% (2) 28.9% (11) 0.18 Vegetation 11.1% (2) 36.8% (14) 0.06 Solid portion 27.7% (5) 57.8% (22) 0.05 Size of solid tissue (mm) 34.5 (12–70)* 48.5 (26–60)* 0.52 * Median value (interquartile range)
Table 2: Quantitative DCE-MRI characteristics of adnexal tumours
Benign (n=18) Malignant (n=38) P FT (mL.min-1.100 mL-1) 16.1 (6.2–37.2) 95.2 (39.3–128.7) <0.0001 Vb (%) 12.1 (7.7–15.7) 24.0 (15.1–36.1) 0.0006 PS (mL.min-1.100 mL-1) 2.7 (1.4–7.0) 4.2 (3–6.8) 0.09 Ve (%) 18.1 (10.2–30.8) 11.7 (7.0–18.4) 0.04 Dt (s) 3.4 (1.4–7.9) 5.4 (3.3–7.1) 0.18 rAUC 0.15 (0.08–0.22) 0.34 (0.20–0.47) 0.0002
Values are median values (interquartile range).
P values were calculated with the Mann–Whitney test
FT= tissue blood flow, Vb= blood volume fraction; PS=permeability-surface area product;
23
Table 3: Accuracy of different dynamic MR parameters to differentiate benign from
malignant tumours Cut-off value Sensitivity (%) Specificity (%) AUROC FT (mL.min-1.100 mL-1) >39.5 73.7 88.9 0.862 (0.750–0.943) Vb (%) >13.4 86.8 72.2 0.787 (0.657–0.885) PS (mL.min-1.100 mL-1) >2.5 84.2 50 0.640 (0.501–0.764) Ve (%) >20.3 84.2 50 0.664 (0.525–0.784) Dt (s) >3.13 81.5 50 0.610 (0.470–0.737) rAUC >0.28 71.0 83.3 0.810 (0.683–0.902)