HAL Id: hal-01501992
https://hal.archives-ouvertes.fr/hal-01501992
Submitted on 7 Jul 2020HAL is a multi-disciplinary open access archive for the deposit and dissemination of sci-entific research documents, whether they are pub-lished or not. The documents may come from teaching and research institutions in France or abroad, or from public or private research centers.
L’archive ouverte pluridisciplinaire HAL, est destinée au dépôt et à la diffusion de documents scientifiques de niveau recherche, publiés ou non, émanant des établissements d’enseignement et de recherche français ou étrangers, des laboratoires publics ou privés.
Comparative study of methods to estimate hydraulic
parameters in the hydraulically undisturbed Opalinus
Clay
Catherine Yu, Jean-Michel Matray, Julio Gonçalvès, David Jaeggi, Werner
Gräsle, Klaus Wieczorek, Tobias Vogt, Erik Sykes
To cite this version:
Catherine Yu, Jean-Michel Matray, Julio Gonçalvès, David Jaeggi, Werner Gräsle, et al.. Comparative study of methods to estimate hydraulic parameters in the hydraulically undisturbed Opalinus Clay. Swiss Journal of Geosciences, Springer, 2017, 110, pp.85-104. �10.1007/s00015-016-0257-9�. �hal-01501992�
Swiss Journal of Geosciences
DB Experiment - Comparative study of methods to estimate hydraulic parameters in
the hydraulically undisturbed Opalinus Clay
--Manuscript
Draft--Manuscript Number:
Full Title: DB Experiment - Comparative study of methods to estimate hydraulic parameters in the hydraulically undisturbed Opalinus Clay
Article Type: Original Paper Corresponding Author: Catherine Yu
Institut de Radioprotection et de Surete Nucleaire FRANCE
Corresponding Author Secondary Information:
Corresponding Author's Institution: Institut de Radioprotection et de Surete Nucleaire Corresponding Author's Secondary
Institution:
First Author: Catherine Yu
First Author Secondary Information:
Order of Authors: Catherine Yu Jean-Michel Matray Julio Gonçalvès David Jaeggi Werner Grasle Klaus Wieczorek Tobias Vogt Erik Sykes Order of Authors Secondary Information:
Funding Information:
Abstract: The Deep Borehole (DB) experiment gave the opportunity to acquire hydraulic parameters in a hydraulically undisturbed zone of the Opalinus Clay at the Mont Terri underground laboratory (Switzerland). Three methods were used to estimate hydraulic conductivity and specific storage values of the Opalinus Clay formation and its bounding formations through the 248 m deep borehole BDB-1: application of a Poiseuille-type law involving petrophysical measurements, spectral analysis of pressure time series and in situ hydraulic tests. The hydraulic conductivity range in the OPA given by the first method is 4^10-14 to 7^10-13 m^s-1 with low vertical variability whereas in situ hydraulic tests suggest higher values up to 7^10-12 m^s-1. Core analysis provides economical estimates of the homogeneous matrix hydraulic properties but do not account for heterogeneities at larger scale such as tectonic conductive features. Specific storage values obtained by spectral analysis are consistent and in the order of 10-6 m-1, while formulations using phase shift and gain between pore pressure signals were found to be inappropriate to evaluate hydraulic conductivity in the Opalinus Clay. The values obtained are globally in good agreement with the ones obtained previously at the rock laboratory.
Suggested Reviewers: Kent Keller
2317,
Philippe Cosenza Université de Poitiers
Manuscript
Click here to view linked References
Click here to download Manuscript SJG_Yu_et_al.docx ±
1 2 3 4 5 6 7 8 9 10 11 12 13 14 15 16 17 18 19 20 21 22 23 24 25 26 27 28 29 30 31 32 33 34 35 36 37 38 39 40 41 42 43 44 45 46 47 48 49 50 51 52 53 54 55 56 57 58 59 60 1 2 3 4 5 6 7 8 9 10 11 12 13 14 15 16 17 18 19 20 21
DB Experiment - Comparative study of methods to estimate hydraulic parameters in the hydraulically undisturbed Opalinus Clay
Catherine Yu1) 2), Jean-Michel Matray1), Julio Gonçalvès2), David Jaeggi3), Werner Grasle4), Klaus Wieczorek5), Tobias Vogt6), Erik Sykes7)
1) Institut de Radioprotection et de Sûreté Nucléaire, 31 Allée du Général Leclerc, F92260 Fontenay-aux-Roses, France
2) Aix Marseille Université UMR 6635 CEREGE Technopôle Environnement Arbois- Méditerranée BP80 F13545 Aix-en-Provence Cedex 4, France
3) Federal Office of Topography swisstopo, Seftigenstrasse 264, 3084 Wabern, Switzerland
4) Federal Institute for Geosciences and Natural Resources (BGR), Stilleweg 2, 30655 Hannover, Germany
5) Global Research for Safety (GRS), Schwertnergasse 1, D-50667 Cologne, Germany
6) National Cooperative for the Disposal of Radioactive Waste (Nagra), Hardstrasse 73, 5430 Wettingen, Switzerland
7) Nuclear Waste Management Organization, 22 St. Clair Ave. E., Toronto, Ontario, Canada
22 Running title: Hydraulic parameters détermination in the Opalinus Clay at the Mont Terri 2 23 rock laboratory
4 5
6 24 Keywords: Mont Terri rock laboratory, argillaceous formation, Opalinus Clay, hydraulic well 7
8 25 tests, Poiseuille-type law, harmonic tidal analysis 10 11 26 12 13 14 15 16 17 18 19 20 21 22 23 24 25 26 27 28 29 30 31 32 33 34 35 36 37 38 39 40 41 42 43 44 45 46 47 48 49 50 51 52 53 54 55 56 57 58 59 60 61 1
27 28 29 30 31 32 33 34 35 36 37 38 39 40 41 42 Abstract
The Deep Borehole (DB) experiment gave the opportunity to acquire hydraulic parameters in a hydraulically undisturbed zone of the Opalinus Clay at the Mont Terri underground laboratory (Switzerland). Three methods were used to estimate hydraulic conductivity and specific storage values of the Opalinus Clay formation and its bounding formations through the 248 m deep borehole BDB-1: application of a Poiseuille-type law involving petrophysical measurements, spectral analysis of pressure time series and in situ hydraulic tests. The hydraulic conductivity range in the OPA given by the first method is 4-10"14 to 7-10"13 m-s"1 with low vertical variability whereas in situ hydraulic tests suggest higher values up to 7-10"12 m-s"1. Core analysis provides economical estimates of the homogeneous matrix hydraulic properties but do not account for heterogeneities at larger scale such as tectonic conductive features. Specific storage values obtained by spectral analysis are consistent and in the order of 10"6 m"1, while formulations using phase shift and gain between pore pressure signals were found to be inappropriate to evaluate hydraulic conductivity in the Opalinus Clay. The values obtained are globally in good agreement with the ones obtained previously at the rock laboratory.
43 44 45 46 47 48 49 50 51 52 53 54 55 56 57 58 59 60 61 62 63 64 1 Introduction
Based on favourable confining properties, such as low permeability, strong rétention and self- sealing capacities, clay formations are the preferred host rock option for a deep geological repository of long-lived, intermediate and high level radioactive waste in several countries including France, Belgium and Switzerland. In the latter country, the Opalinus Clay (OPA) has been selected as a potential host rock for a disposal facility (Nagra, 2002) and has been studied at the Mont Terri Underground Rock Laboratory since 1996. The laboratory is located at a depth of ca. 280 m, in the security gallery of the A16 Transjurane motorway, which crosses the Jura Mountains in north-western Switzerland.
The accurate hydraulic characterisation of low permeability formations is of utmost importance to ensure the safety of a geological repository. Hydraulic properties can be estimated by various laboratory and field experiments (Van der Kamp, 2001; Yu et al., 2013), including empirical methods based on the rock matrix properties (Chapuis and Aubertin, 2003), falling head or constant head permeameter tests in laboratory (Boulin et al., 2012), and in situ field tests that rely on measurement of pore pressure or water level changes due to tidal natural loading (Bredehoeft, 1967; Merritt, 2004; Jiang et al., 2013) or artificial application of an hydraulic pressure different from the static formation pressure (Neuzil, 1982; Butler, 1998; Mejias et al., 2009). As these methods are carried out from sub-millimetre to hectometre investigation scales, scale dependency can affect the results (Keller et al., 1989; Neuzil, 1994).
This paper compares three different techniques to estimate hydraulic properties of the Opalinus Clay: application of a Poiseuille-type law involving petrophysical measurements, in situ packer tests and spectral analysis of pore pressure time series.
65 66 67 68 69 70 71 72 73 74 75 76 77 78 79 80 81 82 83 84 85 86 87 88 89 2 Geological setting
The Opalinus Clay at the Mont Terri site is a moderately overconsolidated claystone Aalenian-Toarcian aged stratigraphically, overlain by 800 m of Middle to Late Jurassic limestones, marls and shales, and underlain by 400 m of Early Jurassic to Triassic marls and limestones, dolomites and anhydrites (Fig. 1). The true lithological thickness of the clayey formation is 130 m and its apparent thickness in the area reaches 160 m due to thrusting and faulting. A period of marine regression occurred between 100 and 25 Ma, leading to a subaerially exposure of the top of the Malm limestone. Starting about 40 Ma, the rifting of the Rhine Graben affected Northern Switzerland, resulting in considerable uplift of the area in the mid-Tertiary and followed by down-warping and burial under late Tertiary sediments. The Opalinus Clay reached a burial depth of 1000 m and 1700 m respectively during these two phases of subsidence. Late Alpine folding during the late Miocene to Pliocene (about 10 to 2 Ma) formed the Folded Jura. Erosion exposed the core of the Mont Terri anticline towards 2.5 Ma, and allowed fresh water infiltration to the Middle Jurassic limestones. Similarly, infiltration to the Early Jurassic limestones would have started in the Quaternary, around 350 thousand years ago (Pearson et al., 2003).
Three main facies were identified within the Opalinus Clay (Blaesi et al., 1991): a shaly facies in the lower part of the sequence, a thin carbonate-rich sandy facies in the middle part of the formation, and a sandy facies interstratified with shaly facies in the upper sequence. The shaly facies mineral composition includes 27-78 % of clay minerals (illite, chlorite, kaolinite and illite-smectite mixed layers), 4-29 % of carbonates, 10-32 % of quartz, and accessory feldspars, pyrite and organic matter (Bossart and Thury, 2008).
Several minor tectonic faults and a larger fault zone called “Main Fault” can be observed in the Opalinus Clay (Nussbaum et al., 2001). Nagra’s investigations in deep boreholes at Riniken, Weiach, Schafisheim and Benken revealed that the tectonically disturbed zones are
90 91 92 93 94 95 96 97 98 99 100 101 102 103 104 105 106 107 108 109
hydraulically similar to the undeformed matrix (Johns et al., 1994; Gautschi, 2001a). Based on permeameter tests and in situ packer tests, hydraulic conductivity values in tectonically disturbed zones are in the range of 2-10-14 to 2-10-12 m s-1, and specific storage ranges from 2-10-7 to 1.7-10-4 m-1 (Marschall et al., 2005).
3 BDB-1 Deep Borehole
The Deep Borehole experiment (DB) aims at evaluating the hydrogeological properties and processes of undisturbed Opalinus Clay at the Mont Terri Underground Rock Laboratory. For the first time in this laboratory, a 247.5 m long 45° downward inclined borehole has been drilled through the Opalinus Clay and the bounding formations. The stratigraphic sequence crossed by the borehole is presented in Figure 2a and is described in detail in Jaeggi et al (2017, this issue). The borehole was entirely cored for stratigraphic, petrophysic, mineralogical and geochemical studies. The OPA section was drilled with air as drilling fluid. Drilling was immediately followed by the installation of a multipacker system (Fierz and Rosli, 2014) consisting in five double packer measuring intervals and an interval port within the Opalinus Clay, a single packer in the Staffelegg formation at the bottom of the borehole, and a further double packer interval isolating the lowermost zone of the Passwang Formation (Fig. 2b and c). Intervals were equipped with sensors that enable long term monitoring of pressure and temperature (Table 1). Pressure sensors are located at the surface and connected by stainless steel lines to the interval fluids, whereas temperature sensors are located downhole inside the intervals.
110 111 112 113 114 115 116 117 118 119 120 121 122 123 124 125 126
4 Techniques for hydraulic parameters évaluation
4.1 Petrophysical model
Assuming a plane-parallel geometry, the intrinsic permeability can be computed across an argillaceous formation using a semi-empirical Poiseuille-type law (Kostek et al. 1992; Pape et al., 1999; Tremosa, 2010):
b2
k ~3F (1)
where k is the intrinsic permeability [m2], b is the half-pore size [m] and F is the formation factor [-], which accounts for the tortuosity of the porous media and can be determined using the Archie’s law (Archie, 1952):
F = M-m (2)
where œ is the porosity [-] and m is the cementation factor. The formation factor can also be related to diffusion parameters (Boving and Grathwohl, 2001; Van Loon and Mibus, 2015):
F = (3)
where Dw is the diffusion coefficient in pure water [m2 s-1] and De is the effective diffusion coefficient [m2 s-1].
The half-pore size can be computed from petrophysical parameters according to the following relation based on a mass balance equation (Neuzil, 2000; Altinier, 2006):
b = œ
(1 - u)psAs (4)
where b is the half-pore size [m], œ is the porosity [-], ps is the grain density [g m-3] and As is the specific surface area [m2 g-1].
127 128 129 130 131 132 133 134 135 136 137 138 139 140 141 142 143 144 145 K = ^P£l Vf (5)
where K is the hydraulic conductivity [m-s'1], pf is the fluid density [kg m-3], g is the gravity accélération [m s'2] and gf is the fluid dynamic viscosity [Pa s].
Fluid dynamic viscosity was estimated according to Mercer et al. (1975):
gf = (5.38 + 3.84 - 0.26A2) • 10-3
with A = T- 150
100
(6)
(7)
where gf is the fluid dynamic viscosity [Pa s] and T is the temperature [°C].
The Unesco equation of state (Unesco, 1981) was used to determine the fluid density as a function of salinity, temperature and pressure.
Determination of petrophysical parameters were performed in laboratory on representative element volume samples taken from the central part of BDB-1 drillcores. Porosity and water contents were determined by weighing before and after oven-drying at 105°C until mass stabilisation. Density and degree of saturation were calculated based on Archimede’s principle after sample immersion into kerdane following the experimental protocol first proposed by Monnier et al. (1973) and later adapted by Matray et al. (2007) for argillite samples. Grain density was evaluated using a helium pycnometer (Micromeritics® AccuPyc II 1340) on oven-dried samples and also recalculated from results of X-Ray diffraction measurements on bulk samples.
4.2 In situ hydraulic testing experiments
Hydraulic in situ testing in boreholes, also referred as well testing, is the most common method used in groundwater and oil industries to acquire the hydraulic properties of geological formations. Pulse withdrawal tests and constant rate withdrawal tests were
146 147 148 149 150 151 152 153 154 155 156 157 158 159 160 161 162 163 164 165 166 167 168 169
conducted in BDB-1 borehole, from March 11th to November 16th 2015. During a withdrawal pulse test, pressure is lowered abruptly by opening and closing the downhole shut-in valve (Bredehoeft and Papadopoulos, 1980; Neuzil, 1982). These tests are preferred as initial phase because they give an immediate measurement of the system compressibility and generally require shorter time frame than pumping tests. Given its quick hydraulic response, performing more pulse tests on interval 1 (Staffelegg Formation, Fig. 2b) was possible, whereas two pulse tests were carried out on each of the other intervals.
Constant rate withdrawal test parameters such as flow rate and flow duration must be chosen with caution. In low permeability media, high flow rates can lead to desaturation of the measuring intervals and extreme drops in pressure. Therefore, a flowmeter able to sustain a very low pumping rate of 0.3 g h-1 for several days (Bronkhorst® p-flow L01) was used to test intervals 2 to 7 (Fig. 2b), for which the hydraulic responses to pulse testing were the slowest. Interval 1 was tested with a higher flow rate of 5 ml min-1 using a Bronkhorst® Liqui-Flow L10. Experimental setups for both kind of tests and associated hydraulic responses are respectively reported in Figure 3 and 4. Flowmeter failed during the testing of intervals 2 and 6 and approximatively two months of pressure recovery were required before performing a second test on these test chambers.
Hydraulic test data were analysed using the well-test interpretation program nSIGHTS, which was developed by INTERA for Sandia National Laboratories. The code is based on Barker’s equation (1988), which describes flow in an n-dimensional space, and does not restrict to integer dimensions. Uncertainties associated with the fitting parameters are evaluated by performing random perturbation analyses. Plausibility ranges for various parameters were defined prior to the parameter optimisation procedure (Table 2). During the inverse parameter estimation, nSIGHTS provides best-fit results within these pre-defined ranges. Uncertainties
170 171 172 173 174 175 176 177 178 179 180 181 182 183 184 185 186 187 188 189 190 191
associated with the fitting parameters are evaluated by performing random perturbation analyses (not detailed in this paper).
4.3 Tidal analysis on pore pressure time series
Rotational and gravitational forces exerted by the sun and the moon on the Earth induce latitudinal and longitudinal strains within the solid matrix and cause deformations with two dominant periods: diurnal and semi-diurnal. The tidal gravitational potential can be resolved into a finite set of tidal components described as harmonics, which are sinusoidal functions of given amplitude and frequency (Doodson and Warburg, 1941; Cutillo and Bredehoeft, 2011). Five main components account for about 95% of the tidal potential: the M2 and N2
semidiurnal lunar tides, the S2 semidiurnal solar tide, the O1 diurnal lunar tide, and the K1
diurnal lunar-solar tide.
Seasonal or climatic variations, anthropogenic activities and tidal forces induce hydraulic pressure changes in geological formations. The amplitude of the pressure response depends on the poroelastic response of the aquifer matrix. Pressure signal can therefore be analysed to determine hydrogeological properties, such as specific storage, effective porosity and hydraulic conductivity. The models used in this work are based on Terzaghi’s (1936) effective stress concept, which assumes a constant total stress distributed between grains and fluid effective stress. Bredehoeft (1967) related tidal strain to specific storage:
Ss = |A£|
\àh\ (8)
where Ss is the specific storage [m-1], |Ae| is the amplitude of volumetric strain fluctuation fixed at 2-10"8 for the M2 tide (Melchior, 1978), and |Ah| is the amplitude of relative pressure
head fluctuations [m].
(9) 192 193 194 195 196 198 9 10 11 12 13 14 15 16 17 197 18 19 20 21 22 23 24 25 26 27 28 29 30 31 32 33 199 34 35 36 37 38 201 39 40 41 42 43 203 44 45 46 204 47 48 205 49 50 5° 206 52 53 207 54 55 208 57 58 209 59 60 200 202 EwSsB m — ---Pf9
where rn correspond to the porosity [-], Ew is the stiffness modulus of water, equal to 2.05 GPa, Ss is the specific storage [m-1], B is the barometric efficiency [-], which reflects the elastic response of the system, pf is the fluid density, and g is the gravity acceleration equal to 9.81 m s-2.
Hydraulic conductivity was estimated with formulations using the M2 harmonic amplitude
and phase shift (Boldt-Leppin and Hendry, 2003; Timms and Acworth, 2005), measured at two depths, zi and Z2 [m] :
vAmpff\_çf f \ K(Zl z2) \Jm2 )-^s\Jm2 ) -i \)m2) ln \AZ2 (Zm2)/ -2 K «A(Aj -^(Aü,. N-1
'Oi - z2) (fM2) 1 l-A^(/M2)
2
(10)
(11)
where KvAmp is the “amplitude effective hydraulic conductivity”, Azi and Az2 [kPa], are the M2
earth tide amplitude associated to the sensors, Ss [m-1] is the arithmetic mean of the effective specific storage coefficients obtained individually for the two sensors, fu2 [s-1] is the frequency of the M2 earth tide equal to 2.236-10-5 Hz, KvÂv [m s-1] is the “phase effective hydraulic conductivity”, and Aç [rad] is the spectral phase shift between the sensors.
Spectral analysis of BDB-1 borehole pressure dataset was performed using the Multi- Statistical Analysis Tool (MuSTAT), jointly developed by the Institut de Radioprotection et de Sûreté Nucléaire and the Institut National Polytechnique de Toulouse (Fatmi et al., 2008; Ababou et al, 2012; Bailly et al., 2014). Consisting in a Python code associated with toolboxes programmed in Matlab, the package provides automatic features: a) preprocessing of time series, that enables the detection of time gaps and spurious values, as well as data
210 211 212 215 218 220 8 213 10 11 12 214 13 14 15 16 17 216 18 19 20 217 21 22 23 24 25 219 26 27 28 29 30 221 31 32 222 33 34 35 223 36 37 38 39 40 225 41 42 43 44 45 227 46 47 48 228 49 50 51 52 53 230 54 55 231 56 224 226 229 57 58 59 60 61 232
reconstruction by autoregressive first order process; b) processing of a single time series; c) cross-analysis of two time series.
5 Results at various scales of investigation
5.1 Sub-millimeter to centimeter scale
5.1.1 Petrophysical parameters
The petrophysical parameters necessary for the computation of intrinsic permeability are presented in Figure 5 as a function of distance along BDB-1 borehole.
The water accessible porosity is 13.0 % in the Opalinus Clay, with a lower porosity of 12.0 % in the sandy facies compared to the shaly facies, which exhibit a mean porosity of 13.5 %. These values are lower than the mean value of 18 % suggested by previous studies performed at the Mont Terri tunnel level. The Passwang Formation presents slightly lower porosity values ranging between 8.1 % and 14.6 % with a mean value of 12.2 %. The Hauptrogenstein is characterized by the lowest porosity with a mean value of 3.9 %.
Grain densities obtained by helium pycnometry have a mean value of 2.74 g cm-3 in the Opalinus Clay overlying formations and of 2.72 g cm-3 in the argillaceous layer. The lowest grain densities are found in the bituminous Rietheim Member of the Staffelegg Formation (see Fig. 1a), ranging between 2.3 and 2.4 g cm-3. These low values are probably linked to the presence of organic matter.
The Passwang formation, which directly overlays the Opalinus Clay, does not reveal clear petrophysical discrepancies with the clay formation except for the specific surface area. This parameter has an average value of 13 m2 g-1 in the carbonated section of the borehole and shows significant fluctuations linked to the marly composition of the Passwang formation. A higher mean value of 29 m2 g-1 characterises the Opalinus Clay.
233 234 235 236 237 238 240 9 10 11 12 13 14 15 239 16 17 1 19 20 241 21 22 23 24 25 26 243 27 28 29 30 31 245 32 242 244 33 246 34 35 36 247 37 248 249 251 253 38 39 40 41 42 43 250 44 45 46 47 48 252 49 50 51 52 53 254 54 55 56 255 57 58 256 59 60
The Opalinus clay is also characterised by a low pore size. Analyses of nitrogen adsorption and desorption isotherms show that 70 % to 93 % of the connected porous network is constituted of mesopores (pore diameter between 2 and 50 nm), with a mean size of 13 nm. Calculation of the half-pore size from petrophysical parameters, following equation (4), gives mean pore sizes in the range of 3.1 to 7.3 nm.
Ranging between 1.3 and 5.4 (Horseman et al, 1996), the cementation factor was estimated to be close to 2 for compacted and deeply buried sediments (Ullman and Aller, 1982; Tremosa, 2010). Van Loon et al (2003b) related the effective diffusion coefficient of tritium measured in the Opalinus Clay to its porosity using a cementation factor of 2.5.
5.1.2 Intrinsic permeability and hydraulic conductivity
The intrinsic permeability profiles (Fig. 6a) show a low vertical variability through the Opalinus Clay, where it ranges between 5.79-10"21 and 6.14-10"20 m2 if a cementation factor varying between 2 and 2.5 is taken. For a cementation factor of 2.5, the mean intrinsic permeability is 7.7-10"21 m2 for the Opalinus Clay shaly facies and 7.9 -10"21 m2 for its sandy facies. These values are in good agreement with the range of M0'21 and 6-10"20 m2 obtained by gas injection experiments performed at the Mont Terri laboratory (Marschall et al., 2005). Based on the same cementation factor, difference can be seen in the carbonate-rich sandy facies, where values are about three times higher than in the shaly and the sandy facies. With a higher exponent m = 3, the resulting intrinsic permeability has a mean value of 7.6-10"21 m2 and no clear distinction arises between the different facies. The intrinsic permeability values computed in the Passwang formation and the Staffelegg formation are much more heterogeneous and vary between 1.5-10"21 and 5.8-10"20 m2.
The corresponding hydraulic conductivity profiles are presented (Fig. 6b) and show similar trends compared with the intrinsic permeability profiles. The hydraulic conductivity obtained
257 258 259 260 263 264 265 271 10 261 11 12 262 13 14 15 16 17 1 19 20 21 22 23 266 24 25 267 26 27 2 7 268 29 30 269 31 32 33 270 34 35 36 37 38 39 40 41 42 43 44 45 46 47 48 274 49 50 275 51 52 53 276 54 55 277 56 57 58 59 60 61 272 273 278
for the Opalinus clay ranges between 5.8-10"14 and 5.8-10"13 m s-1 for a cementation factor varying between 2 and 2.5. For a cementation factor of 2.5, the formation is characterised by a mean hydraulic conductivity of 8.3-10"14 m s-1. No clear discrepancy between the shaly facies and the sandy facies is revealed, with respective mean values of 7.3-10-14 and 6.9-10-14 m s-1. These values are consistent with the range of 2-10-14 to M0-12 m s-1 reported in previous studies (Bossart and Thury, 2008). The Passwang formation and the Staffelegg formation present a various range of hydraulic conductivities between 1.6-10-14 and 6.1 • 10-13 m s-1.
5.2 Decimeter to meter scale: in situ hydraulic tests results
Pore pressure should be fully recovered from artificial disturbance induced by the installation procedure (e.g. drilling, logging, equipment installation) before starting a hydraulic test.Steady state was considered to be reached when the tidal components were detected on all pore pressure time series acquired in BDB-1 borehole, which indicate that the system is fully pressurised and saturated (see section 5.3.1).
The observed compressibility of the test zone (Ctz) was deduced from pulse tests and computed according to:
Qz 1 dV
vTzdP (12)
where Vtz [m3] is the shut-in volume, dV [m3] is the withdrawn volume and dP [Pa] is the pressure
variation. Test zone compressibility in BDB-1 borehole varies 9.1 • 10-10 Pa-1 and 2.4-10"9 Pa-1 (Fig. 7),
approximately up to a factor of 5 larger than water compressibility, which is equal to 4.8T0"10 Pa-1 at
10 °C (Kell, 1975). The discrepancy can be attributed to the mechanical compliance of the equipment.
Semi-logarithmic plots presented in Figure 8 give a qualitative comparison of the hydraulic behaviours characterising the different tested intervals. Degree of pore pressure dissipation (U) and normalised drawdown pressure (U„orm) are respectively defined by the following equations:
9 279 10 11 280 12 13 14 281 15 16 17 18 19 283 20 21 22 23 24 25 26 27 28 29 30 31 32 33 34 289 35 36 37 38 39 291 40 41 42 43 44 293 45 46 4 7 294 48 49 295 50 51 52 53 54 297 55 56 57 58 59 299 60 282 284 285 286 287 288 290 292 296 298 U = Ut~U o U-min — Uo (13) Ut Umin Uo — Umin (14)
where Ut [kPa] is the pore pressure at time t, Uo [kPa] is the hydrostatic pore pressure in situ and Umin
[kPa] is the pore pressure reached after pulse application or at the end of the pumping phase.
Discrepancies in the degree of dissipation can be observed between tests performed on a same interval (Fig. 8a). Constant rate withdrawal tests were carried out using the same flow rate of 0.3 g h-1 for different durations. To compare the evolution of pore pressures in the measuring intervals during pumping phase, Pmin was taken to correspond to the shortest pumping duration in the calculation of Unorm. If specific storage is assumed homogeneous through the Opalinus Clay, the order from left to right on Figure 8b gives an indication of decreasing permeability.
The application of a composite model, which takes into account a damaged skin zone, was required for most of the test numerical interpretations. Taking as an example the first pulse test carried out on BDB-1 Interval 2, Figure 9 shows a comparison of the residuals (measured value minus simulated value) to that of a normal distribution, using a homogeneous model and a composite one. The homogeneous model appears to be unsatisfactory because the residuals are not normally distributed, which indicates the presence of a systematic error.
Pulse tests and constant rate pumping tests results are respectively compiled in Table 3. Pulse testing revealed the highest hydraulic conductivity values in the Staffelegg Formation (Interval 1, see Fig. 2b) with best fit values ranging from 2.M0-10 to 5.9-10-10 m s-1. Located in the basal shaly facies of Opalinus clay (Interval 2), the bottom part of the main fault zone is characterised by conductivity values from 3.1 • 10-12 to 7.3-10-12 m s-1 and do not differ from the upper shaly facies represented by Interval 4 (Fig. 10) and 5, whose best estimates are up to
1 2 3 4 5 6 7 303 300 301 302 305 9 10 304 11 12 13 14 15 306 16 17 18 307 19 20 21 22 23 24 25 26 27 28 29 30 31 32 33 34 35 313 36 37 38 39 40 41 42 43 44 45 317 46 47 48 49 50 319 51 52 53 54 55 321 56 57 58 59 60 323 61 308 309 310 311 312 314 315 316 318 320 322
4.2-10"12 m s-1. The lowest values are found in the sandy facies (Interval 6, best fit values up to 2.7-10"13 m s-1), and the carbonate-rich sandy facies (Interval 3, best fit values up to 5.M0- 13 m s-1). The basal part of the Passwang formation, represented by Interval 7, shows similar hydraulic conductivity values to Opalinus clay (5.8-10-13 to 1.4-10-12 m s-1).
The analyses results of the constant flowrate withdrawal tests are quite consistent with those obtained from pulse tests. Indeed, a similar trend can be observed with slightly higher permeability values in the shaly facies than in the sandy facies of Opalinus Clay.
Specific storage and flow dimension estimates are highly variable. One issue with single well hydraulic testing is that the volume of tested rock is limited to the immediate vicinity of the well.
5.3 Hectometer scale: tidal analysis
5.3.1 Tidal identification in BDB-1 pore pressure series
Detection of tidal components was performed on the pore pressure time series monitored by the sensors placed in BDB-1 borehole, with an acquisition time step set at 15 minutes. The four largest amplitude tidal components, O1, K1, S2 and M2 appear on all processed signals at
the exact expected frequencies for time series between September 1st 2014 and March 10th 2015 (Fig. 11).
The form ratio is defined as the sum of the two main diurnal component amplitudes, K1 and
O1, divided by the sum of the two main semi-diurnal component amplitudes, M2 and S2
(Wiegel, 1964). Tidal deformation through the Opalinus Clay at Mont Terri is characterized by a form ratio varying between 0.84 and 1.35, which indicates a mixed, mainly semi-diurnal tide (Table 4). The maximum value is found in the interval located in the Passwang formation, for which the diurnal components have slightly higher amplitudes than the semi-diurnal ones. Except for this interval, the M2 tide presents the highest amplitude among the four major tides.
324 325 326 327 19 328 11 12 13 14 15 16 17 1 19 20 332 21 22 23 24 25 334 26 27 28 29 30 336 31 32 33 34 35 36 37 38 39 4 0 340 41 42 43 44 4 5 342 46 47 48 49 5 0 344 51 52 53 54 55 56 57 58 59 60 348 329 330 331 333 335 337 338 339 341 343 345 346 347
5.3.1 Hydraulic parameters computation
The results of spécifie storage coefficient computation are given in Table 5. Spécifie storage values are ranging between 1.08-10"6 and 1.56-10"6 m-1 in the Opalinus Clay and are higher for the adjacent formations (2.35-10"6 m-1 for the Lower Dogger limestone and 3.08-10"6 m-1 for the Staffelegg Formation). These estimates are consistent with the range given in the literature, deduced from in situ packer tests and permeameter tests for the Opalinus Clay shaly facies: between M0-7 and E10-4 m-1, with a best estimate at 2-10-6 m-1 (Bossart and Thury, 2008).
Effective dynamic porosity values obtained using the M2 tide (Table 6) are globally in well
agreement with those obtained from petrophysical measurements. Indeed, coherent values between 8% and 24% are obtained by cross-analyses of measuring intervals located in the Opalinus Clay. Statistical analysis carried out in previous studies on Mont Terri samples (Fatmi, 2009, Bailly and Matray, 2015) revealed very low range values between 1% and 4% at the tunnel level. These unexplained low values could be related to the hydraulically disturbed state of the studied area and desaturation phenomena.
Hydraulic conductivity values obtained in the saturated part of the claystone by cross-analysis (Table 6) are much higher than those obtained by other techniques. Indeed, high conductivities ranging between 5.7-10-5 m-s-1 and 1.4-10-7 m-s-1 are found in the Opalinus Clay. These values are 6 to 8 orders of magnitude higher than the range expected from literature data, suggesting that the method is not appropriate for this formation. Discrepancies up to three orders of magnitude between laboratory hydraulic conductivity results and tidal analysis results were also reported by Boldt-Leppin et al. (2003) who studied the King site claystone formation (Canada). These discrepancies were explained by scale factor effects and the presence of fractured area.
Bailly and Matray (2015) performed statistical analysis on pore pressure time series acquired in the BCD-3 borehole located at the Mont Terri tunnel level. They obtained hydraulic
1 2 3 4 5 6 7 352 349 350 351 353 355 356 358 360 362 9 10 11 12 354 13 14 15 16 17 1 19 20 21 357 22 23 24 25 26 359 27 28 29 30 31 361 32 33 34 35 36 363 37 38 364 39 40 41 365 42 43 44 45 46 367 47 48 49 50 51 369 52 53 54 55 56 371 57 58 59 60 61 366 368 370
conductivities ranging between 1.9-10"10 and 7.5-10"11 m-s"1 in the unsaturated part of the Opalinus clay by applying the same method on the S1 solar diurnal tide. The M2 tide was not
found in the studied pore pressure time series due to suction conditions associated to the rock laboratory level. The study also suggested that the structures observed in this borehole were hydraulically conductive, meaning that the Opalinus clay true permeability should be even lower than the range given by tidal analysis.
6 Discussion
6.1 Comparability of laboratory tests and in situ tests results
Reliable estimates of permeability and specific storage that describe the bulk hydraulic behaviour are needed for the evaluation of contaminant leakage in geological formations. Linking the results of laboratory tests to bulk characteristics at the regional scale is not straightforward and the meaning of measured values has to be interpreted. Sedimentary rocks are generally associated with anisotropic properties such as permeability, diffusion coefficient and mechanical features. In the Opalinus Clay, which is a overconsolidated clay, a moderate permeability anisotropy ratio of 5.5 was estimated based on laboratory permeameter tests (Münoz et al., 2003, Croisé et al., 2004, Fernàndez-Garcia et al., 2007).
The petrophysical model is based on a conceptual parallel plane geometry which would be associated to a flow orientation parallel to bedding planes. Since BDB-1 borehole was drilled perpendicular to bedding plane, the main solicited direction for fluid flow during hydraulic testing is also parallel to stratification. For its part, tidal analysis is mainly based on gravitational forces that propagate radially from the center of the Earth and should result, given the setting of the Mont Terri anticline, in composite values of parallel and perpendicular to bedding permeabilities.
1 2 3 4 5 6 7 375 372 373 374 376 9 10 11 12 377 13 14 15 378 16 17 1 19 20 380 21 22 23 24 25 26 27 383 28 29 30 31 32 33 34 35 386 36 37 38 39 40 388 41 42 43 44 45 46 47 391 48 49 50 51 52 393 53 54 55 56 57 58 59 60 396 379 381 382 384 385 387 389 390 392 394 395
Although the petrophysical model may be unsuited to carbonated formations, calculation was also performed on the Passwang formation and the Staffelegg formation, which shows similar petrophysical parameters. Another questionable point is the use of a constant value for the Archie’s exponent since this parameter depends on the nature of the porous medium. Consequentely, adapted values should be taken according to the evolution of rock facies along the stratigraphic sequence.
Fitting the cementation factor by comparing petrophysical results and estimates from hydraulic tests can be debatable. Indeed, the volume of solicited rock is higher in the latter case and takes greater account of formation heterogeneities and local open fractures. This point is clearly illustrated by the discrepancies observed for the Staffelegg formation, in which many fractures were evidenced by drillcore mapping. Indeed, petrophysical measurements on centimetre-scale samples do not take into account these hydraulically conductive structures and underestimate the values of bulk properties.
Archie’s law is rigorously an empirical relationship that links the electrical resistivity of saturated clay-free rocks and their porosity. However, an analogy can be made between the electrical potential and the concentration gradient. It has been shown that effective diffusion coefficient could be predicted by this relationship in a variety of clay and shales with a cementation factor ranging between 2 and 3 (Boving and Grathwohl, 2001; Van Loon et al., 2003b; Mazurek et al., 2009). Best fit values of hydraulic conductivity obtained from hydraulic testing are generally higher that those computed with the petrophysical law (Fig. 12a). Hydraulic conductivities higher than 10-12 m s-1 found in the Opalinus Clay shaly facies would be associated to illogical values of cementation factor inferior to 1.3, which was given for clean unconsolidated sand packs by Archie (1942).
Whether it be for pulse or constant withdrawal tests, the numerical interpretation of hydraulic tests suggests rather wide and unrealistic ranges of uncertainties for hydraulic conductivity
1 2 3 4 5 6 7 400 397 398 399 9 10 11 12 13 14 15 16 17 18 404 19 20 21 22 23 24 25 26 27 28 29 30 409 31 32 33 34 35 411 36 401 402 403 405 406 407 408 410 37 38 39 40 41 42 43 44 45 46 47 48 49 50 51 52 53 54 55 56 57 58 59 60 61 412 413 414 415 416 417 418 419 420
and spécifie storage. Covering several orders of magnitude and not tightly around the best estimâtes (Table 3), these uncertainties are probably linked to the large number of fitted parameters. Tidal analysis may be more representative than single well hydraulic testing for specific storage estimation (Fig. 12b), since the tidal deformation is applied to the entire rockmass.
6.2 Consistency with previous results
Numerous in situ and laboratory investigations have been carried out at the Mont Terri rock laboratory to characterize the hydraulic properties of the Opalinus Clay. Laboratory permeameter tests revealed conductivity values ranging from 6 to 12-10-14 m s-1 with high associated storage coefficient of 4.8-10-4 m-1 (Croisé et al., 2004). Figure 13 shows a compilation of permeability results obtained from packer tests (pulse, constant head and constant rate) performed previously at the Mont Terri site (AF Consult, 2012), along with data collected in BDB-1 borehole. Tests were mainly performed in boreholes oblique or normal to bedding drilled in area unaffected by the excavation damaged zone of the tunnel. Previous permeability values measured at the rock laboratory level range from 1.5-10-14 to 1.F10-9 m s- 1 with 55% of the values in the order of 10-13 m s-1. The best fit values obtained from BDB-1 hydraulic testing fall virtually in the expected range with higher values in the order of 10-12 m s-1 characterising the Opalinus Clay shaly facies.
Specific storage coefficients obtained by tidal analysis are rather homogeneous within the Opalinus Clay with values in the order of 10-6 m-1, which are comparable to the range of 2-10 6 to 5-10-6 m-1 found by Bailly and Matray (2015).
No significant correlation between the hydraulic conductivity and the different lithological facies was highlighted by Croisé et al (2004), Nussbaum and Bossart (2004) and AF Consult (2012) due to a lack of data from the sandy facies. Although best fit values obtained from
421 422 423 424 9 10 11 12 426 13 14 15 16 17 18 19 2 0 429 21 430 425 427 428 431 433 435 22 23 24 25 26 27 432 28 29 30 31 32 434 33 34 35 36 37 38 436 39 40 41 42 43 438 44 45 46 47 48 440 49 50 51 52 53 54 55 56 443 57 58 444 59 60 437 439 441 442
BDB-1 borehole indicate higher values in the shaly facies, uncertainty ranges make it difficult to conclude on a possible contrast. Sandstone lenses embedded in clay rich strata could affect the hydraulic behaviour of the unit not necessarily against its barrier function. Indeed, Opalinus Clay sandy layers are better cemented and display lower porosities (Fig. 5a). Microscopic observations in the sandy facies revealed precipitation of authigenic quartz, carbonates and kaolinite (Peters et al., 2011). On the other hand, porosity values measured in BDB-1 borehole are globally lower than those obtained at the rock laboratory tunnel level and may reflect the deconfinement and relaxation of stresses occurring at the latter location.
The Main fault that intersects the laboratory does not impact the barrier function of the Opalinus Clay. Indeed, the sealing of fault planes by calcite shear fibres and clay minerals induce small effect of tectonic deformation on the hydraulic properties of the Opalinus Clay (Nussbaum et al., 2011). This observation is supported by the consistency between the hydraulic tests performed in the intact shaly facies and those carried out in the interval crossing the fault zone. Similarly, no contrast can be identified on the different profiles obtained with the petrophysical model.
7 Conclusions
The Deep Borehole experiment enabled the acquisition of data in a fresh borehole penetrating the entire hydraulically undisturbed Opalinus Clay at Mont Terri. Therefore, the presented results are unique, because other hydraulic data at Mont Terri are or might be influenced by tunneling and experimental activities. Three methods with different investigation volumes were carried out and compared.
A model that links intrinsic permeability to petrophysical parameters gives values in the order of 10"20 m2, corresponding to hydraulic conductivities in the order of 10"13 m-s"1. Tidal analysis revealed itself not to be an appropriate method to compute hydraulic conductivity in
445 446 447 448 449 451 453 454 456 458 9 10 11 12 450 13 14 15 16 17 452 18 19 20 21 22 23 24 455 25 26 27 28 29 457 30 31 32 33 34 459 35 36 37 38 39 40 41 42 43 44 463 45 46 47 48 49 465 50 51 52 53 54 467 55 56 57 58 59 469 60 61 460 461 462 464 466 468
our study, giving values overestimated of several orders of magnitudes. However, this approach gives reasonable values for specific storage and effective porosity. As a third method, in situ hydraulic testing was performed using the multipacker system installed in BDB-1 borehole. Hydraulic conductivity values obtained by numerical inversion from pulse tests are consistent with those deduced from constant rate withdrawal tests, and suggest a vertical variability across the formation possibly due to local variations of the matrix structure, composition and cementation, or the presence of fractures. In conclusion, the hydraulic conductivity values of the DB Experiment agree well with previous hydraulic testing results performed in the hydraulically disturbed Opalinus Clay around the Mont Terri Underground Rock Laboratory. Therefore, future hydraulic testing in the laboratory outside the excavated damaged zone can be rated as comparable to undisturbed conditions. However, our results clearly show higher values (in the order of 10"12 m s-1) for the Opalinus Clay shaly facies than its sandy facies (in the order of 10-13 m s-1), which is consistent with microscopic observations (Peter et al., 2011). Further laboratory experiments using Hassler cells will be performed to characterise the Opalinus Clay permeability anisotropy.
Petrophysical analysis of drillcores and time-series analyses are complementary to hydraulic testing and can provide economical estimates of hydraulic parameters. These techniques involve different volumes of investigation. Core analysis, as well as laboratory permeameter tests, give the homogeneous matrix hydraulic properties but do not account for larger scale heterogeneities such as sedimentary and tectonic features. Moreover, analyses on core samples might be influenced by deconfining and alteration of the core material, thus resulting in biased values. Therefore, hydraulic testing in a fresh borehole is the recommended method for determination of hydraulic conductivity in overconsolidated clays. However, the pressure perturbations induced by drilling activities have to be taken into account for design and analyses of hydraulic testing. The dissipation of drilling and installation of instrumentation
470 471 472 473 9 10 11 12 475 13 14 15 16 17 1 19 20 21 22 23 24 25 26 27 28 29 30 31 32 33 34 35 36 37 38 39 40 41 42 43 487 44 45 46 47 4 8 489 49 50 51 52 53 54 55 56 492 57 58 59 60 474 476 477 478 479 480 481 482 483 484 485 486 488 490 491
induced pressure pertubations can be identified by the tidal components in the pore pressure time series. Our study showed that drilling the BDB-1 borehole with air as drilling fluid and a saturation with artificial porewater was an appropriate choice for our application, because: i) no mud-cake was created, ii) no artificial osmotic effects and borehole convergence were observed so far, iii) future water sampling can be carried out since there was no contamination with drilling mud, and iv) we reached fully undisturbed formation pressures after several months. The latter was possible to do so in an underground laboratory experiment, due no time and financial constraints, which are limiting factors on drill site for exploration boreholes. Therefore, in clay formations, particular care should be taken in the choice of drilling method and drilling fluid as well as borehole instrumentation materials, in order to obtain accurate hydraulic parameters.
Acknowledgments
This study was performed in the framework of the Deep Borehole experiment, financed by six partners of the International Mont Terri Consortium (Swisstopo, NAGRA, BGR, GRS, NWMO, IRSN).
The authors would like to thank Karam Kontar and Jocelyn Gisiger (Solexperts AG Company) for their technical support and realisation of hydraulic testing, as well as Christelle Courbet (IRSN) for advices on their interpretation. The MuStat package used in this paper is the result of previous works respectively done by: Alain Mangin (CNRS, Laboratoire d‘écologie des hyrosystèmes de Moulis), David Labat (Géosciences Envionnement Toulouse), Rachid Ababou (CNRS/INPT/IMFT), Hasan Fatmi (PhD at IRSN and CNRS/INPT/IMFT) and David Bailly (TREES Institute).
493 494 495 499 500 502 . 496 9 10 497 11 12 13 498 14 15 16 17 1 19 20 21 501 22 23 24 25 26 503 27 28 29 30 31 32 33 34 35 36 37 38 39 508 40 41 42 43 44 45 46 47 48 49 50 512 51 52 53 54 55 514 56 57 58 59 60 61 504 505 506 507 509 510 511 513 515 516 References
Ababou, R., Fatmi, H., Matray, J.-M., Nussbaum, C., Bailly, D., 2012. Statistical analyses of Pore Pressure Signals in Claystone During Excavation Works at the Mont Terri Underground Research Laboratory. In Rehab Abdel Rahman (Ed.), Radioactive
Waste (pp. 373-430). InTech, ISBN: 978-953-51-0551-0
AF Consult, 2012. HA Experiment: Hydraulic Database Phases 1 - 16 Version 1.0. Mont Terri TechnicalNote 2010-74, 22 pp.
Altinier, M.V., 2006. Etude de la composition isotopique des eaux porales de l’argilite de Tournemire : inter-comparaison des méthodes de mesure et relations avec les paramètres pétrophysiques. Ph. D. dissertation, Université Paris-Sud 11, Orsay, France, 200 pp.
Archie, G.E., 1942. The electrical Resistivity Log as an Aid in Determining Some Reservoir Characteristics. Transactions of the American Institute of Mining Metallurgical, and Petroleum Engineers, 146, 54-62.
Bailly, D., Matray, J.-M., Ababou, R., 2014. Temporal behavior of a ventilated claystone at the Tournemire URL: Cross-spectral analyses focused on daily harmonics.
Engineering Geology, 183, 137-158
Bailly, D., Matray, J.-M., 2015. LP-A Experiment: Phase 20, Statistical analysis of time series acquired in the EZ-B Niche and at the Main fault. Mont Terri TN 2014-59, 77p.
Barker, J.A., 1988. A Generalized Radial-Flow Model for Hydraulic Tests in Fractured Rock.
Water Resources Research, 24(10), 1796-1804
Blaesi, H.R., Peters, T.J., Mazurek, M., 1991. Der Opalinus-Ton des Mt. Terri (Kanton Jura): Lithologie, Mineralogie und physiko-chemische Gesteinsparameter. Nagra Interner Bericht NAGRA NIB 90 60.
517 518 519 520 521 522 523 524 525 526 527 528 529 530 531 532 533 534 535 536 537 538 539 540
Boldt-Leppin, B.E.J., Hendry, J., 2003. Application of Harmonie Analysis of Water Levels to Determine Vertical Hydraulic Conductivities in Clay-Rich Aquitards. Ground Water
Vol. 41, No. 4, 514-522.
Bossart, P. Thury, M. (2008). Mont Terri Rock Laboratory - Project, Programme 1996 to 2007 and Results. Reports of the Swiss Geological Survey No. 3, Swiss Geological Survey (SGS, swisstopo), Wabern, Switzerland.
Boulin, P.F., Bretonnier, P., Gland, N., Lombard, J.M., 2012. Contribution of the Steady State Method to Water Permeability Measurement in Very Low Permeability Porous Media. Oil and Gas Science and Technology, 67, 387-401.
Boving, T.B., Grathwohl, P., 2001. Tracer diffusion coefficients in sedimentary rocks: correlation between porosity and hydraulic conductivity. Journal of Contaminant Hydrogeology, 53, 1-2, 85-100.
Bredehoeft, J.D., 1967. Response of Well-aquifer Systems to Earth Tides. U.S., Geological Survey, Washington, D.C., 20242
Bredehoeft, J.D. and Papadopoulos, S.S. 1980. A method for determining the hydraulic properties of tight formations, Water Resources Research, 16(1): 233-238.
Butler, J.J., 1998. The Design and Performance, and Analysis of Slug Tests. Lewis Publishers (imprint of CRC Press LLC.) Boca Raton, Florida. 252 pp.
Chapuis, R. P. and Aubertin, M., 2003. Predicting the Coefficient of Permeability of Soils Using the Kozeny-Carman Equation. Département des génies civil, géologique et des mines, Ecole Polytechnique de Montréal, Montreal, 35 pp.
Croisé, J., Schilckenrieder, L., Marschall, P., Boisson, J.Y., Vogel, P., Yamamoto, S., 2004. Hydrogeological investigations in a low permeability claystone formation: the Mont Terri Rock Laboratory. Physics and Chemistry of the Earth, 29, 3-15.
541 542 543 544 545 546 547 548 549 550 551 552 553 554 555 556 557 558 559 560 561 562 563
Cutillo, P.A., Bredehoeft, J.D., 2011. Estimating Aquifer Properties from the Water Level Response to earth Tides. Ground Water, 49(4), 600-610
Doodson A.T., Warburg, H.D., 1941. Admiralty manual of tides. Her Majesty’s Stationary Office, London, xii, 270 pp.
Fatmi, H., Ababou, R., Matray, J.-M., 2008. Statistical pre-processing analyses of hydrometeorological time series in a geological clay site (methodology and first results for Mont Terri’s PP experiment). Journal of Physical Chemistry Letters
A/B/C 33 (Suppl. 1), S14-S23
Fatmi, H., 2009. Méthodologie d’analyse des signaux et caractérisation hydrogéologique : application aux chroniques de données obtenues aux laboratoires souterrains du Mont Terri, Tournemire et Meuse/Haute-Marne. PhD thesis, Université de Toulouse, 249p.
Fernàndez-Garcia, D., Gômez-Hernândez, J.J., Mayor, J.C., 2007. Estimating hydraulic conductivity of the Opalinus Clay at the regional scale: Combined effect of desaturation and EDZ. Clay in natural and engineered barriers for radioactive waste confinement - Part 2, 32, 8-14, 639-645.
Fierz, T., Rosli, U., 2014. Mont Terri DB Experiment: Installation of a 7-interval multi-packer system into borehole BDB-1 Instrumentation Report. Mont Terri Technical Note
2014-23, 37 pp.
Gautschi, A., 2001a. Hydrogeology of a fractured shale (Opalinus Clay): Implications for the deep disposal of radioactive wastes. Hydrogeology Journal, 9, 97-107.
Horseman, S.T., Higgo, J. J. W., Alexander, J., and Harrington, J. F., 1996. Water, Gas and Solute Movement Trough ArgillaceousMedia. Nuclear Energy Agency, 306 pp.
564 565 566 567 568 569 570 571 572 573 574 575 576 577 578 579 580 581 582 583 584 585
Jaeggi, D., Hostettler, B., Residorf, N.N., 2017. Lithological facies and new stratigraphie corrélations of the Opalinus Clay. Swiss Journal of Geosciences, (this volume).
Jiang, Z., Martiethoz, G., Taulis, M., Cox, M., 2013. Determination of vertical hydraulic conductivity of aquitards in a multi-layered leaky system using water-level signals in adjacent aquifers. Journal of Hydrology, 500, 170-182.
Johns, R.T., Vomvoris, S.G. and Low, S., 1995. Review of hydraulic field tests in the Opalinus Clay of Northern Switzerland. In: Hydraulic and hydrochemical characterisation of argillaceous rocks. Proceedings of the International Workshop,
Nottingham, UK, June 1994, Nuclear Energy Agency of the OECD, Paris, 167-177
Kell, G. S., 1975. Volume properties of ordinary water, in Handbook of Chemistry and Physics, 56th ed., edited by R. C. Weast, CRC Press, Cleveland, Ohio.
Keller, C.K., Van der Kamp, G., Cherry, J.A., 1989. A Multiscale Study of the Permeability of a Thick Clayey Till. Water Resources Research, Vol. 25, No. 11, 2299-2317.
Kostek, S., Schwartz, L., and Johnson, D., 1992. Fluid permeability in porous media: Comparison of electrical estimates with hydrodynamical calculations. Physical Review B 45(1), 186-194.
Marschall, P., Horseman, S., Gimmi, T., 2005. Characterisation of gas transport properties of the Opalinus Clay, a potential host rock formation for radioactive waste disposal. Oil and Gas Science and Technology, 60, No. 1, 121-139
Matray, J.M., Savoye, S., Cabrera, J., 2007. Desaturation and structure relationships around drifts excavated in the well-compacted Tournemire’s argillite (Aveyron, France).
586 587 588 1 2 3 4 5 6 7 589 9 10 590 11 12 13 14 15 16 17 18 19 20 21 22 23 24 25 26 27 28 29 30 31 32 33 34 35 36 37 38 39 40 41 42 43 44 45 46 47 48 49 50 51 52 53 54 55 56 57 58 59 60 61 591 592 593 594 595 596 597 598 599 600 601 602 603 604 605 606 607 608
Mazurek, M., Alt-Epping, P., Bath, A., Gimmi, T., Waber, H.N., 2009. Natural Tracer Profiles Across Argillaceous Formations: The CLAYTRAC Project. Nuclear Energy Agency (OECD/NEA) report, Paris, France, 365 pp.
Mejias, M., Renard, P., Glenz, D., 2009. Hydraulic testing of low-permeability formations: A case study in the granite of Cadalso de los Vidrios, Spain. Engineering Geology,
107, 88-107.
Melchior, P., 1978. The Tides of the Planet Earth. Pergamon Press, Oxford, 609 p.
Mercer, J. W., Pinder, G. F., and Donalson, I. G., 1975. A Galerkin-finite element analysis of the hydrothermal system at Wairakei, New-Zealand. Journal of Geophysical Research, 80, 2608-2621.
Merritt, M.L., 2004. Estimating hydraulic properties of the Floridan aquifer system by analysis of earth-tide, ocean-tide, and barometric effects. Collier and Hendry Counties, Florida. U.S. Geological Survey Water-resources investigations Report
03-4267, vi, 70 pp.
Monnier, G., Stengel, P., Fies, J.C., 1973. Une méthode de mesure de la densité apparente de petits agglomérats terreux. Application à l’analyse de système de porosité du sol.
Annales Agronomiques, 24, 533-545.
Munoz, J.J., Lloret, A., Alonso, E., 2003. Characterization of hydraulic properties under saturated and non saturated conditions: Project deliverable 4, Unpublished Technical Report, CIMNE.
Nagra (2002). Project Opalinus Clay: Safety Report, Demonstration of disposal feasibility for spent fuel, vitrified high-level waste and long-lived intermediate-level waste (Entsorgungsnachweis). TechnicalReport 02-05, 472 pp.
609 610 611 612 613 616 617 618 619 620 621 622 9 10 11 12 13 614 14 15 16 615 17 1 19 20 21 22 23 24 25 26 27 28 29 30 31 32 33 34 35 36 37 623 38 39 40 41 42 43 44 45 626 46 47 48 49 50 628 51 52 53 629 54 55 56 57 58 59 60 624 625 627 630 631
Neuzil, C.E. 1982. On conducting the modified ‘slug’ test in tight formations. Water Resources Research, 18(2): 439-41.
Neuzil, C.E., 1994. How permeable are clays and shales? Water Resources Research, Vol. 30, No. 2, 145-150.
Neuzil, C.E., 2000. Osmotic génération of “anomalous" fuid pressures in geological environments. Nature, 403, 182-184.
Nussbaum, C., Bossait, P., 2004. Compilation of K-values from packer tests in the Mont Terri rock laboratory. Mont Terri TechnicalNote 2005-10, 29 pp.
Nussbaum, C., Bossart, P., Amann, F., Aubourg, C., 2011. Analysis of tectonic structures and excavation induced fractures in the Opalinus Clay, Mont Terri underground rock laboratory (Switzerland). Swiss Journal of Geosciences 104, 187-210.
Nussbaum, C., Kloppenburg, A., Caer, T. and Bossart, P., 2017. Tectonic evolution of the Mont Terri anticline based on forward modelling. Swiss Journal of Geosciences, (this volume).
Pape, H., Clauser, C., and Iffland, J., 1999. Permeability prediction based on fractal pore- space geometry. Geophysics, 64, 1447-1460.
Pearson, F.J., Arcos, D., Boisson, J-Y., Fernândez, A. M., Gabler, H. E., Gaucher, E., Gautschi, A., Griffault, L., Hernân, P., Waber, N., 2003. Mont Terri Project - Geochemistry of water in the Opalinus Clay Formation at the Mont Terri Rock Laboratory. Report of the FOWG, N°5, Geology Series, 143 pp.
Peters, M., Mazurek, M., Jaeggi, D., Müller, H., 2011. WS-H Experiment: Heterogeneities in the sandy facies of Opalinus Clay on a scale on millimetres to centimeters. Mont Terri Technical Note 2010-76, 66 pp.
632 633 634 637 638 640 641 1 2 3 4 5 6 7 635 9 10 636 11 12 13 14 15 16 17 18 639 19 20 21 22 23 24 25 26 642 27 28 29 30 31 32 33 34 35 36 37 38 39 647 40 41 42 648 43 44 45 46 47 48 49 50 651 51 52 53 54 55 56 57 58 59 60 61 643 644 645 646 649 650 652 653
Terzaghi, V.K., 1936. The Sheering Résistance of Saturated Soils and the Angle between the Planes of Shear. First International Conférence of Soil Mechanics, Harvard University, Vol. 1, 54-46.
Timms, W.A., and Acworth, R.I., 2005. Propagation of pressure change through thick clay sequences: An example from Liverpool Plains, NSW, Australia. Hydrogeology Journal, 13, No. 5-6, 858-870.
Tremosa, J., 2010. Influence of osmotic processes on the excess-hydraulic head measured in the Toarcian/Domerian argillaceous formation of Tournemire. Ph. D. dissertation,
Université Pierre et Marie Curie, Paris VI, France, 322 pp.
Ullman, W.J., and Aller, R.C., 1982. Diffusion Coefficients in Nearshore Marine Sediments.
Limnology and Oceanography, 27, 552-556.
Unesco, 1981. Tenth report on the joint panel on oceanographic tables and standard. Sidney, BC, Canada. 1-5 september 1980. Unesco technicalpaper in marine science, 36, 28 pp.
Van der Kamp, G., 2001. Methods for determining the in situ hydraulic conductivity of shallow aquitards: an overview. Hydrogeology Journal, 9, 5-16.
Van Loon, L.R., Soler, J.M., Jakob, A., Bradbury, M.H., 2003b. Effect of confining pressure on the diffusion of HTO, 36Cl- and 125I- in a layered argillaceous rock (Opalinus Clay): diffusion perpendicular to the fabric. Applied Geochemistry, 18, 1653-1662.
Van Loon, L.R., Mibus, J., 2015. A modified version of Archie’s law to estimate effective diffusion coefficients of radionuclides in argillaceous rocks and its application in safety analysis studies. Applied Geochemistry, 59, 85-94.
654 655 656 659 660 1 2 3 4 5 6 7 657 9 10 658 11 12 13 14 15 16 17 18 19 20 21 22 23 24 25 26 27 28 29 30 31 32 33 34 35 36 37 38 39 40 41 42 43 44 45 46 47 48 49 50 51 52 53 54 55 56 57 58 59 60
Wiegel, R.L., 1964. Tsunamis, storm surges, and harbour oscillations. Ch. 5 in
Oceanographical Engineering, Prentice Hall, Englewood Cliffs, New Jersey, 95 127.
Yu, L., Rogiers B., Gedeon, M., Marivoet J., Craen, M.D., Mallants, D., 2013. A critical review of laboratory and in-situ hydraulic conductivity measurements for the Boom Clay in Belgium, Applied Clay Science, 75-76, 1-12
1 2 3 4 5 6 7 8 9 10 11 12 13 14 15 16 17 18 19 20 21 22 23 Figure captions
Fig. 1: Geological cross-section of the Mont Terri anticline (adapted from Nussbaum et al, 2017, this volume). Location of the rock laboratory is indicated by a white line. The BDB-1 deep borehole, represented by a thick black line, crosses the lower part of the Dogger aquifer, the entire Opalinus Clay formation and the upper part of the Liassic marls.
Fig. 2: a) Stratigraphic sequence along the BDB-1 borehole; b) BDB-1 borehole layout; c) Double packer elements.
Fig. 3: Experimental set up for: a) pulse withdrawal tests; b) constant rate pumping tests performed on BDB-1 borehole (©Solexperts).
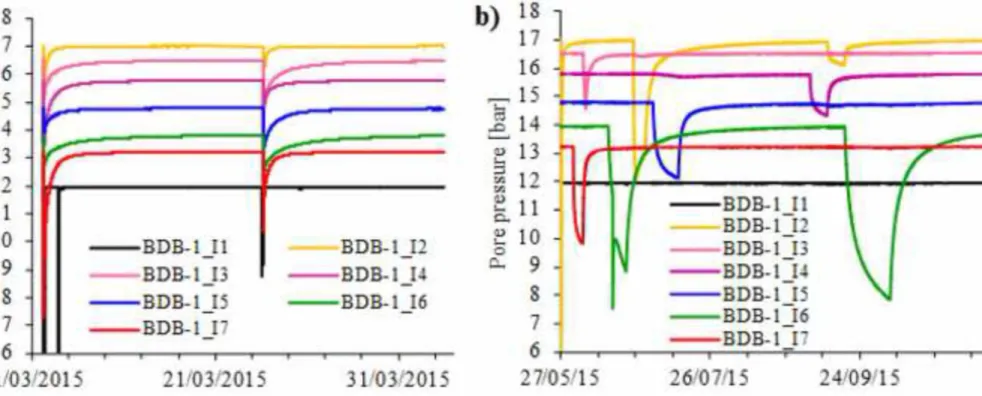
Fig. 4 : Records of pore pressure responses in the seven intervals of BDB-1 borehole to: a) pulse tests; b) constant rate withdrawal tests.
Fig. 5: Petrophysical parameters acquired along BDB-1 borehole: a) Water accessible porosity acquired by oven-drying at 105°C; b) Specific surface area obtained by BJH and BET methods; c) Grain density estimated by helium pycnometry on oven dried samples.
Fig. 6: a) Intrinsic permeability profile and b) hydraulic conductivity profile computed across the Opalinus Clay and the Passwang formation for cementation factor of 2, 2.3 and 2.5.
Fig. 7: System compressibility computed from pulse testing in BDB-1 borehole. Dashed line represents the water compressibility at 10°C. The outlier in the lower part of the borehole is due to a very low withdrawn volume.
Fig. 8: Comparison of the different tests performed on BDB-1 borehole: a) degree of dissipation associated to the recovery phases of pulse withdrawal tests; b) normalised pressure drawdown during constant rate withdrawal tests and c) degree of dissipation following the end of the withdrawal phase.