HAL Id: hal-01898935
https://hal.archives-ouvertes.fr/hal-01898935
Submitted on 8 Sep 2020
HAL is a multi-disciplinary open access
archive for the deposit and dissemination of
sci-entific research documents, whether they are
pub-lished or not. The documents may come from
teaching and research institutions in France or
abroad, or from public or private research centers.
L’archive ouverte pluridisciplinaire HAL, est
destinée au dépôt et à la diffusion de documents
scientifiques de niveau recherche, publiés ou non,
émanant des établissements d’enseignement et de
recherche français ou étrangers, des laboratoires
publics ou privés.
surface model: description and evaluation in the
ORCHIDEE high-latitude version model
(ORC-HL-PEAT)
Chloé Largeron, Gerhard Krinner, Philippe Ciais, Claire Brutel-Vuilmet
To cite this version:
Chloé Largeron, Gerhard Krinner, Philippe Ciais, Claire Brutel-Vuilmet. Implementing northern
peatlands in a global land surface model: description and evaluation in the ORCHIDEE high-latitude
version model (ORC-HL-PEAT). Geoscientific Model Development, European Geosciences Union,
2018, 11 (8), pp.3279 - 3297. �10.5194/gmd-11-3279-2018�. �hal-01898935�
https://doi.org/10.5194/gmd-11-3279-2018 © Author(s) 2018. This work is distributed under the Creative Commons Attribution 4.0 License.
Implementing northern peatlands in a global land surface model:
description and evaluation in the ORCHIDEE high-latitude
version model (ORC-HL-PEAT)
Chloé Largeron1,2,a, Gerhard Krinner1, Philippe Ciais2, and Claire Brutel-Vuilmet1
1CNRS and Univ. Grenoble Alpes, Institut de Géosciences de l’Environnement (IGE), 38000 Grenoble, France 2Laboratoire des Sciences du Climat et de l’Environnement, Institut Pierre-Simon Laplace, CEA-CNRS-UVSQ,
CE Orme des Merisiers, 91191 Gif-sur-Yvette CEDEX, France
acurrently at: Météo France/CNRS, CNRM – GAME URA 1357, CEN, St. Martin d’Hères, France
Correspondence: Chloé Largeron (chloe.largeron@gmail.com) Received: 16 June 2017 – Discussion started: 7 July 2017
Revised: 18 July 2018 – Accepted: 19 July 2018 – Published: 14 August 2018
Abstract. Widely present in boreal regions, peatlands con-tain large carbon stocks because of their hydrologic proper-ties and high water content, which makes primary productiv-ity exceed decomposition rates. We have enhanced the global land surface model ORCHIDEE by introducing a hydrolog-ical representation of northern peatlands. These peatlands are represented as a new plant functional type (PFT) in the model, with specific hydrological properties for peat soil. In this paper, we focus on the representation of the hydrology of northern peatlands and on the evaluation of the hydrolog-ical impact of this implementation. A prescribed map based on the inventory of Yu et al. (2010) defines peatlands as a fraction of a grid cell represented as a PFT comparable to C3grasses, with adaptations to reproduce shallow roots and
higher photosynthesis stress. The treatment of peatland hy-drology differs from that of other vegetation types by the fact that runoff from other soil types is partially directed towards the peatlands (instead of directly to the river network). The evaluation of this implementation was carried out at differ-ent spatial and temporal scales, from site evaluation to larger scales such as the watershed scale and the scale of all north-ern latitudes. The simulated net ecosystem exchanges agree with observations from three FLUXNET sites. Water table positions were generally close to observations, with some exceptions in winter. Compared to other soils, the simulated peat soils have a reduced seasonal variability in water stor-age. The seasonal cycle of the simulated extent of inundated peatlands is compared to flooded area as estimated from satellite observations. The model is able to represent more
than 89.5 % of the flooded areas located in peatland areas, where the modelled extent of inundated peatlands reaches 0.83 × 10⁶km2. However, the extent of peatlands in northern latitudes is too small to substantially impact the large-scale terrestrial water storage north of 45◦N. Therefore, the inclu-sion of peatlands has a weak impact on the simulated river discharge rates in boreal regions.
1 Introduction
Peatlands are widely present in northern latitudes and in per-mafrost regions. They contain large carbon stocks that are estimated between 473 and 621 Gt C in boreal regions (Yu et al., 2010). Due to high soil moisture and low soil temper-atures, particularly in winter, soil carbon is slowly decom-posed and the accumulation of peat represents up to 25 % of the total carbon pool in soils (Jobbágy and Jackson, 2000). Meanwhile, ongoing and projected climate change is par-ticularly severe at these latitudes and leads to thawing per-mafrost and increasing the active layer depth (Manabe and Stouffer, 1980; Cai, 2005; Collins et al., 2013). The large peatland carbon reservoir might thus be partially mobilized in the future. Peatlands are also one of the greatest natural sources of methane (Fung et al., 1991). The methane emis-sion of peatlands depends significantly on the climate and especially on hydrological conditions at the surface. Consid-ered as wetlands, these areas have a significant influence on
the surrounding climate through moisture and heat flux ex-changes (Krinner, 2003; Pitman, 1991).
Given the importance of peatlands in the carbon and hy-drological cycle, studies have attempted to include their rep-resentation in global models. Peatlands have specific proper-ties concerning vegetation, hydrology and carbon. As ecosys-tems, peatlands are very different than other land areas, be-cause the vegetation can survive in a permanently inundated area (Cronk and Fennessy, 2001; Pezeshki, 2001). These conditions promote slower decomposition of carbon and the accumulation of carbon in the soils (Clymo et al., 1998). Widespread peatland formation started when boreal sum-mer insolation started to decrease after about 11 000 years BP (Tarnocai, 2006; MacDonald et al., 2006). High moisture content, a necessary condition for peatland development, is favoured by an important water supply and by the presence of frozen soil, which leads to reduced soil water infiltration. The large water holding capacity due to the hydraulic proper-ties of peat soil and the impermeable soils in a shallow depth due to frozen soils below enhance peatland occurrence in per-mafrost areas. However, the representation of peatland hy-drology in large-scale models remains complex, since peat-lands remain subgrid-scale features conditioned by a range of complex processes.
The representation of peatlands in a land surface model therefore requires specific parameterizations of biological and hydrological processes. In order to improve the CO2and
energy fluxes of peatlands, the first step is to include a pa-rameterization of typical peatland vegetation as a new PFT, with peatland extent being prescribed.
Some studies have used the flooded area to model potential peat areas and then estimate their amount of methane emis-sions (Prigent et al., 2007; Ringeval et al., 2012). Although peatlands are characterized by a high soil moisture content, the corresponding WTD has a seasonal variation; peatlands are not always flooded. Furthermore, most peatlands are lo-cated in high northern latitudes and undergo freeze and thaw periods, which have to be taken into account, given their im-pact on the distribution between runoff and infiltration.
In this study, we focus on a better representation of the hydrological processes occurring in peatlands located in northern latitudes. These developments were carried out in the high-latitude version of the model ORCHIDEE (ORCHIDEE-MICT; Koven et al., 2009; Gouttevin, 2012; Ringeval et al., 2012; Guimberteau et al., 2017). A fixed map is used to define the location of peatlands, where each of them corresponds to a fraction of the grid cell. Peatlands strongly depend on local conditions and necessarily remain subgrid features at spatial resolutions of the order of 100 km. This study therefore focuses on the global hydrological be-haviour of the areas with a high peatland fraction. We evalu-ate modelled hydrological processes of peatlands against site and satellite observations and carry out sensitivity tests of the WTD as a function of the spatial fraction of peatlands.
2 Model description
2.1 ORCHIDEE high-latitude version
In the present study, we introduce the northern peatland (ver-sion ORC-HL-PEAT, rev. 3058) in a specific high-latitude version (ORCHIDEE-HL/ORCHIDEE-MICT v1, rev. 1255; Koven et al., 2009) of the IPSL (Institut Pierre Simon Laplace) land surface model ORCHIDEE (Krinner et al., 2005). This is a preliminary version of Guimberteau et al. (2017) that includes a soil-freezing scheme (Gouttevin, 2012), which is crucial to represent high-latitude land surface processes. This soil freezing scheme represents the change of thermal and hydrological soil properties during periods of freezing and melting. This improves the latent heat exchange, water suction and the heat capacity depending on the ice con-tent and the volumetric ice concon-tent (Gouttevin et al., 2012). The single-layer snow scheme in this model version supposes a constant snow density of 330 kg m−3and is known to un-derestimate the snow cover depth as well as the snow water equivalent (Gouttevin et al., 2012; Wang et al., 2013).
The model is driven by a prescribed atmospheric forcing, rather than coupled with the atmospheric model, in order to facilitate the assessment of the newly introduced processes, which will be described in the following sections. In addi-tion to the meteorological driving data, the model requires distributed parameters such as vegetation distribution, soil texture, topography and watershed location to represent land surface properties.
Including bare soil, there are 13 different PFTs in the model. In this study, dynamic vegetation is not activated and the fraction of each PFT is prescribed. We use the Olson et al. (1983) vegetation map, which defines 94 vegetation classes. These are then converted to 13 PFT fractions at a resolution of 0.5◦.
Some hydrological variables, such as transpiration and in-terception, vary as a function of the vegetation. The trans-port of water in the soil is described by the 11-layer scheme of De Rosnay (1999). The thickness of each layer increases geometrically with depth, from 1 mm in the top-soil to 1 m thickness at the standard 2 m total depth of the hydrological scheme (the soil thermal scheme includes additional layers below 2 m). Heat diffusion and moisture transport are calcu-lated between each soil layer. The water balance of the soil is defined separately as a function of class of vegetation and clustered for bare soil, trees and grasses. Each of these three soil types has a separate water balance. The fraction of area of each soil type is calculated as a function of the fraction of area of the corresponding PFT. However, the soil porosity is defined only as a function of the dominant soil texture in the grid cell, based on textural classification data from the global Food and Agriculture Organization map (FAO, 1978). Only one soil texture is defined per grid cell, which describes hy-draulic conductivity, residual and saturated water content as
well as the Van Genuchten parameters, which describe the hydrological properties of the soil.
The runoff and drainage transport to the river and oceans are accounted for by a routing scheme which is separated into three reservoirs with different velocities and residence times (Fekete et al., 1999; Vörösmarty et al., 2000; Ngo-Duc et al., 2005). To simulate peatland processes, the routing scheme is activated. The model runs at a half-hourly time step. The dif-ferent processes are simulated using a half-hourly or daily time step, depending on the process involved. Hydrologi-cal processes and energy exchanges are simulated at a half-hourly time step (Krinner et al., 2005).
2.2 Modelling peatlands
This section describes the developments and methods used to incorporate peatlands into the model. The inclusion of peat-land processes requires locating them. Here, we choose to use a fixed map of peatlands rather than a model that de-scribes only inundated areas, as this already has been studied in ORCHIDEE (Ringeval et al., 2012).
The structure of the hydrological scheme in ORCHIDEE implies that the peatlands have to be considered as linked to a new PFT with adapted biological parameters; only this allows for a separated calculation of the water balance. 2.2.1 Peatland map
Given the difficulty of locating large-scale peatlands, many methods exist to define these surfaces globally, but all of them have some biases. The TOPMODEL approach, which determines areas where the soil is temporarily saturated, does not allow for restoring the hydrology of peatlands; these are then described as wetlands (Ringeval et al., 2012). Other studies such as Wania et al. (2009a) use the IGBP-DIS soil map to identify peatlands in regions with high soil organic carbon content, including other landforms with high soil or-ganic carbon content such as yedoma (Tarnocai et al., 2009; Zimov et al., 2006).
To represent the evolution of the hydrology of peatlands over time, we chose to locate peatlands without integrat-ing other wetlands or other soils with high carbon content. We therefore use the peatland map obtained by Yu et al. (2010). This global map at a resolution of 2 km recognized peatlands where a grid cell contains at least 5 % of peat-lands. These data are obtained from inventories by countries, or from gleysols and histosols from the Harmonized World Soil Database V1.1 when the inventory is missing (Yu et al., 2010).
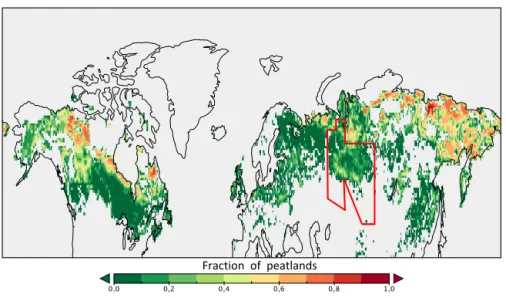
We constructed a new land cover map including peatlands as a combination of the original map of 13 PFTs and the global peatland map from Yu et al. (2010), with peatlands considered as a 14th PFT. The peatland map of Yu et al. (2010) is interpolated onto a 0.5◦×0.5◦regular grid in or-der to obtain a fraction of peatland fpeatYu for each grid cell
as shown in Fig. 1. The fraction of the new PFT fPFT 14
of peatlands then corresponds to fpeatYu, limited to the maxi-mum fraction of grassland. The fraction of grassland is cor-respondingly reduced, such that the new fraction of peat and grassland is equivalent to the initial grassland fraction.
This method leads to a reduction of 19 % of grassland area north of 45◦N. The resulting peatland area located in latitude between 45 and 90◦N is 3.8×10⁶km2, which is in reason-able agreement with the 4.0×10⁶km2estimated from obser-vations (Tarnocai et al., 2009).
2.2.2 Biological processes
Mosses, sphagnum and grassland mainly compose the veg-etation in peatlands. These vegveg-etation types can be grouped as flood-tolerant C3graminoid and sphagnum (Wania et al.,
2009b). Assuming peatlands have similar biological proper-ties as C3 grasses determined by Krinner et al. (2005), the
14th PFT added to represent peatlands has the same pre-scribed basic biological properties as the C3grasses.
Peatland vegetation can survive in saturated areas. The representation of inundation stress is taken into account in some models such as LPJ-WHy (Wania et al., 2009b). In the model, the parameterization of water stress is such that stress only exists in the case of lack of water. Thus, since they do not suffer from inundation stress, all PFTs represented in the baseline version of ORCHIDEE are flood tolerant. This pa-rameterization remains unchanged for peatlands.
On an energetic level, peatland primary production is lower than for grasses. Peatland vegetation has a nutrient deficiency caused in part by high water content, resulting in slower plant growth (Bridgham et al., 1996). In peat-lands, the nitrogen and phosphorous limitation leads to a re-duced photosynthetic capacity (Cronk and Fennessy, 2001; Pezeshki, 2001). Observations showed lower leaf nitrogen concentrations in peatlands than in other terrestrial plants in the same group, causing a lower concentration of RuBisCo (Aerts et al., 1999).
Because the ORCHIDEE high-latitude version (ORC-HL) model does not include the nitrogen cycle, the lower net pri-mary productivity (NPP) observed in peatlands due to the nitrogen limitation has to be taken into account by strength-ening RuBisCo limitation on carboxylation, which allows for the fixation of carbon dioxide (CO2) in the biomass.
The gross primary productivity (GPP) is influenced by nu-trient availability, climate conditions such as sunshine, rel-ative humidity, temperature and CO2 concentrations in the
atmosphere as well as by the maximum rate of carboxylation Vcmax, which corresponds to the maximum rate of RuBisCo.
The lower productivity in peatlands is represented empiri-cally by reducing Vcmaxby a factor δNcorresponding to the
nitrogen limitation. This limiting factor δN is chosen such
that the amplitude of simulated daily mean GPP is consis-tent with the observed daily mean GPP. For this study, the observation site chosen to adjust the GPP is the Swedish
Fraction of peatlands
Figure 1. Map of fraction of peatlands as defined in the vegetation map of 0.5◦resolution. The red outline highlights the Ob catchment.
peatland site of Degero (see site description, Sect. 2.3.1), which is a fen covered by herbaceous vegetation (Schubert et al., 2010). After applying an appropriate limiting factor, the simulations are forced by meteorological data of Degero using the FLUXNET database (Baldocchi et al., 2001). The limiting factor, δN, induced a value of Vcmax applied for
peatlands of 16 µmol m−2s−1, instead of the initial value of 70 µmol m−2s−1for non-peatland herbaceous C3plants.
This parameter setting has been tested with other peatland sites (Fajemyr, Minnesota and Siikaneva; Lund et al., 2009; Shurpali et al., 1995; Rinne et al., 2007), for which the esti-mated GPP is also improved (see Sect. 2.3.1 for site descrip-tion).
The reduction of the maximum rate of carboxylation leads to a lower leaf area index (LAI), which also affects the water balance.
In the model, the roots are represented by a root verti-cal profile R(z) = exp(−αz). The vertical distribution of root biomass is described by a decay parameter α (m−1), which is determined for each vegetation type in order to obtain ad-equate rooting depths and allows for a good estimation of water flows.
Frolking et al. (2001) estimated the rooting depth of peat-lands (bogs as well as fens) around 30 cm. The correspond-ing value of the decay parameter adapted for peatlands is α =10 m−1 (with 99 % of the root mass above 30 cm of depth), instead of the usual ORCHIDEE value of 4 m−1for herbaceous vegetation. The reduction of the rooting depth could increase water stress in dry periods, when the near-surface soil layer exhibit a water deficit.
In summary, the new peatland PFT corresponds to a flood-tolerant C3grass with reduced productivity due to the lack of
nutrients, and with a reduced rooting depth.
2.2.3 Hydrological processes
Peatlands have to be represented with a specific hydrological scheme. High water content in peatlands is maintained by poor drainage. In our model, the water balance is described for groups of PFTs. In the original version of ORCHIDEE, three different water columns are defined. These columns pertain to bare soil, trees and grasses. To represent the hydro-logical conditions of peatlands, we have added a new water column corresponding to the peatland PFT. This leads to a separation of the water balance of peatland soils that is cru-cial to represent the water content of these soils. The calcu-lation of evaporation is therefore separated for these soils, where an adjustment can subsequently counterbalance the non-representation of the mosses often present in these envi-ronments, which have a significant capacity to retain water. We aimed at improving the representation of the hydraulic properties of relevant large-scale peat soils by using appro-priate Van Genuchten parameters of organic peat soils as de-scribed in Table 1.
Peatlands are characterized by a higher average soil mois-ture content. Peatland water inflow comes from precipita-tion, surface runoff and from nearby soils. To represent these processes, we choose to infiltrate the soil column of peat-lands with the entire runoff generated in the non-peatland soil columns of the same grid box at the same time step.
This water supply is gradually infiltrated into the deeper soil layers. Infiltration depends on the hydraulic conductivity of each layer as described by De Rosnay (1999). In peatlands, the water content is mainly maintained in soils due to poor drainage (Boatman and Tomlinson, 1973). To prevent water lost by the drainage, we choose to block the deep drainage at the deepest soil layer, by applying a zero-flux for the bottom drainage (qN=0), because peatlands usually have no deep
Table 1. Van Genuchten parameters applied to organic peat soils for the column of peat soil in this study and their corresponding references.
Soil θs θr n α(m−1) Ksref(mm day−1)
Organic peat 0.90 0.15 1.38 5.07 2120
Reference Dawson (2006) Letts et al. (2000) Dawson (2006) Dawson (2006) Dawson (2006)
In the peatland scheme, the amount of standing water above the soil surface is taken into account as an additional reservoir. In this study, we use the standard 11-layer scheme of ORCHIDEE, as described by De Rosnay (1999), to rep-resent the hydrology of peatlands. When the water content of the first layer exceeds the saturated water content θs, the
reservoir is filled by the additional quantity of water, which cannot be infiltrated in the soil. This amount of water is then infiltrated into the soil as soon as the soil becomes under-saturated. The maximum content of this reservoir is 10 cm, in accordance with observations (Booth et al., 2005). When the capacity of the reservoir is exceeded, immediate surface runoff occurs.
Water supply to peatlands is produced by the total runoff from other soils in addition to precipitation. The total mass of water in the grid cell must be conserved. This leads to a dependence of the water supply to peatlands on the peatland fraction in a grid cell: if the peatland fraction is small, peat-lands receive a larger amount of water per square metre of peatland than when the peatland fraction is large, all other things being equal. The water supply Wsupplyof peat soils is
summarized in Eq. (1), TFis the throughfall, Srunoffthe runoff
coming from non-peat soils and Rstagnantthe water from the
reservoir.
Wsupply=TF+Srunoff+Rstagnant. (1)
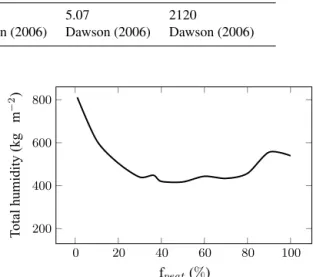
We studied the dependence of water routing on the peat-land fraction for the Degero site (Schubert et al., 2010) with the meteorological forcing of the year 2001. As expected, we obtain higher total soil moisture for low fractions of peat-lands, caused by the routing of runoff from other soils to peatlands. Conversely, peatland fractions above 80 % have a slightly higher amount of water than the intermediate frac-tions due to the storage of peatland runoff in the standing water reservoir, which is then re-infiltrated into the peat soils (shown Fig. 2). The distribution of the fraction of the non-peat PFTs in a grid cell does not substantially influence this result (tests performed but not shown).
The hydrological variations in peatlands are assessed us-ing the WTD. Perched water tables within peatlands are un-usual (Shi et al., 2015). Therefore the multi-layer hydrologi-cal scheme (De Rosnay, 1999), developed for standard soils, is not necessarily well adapted for the simulation of peatland hydrology. We thus diagnose the simulated peatland water ta-ble as a function of the total amount of soil water in the peat column, in analogy to a bucket model.
0 20 40 60 80 100 200 400 600 800 fpeat(%) To ta lhu m id it y (k g m − 2)
Figure 2. Amount of total humidity contained in the column of peat soil of 2 m depth at the Degero site in 2001 as a function of the percentage of peatland imposed in a grid cell.
The amount of water evaporated depends on the water availability of the soil. The evaporation E is limited by a set of factors β, such as the evaporation capacity of the soil βevap,
its transpiration capacity βtranspirand its interception
capac-ity βinter, as shown in Eq. (2) (Budyko, 1961; Farquhar et al.,
1980; Ball et al., 1987). The parameters βtranspirand βinterare
calculated for each PFT. However, there is a unique value for the evaporation capacity βevapin each grid cell.
E = βEpot, (2)
β = βevap+βtranspir+βinter. (3)
Peatland soils are flooded for part of the year, which leads to a vegetation saturated with water during this time. In that case, the relative humidity of the air at the surface of the soil is close to saturation. The calculation of evaporation is de-fined with the air humidity at 2 m above the surface per grid cell, taking into account the water balance of peatland as well as other PFTs. This unique grid-cell average air humidity is typically lower than the air humidity at the surface of flooded areas. To address this problem, we add a resistance to evapo-ration βevapto further limit the evaporation at the soil surface
of peatlands. This parameter is applied for all PFTs. In or-der to not affect other soils, this resistance is applied to the calculation of evaporation once separated by soil column.
We choose a resistance R in accordance with the soil mois-ture. Since the amount of water increases with the fraction of peatlands in a grid cell fpeat, the evaporation resistance
factor R is applied as a function of the peatland fraction fol-lowing Eq. (4). The reduction of evaporation does not occur when fpeat=1. This resistance avoids overestimating
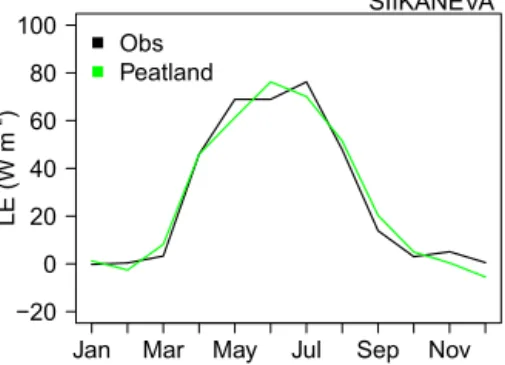
−20 0 20 40 60 80 100 LE (W m )
Jan Mar May Jul Sep Nov Obs
Peatland
SIIKANEVA
-2
Figure 3. Observed (black) and modelled (green) turbulent latent heat flux (LE) in W m−2of the peatland site of Siikaneva.
heat flux corresponds to the observation data at Siikaneva, using the meteorological forcing of this Finnish peatland site (Rinne et al., 2007; shown Fig. 3).
In this study, we made two peatland simulations: the first one, referred to as PEAT-LOWET in the following, includes the resistance to evaporation. In the second one, referred to as PEAT, no such resistance is applied.
R = fpeat 2 +
1
2 (4)
The flow of transpiration by the vegetation of peatlands is also reduced by reducing the GPP with the parameter Vcmax.
In peatlands, this lower rate can also be explained by the un-derestimation of the modelled air humidity at the canopy. 2.3 Model experiments
We evaluate the modelled processes at different spatial scales in order to evaluate the hydrological behaviour on peatland sites, and also to evaluate the impact of the inclusion of peat-lands on large-scale hydrology, which must be carried out for global climate models.
2.3.1 Site simulations
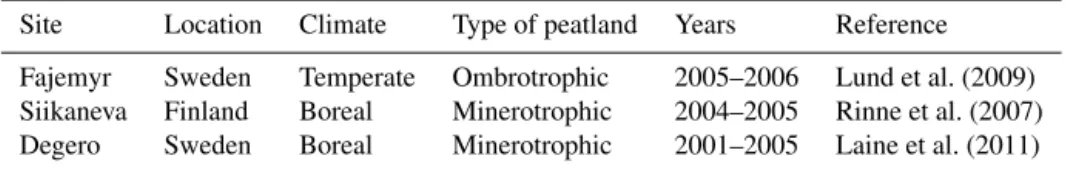
Firstly, we evaluate the modelled peatland processes with site measurements from the FLUXNET meteorological database (Baldocchi et al., 2001) for the peatland sites of Degero, Fa-jemyr and Siikaneva (Lund et al., 2009; Rinne et al., 2007; Nilsson et al., 2008; Sagerfors et al., 2008). The advantage of using the FLUXNET database is that it provides contin-uous meteorological data such as precipitation and tempera-ture, which help to compare data of net ecosystem exchange (NEE) or WTD.
The site of Fajemyr is located in southern Sweden (56◦150N, 13◦330E). It is an ombrotrophic bog in a temper-ate climtemper-ate at 140 m altitude. The annual mean (1961–1990) temperature and precipitation are 6.2◦C and 700 mm, respec-tively. The WTD is generally below the surface, where many
mounds can be seen with moss, sphagnum, sedge vegetation and small shrubs (Lund et al., 2009).
The site of Siikaneva is located in Ruovesi in the south of Finland (61◦490N, 24◦110E), in the southern boreal zone. Air temperature varies on average from −8 to 16◦C. The an-nual mean (1971–2000) temperature is 3.3◦C and the annual mean precipitation 713 mm. The year 2005 used in this study saw a higher amount of precipitation than average. During spring, the snow and peat melt in the beginning of April and the permanent snow cover starts in early December. Domi-nated by low vegetation, this minerotrophic fen is populated by sphagnum and peat mosses. The surface is relatively flat, with no pronounced hollows and bumps (Rinne et al., 2007). The site of Degero is located in the county of Västerbot-ten in northern Sweden in the middle boreal zone (64◦110N, 19◦330E). The climate in this site is temperate, cold and humid. This site of peatlands is a boreal oligotrophic minerotrophic fen surrounded by forest with herbaceous veg-etation and an average depth of peat between 3 and 4 m. Lo-cated at an altitude of 270 m, it covers an area of 6.5 km2 (Schubert et al., 2010). The annual mean temperature is 1.2◦C and annual mean precipitation is 567 mm (1971–2000; Laine et al., 2011).
The data obtained for these three sites are based on avail-able FLUXNET data from 2004 to 2005 for Siikaneva, from 2001 and 2005 for the Degero site, and from 2005 to 2006 for the Fajemyr site (Baldocchi et al., 2001). The information of peatland sites is summarized in Table 2
The site evaluation was performed using WFDEI meteoro-logical forcing at the 0.5◦grid cell containing each site, ex-cept for precipitation, which was prescribed from flux tower observations (FLUXNET data). The evaluation of the impact of the inclusion of peatlands on a larger scale was performed with both CRUNCEP and WFDEI forcing.
The years for which the WTD measurements coincide with the available years of FLUXNET meteorological forcing at the same site are 2002, 2005 and 2006 for the Degero, Si-ikaneva and Fajemyr sites, respectively. For the site evalua-tion, the simulated site is assumed to be covered by 100 % of the PFT of peatlands.
2.3.2 Large-scale simulations
The impact of the inclusion of peatland in the model has been studied at large spatial scales, considering all northern peatlands above 45◦N. The meteorological forcing data used to drive the ORCHIDEE model for large-scale simulations were taken from CRUNCEP v5.3 (Viovy and Ciais, 2011). This forcing is a combination of the 6-hourly climate forcing data NCEP corrected by the monthly observations data set of the Climatic Research Unit over the period 1901–2013 (Saha et al., 2014; Harris et al., 2014). The meteorological forc-ing data WFDEI is also used to determine the sensitivity of the input data to the amount of precipitation (Weedon et al., 2014). This forcing is based on the climate reanalysis
ERA-Table 2. Descriptions of peatlands sites used for site evaluation. The “Years” column corresponds to the available years of FLUXNET meteorological data.
Site Location Climate Type of peatland Years Reference
Fajemyr Sweden Temperate Ombrotrophic 2005–2006 Lund et al. (2009) Siikaneva Finland Boreal Minerotrophic 2004–2005 Rinne et al. (2007)
Degero Sweden Boreal Minerotrophic 2001–2005 Laine et al. (2011)
Interim on a 3-hourly time step corrected with the observed precipitation data from the Global Precipitation Climatology Centre with the time series of 1979–2013. Both simulations were carried out at 0.5◦resolution over the entire land north of 45◦N.
We have studied the impact of peatlands on the terres-trial water storage (TWS) variations north of 45◦N and com-pared them with satellite observations from the Gravity Re-covery and Climate Experiment (GRACE) mission (Tapley et al., 2004). GRACE provides estimates of mass anomalies by measuring the variations in the geopotential field between the two satellites. These estimates quantify changes in the water mass of land surfaces, ice and oceans. The GRACE data are available from April 2002 until June 2014. They are interpolated in a grid cell of 1◦×1◦resolution with monthly data of total water mass variations 1TWS, which is defined as the difference between the total water mass obtained at the time of the TWS measurements and the average total wa-ter mass between January 2004 and December 2009. In this study, we use GRACE release 5 spherical harmonic coeffi-cients from the Jet Propulsion Laboratory (JPL-RL05), avail-able from http://podaac.jpl.nasa.gov/grace (last access: 2 Au-gust 2018).
The impact of peatlands on river discharge has been evaluated for different catchments. Mean annual cycles of monthly mean discharge are computed with the CRUNCEP and WFDEI meteorological forcing at 0.5◦of resolution, for the 1979–1994 period for which we have observations. We carried out these simulations with different forcing files in or-der to study the sensitivity of the results to the meteorological forcing. These simulations are compared with observations from the Global Runoff Data Centre (Fekete et al., 1999). Here, we present the results for the Ob basin, which repre-sents one of the largest boreal basins north of 45◦N. This wa-tershed contains abundant peatland areas, particularly north of 60◦N. Although the average percentage of peatlands re-mains less than 10 % per grid cell at 0.5◦resolution, more than half of the grid cells have a non-zero fraction of peat-lands. Polewards of 60◦N, peatlands are present on more than 96 % of the grid points of the Ob basin.
The simulations were performed with a spin-up of sev-eral hundred years to ensure that hydrological processes have reached equilibrium.
3 Results
3.1 Site evaluation
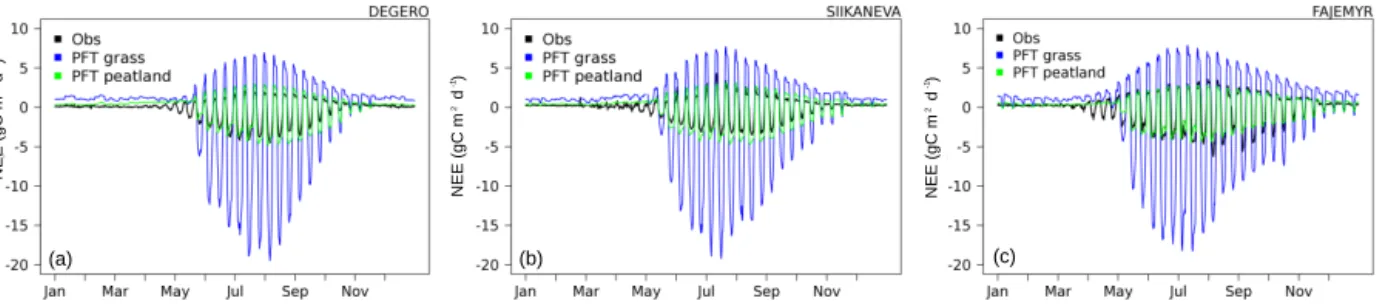
The mean diurnal cycle of NEE of the modelled peatland PFTs is compared to observations with a 10-day running-mean smoothing that eliminates day-to-day variations. This allows for evaluating the simulated evolution of the diurnal cycle of NEE on seasonal timescales (Fig. 4). This profile is based on the average of years available for each peatland sites. The reduction of the prescribed maximum carboxyla-tion rate, carried out in order to correct the overestimated GPP in the case of peatland vegetation, leads to a lower am-plitude of the diurnal cycle of the NEE.
The simulated amplitude of the maximum net uptake of CO2 by grasses (i.e. non-peatland vegetation simulated on
normal ground) reached 19 g C m−2day−1for all of the three different sites during the summer, while this amplitude can-not reach more than 4.8 (4.7; 4.5) g C m−2day−1 at the Degero (Siikaneva; Fajemyr) site both in observations and in the peatland simulations. That is, the capacity of daily car-bon exchange is 4 times lower for peatlands than for grasses under the same meteorological forcing. The model underes-timates the maximum net peatland uptake by between 10 % and 35 % for the Degero and Fajemyr sites, respectively, and overestimates by about 10 % for the Siikaneva site. The daily maximum deviation is on average 15 %, 16 % and 20 % dur-ing June and September, respectively. The profile of mod-elled peatland is relatively well represented and the correc-tion of the productivity leads to a good representacorrec-tion of the seasonal and diurnal variability in observed NEE of peat-lands.
The hydrology of peatlands is evaluated by comparing the modelled and observed WTD as shown on Fig. 5. The mod-elled water table is driven by the meteorological data given at these sites, where the monthly precipitation and temperature are shown at the top of Fig. 5. The precipitation counts both snowfall and rainfall, converted to millimetres.
In the setup of site simulations, the amount of water in the modelled peat soil is filled only with precipitation. How-ever, in reality, the water supply of the minerotrophic sites such as Degero and Siikaneva also comes from lateral input. This phenomenon cannot be represented in the model since the amount of water coming from sub-surface runoff and drainage remains unknown. Therefore, the modelled WTD
(a) (b) (c) NEE (gC m d ) 2 -1 NEE (gC m d ) 2 -1 NEE (gC m d ) 2 -1
Figure 4. Diurnal cycle of NEE smoothed with a 10-day running-mean filter of modelled PFT peatland (green), modelled PFT grass (blue) and observation (black) from the peatland sites of Degero (a), Siikaneva (b) and Fajemyr (c).
(a) (d) (b) (e) (c) (f)
Figure 5. Monthly mean temperature (black line) and monthly precipitation (blue bars) at the top and seasonal cycle of modelled (green) and observed (black) water table depth (WTD) at the bottom for the peatland sites of Degero (a), Siikaneva (b) and Fajemyr (c).
rather directly follows the quantity of precipitation. Model results for the minerotrophic sites (Degero and Siikaneva) show that the water supply from precipitation only is almost enough to reproduce the observed water table position. For the three sites of this study, the modelled WTD is in agree-ment with the observations during the summer, when the soil is no longer frozen. Results from the Degero fens site slightly underestimate the WTD during the summer. This small bias can be explained by the amount of water from groundwater, which is not represented in the model. The opposite is ob-served at the Siikaneva site, where the WTD is overestimated during the summer, which could come from an outgoing flow such as a low drainage rate. In winter, the modelled WTD is underestimated when the soil is frozen. The single-layer snow scheme used in this study does not represent percola-tion of water. When the soil is frozen, the infiltrapercola-tion of water is blocked, which leads to underestimating the water content in the soil leading to an underestimation of the WTD.
The modelled WTD at the Fajemyr site reached 64 cm dur-ing March 2006. This value can be explained by low rainfall in the previous year, where the annual precipitation is under 75 % of the amount of the year 2006 with a monthly value less than 50 mm month−1 between September and Decem-ber. The specific vegetation at the moss-dominated Fajemyr site helps to hold the water, which can then be infiltrated into the soil. The underestimation of the modelled WTD can be explained in part by the absence of the representation of mosses in the model.
The meteorological conditions of the minerotrophic peat-lands allows for a better representation of the hydrology of peatlands than the ombrotrophic bogs such as Fajemyr, where during February and March the simulated frozen soil prevents infiltration and thus maintains undersaturated soil conditions.
In an experiment where we add water content to force satu-rated soil conditions below 30 cm depth, the model simulates
a WTD for the Fajemyr site that matches the observed water table even in winter.
3.2 Sensitivity of types of peatlands to precipitation
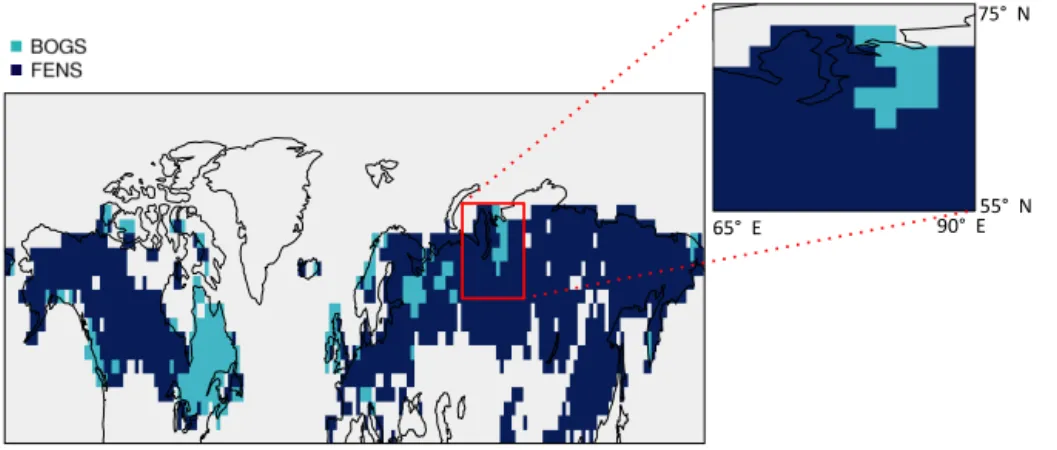
The misfit between modelled WTD and site measurements could be caused in part by the unknown lateral water inputs, which are not represented in site simulations where peatlands represent 100 % of the grid cell. Since we cannot separate bogs and fens at the spatial scales relevant here, we consider that all peatlands are fed by runoff in the model. Due to the lack of large-scale information on the distinction between peatland types, we have chosen to create this map in order to discern the hydrological behaviour of the different types of peatlands. Here, bogs are distinguished from fens from the WTD when peatlands are fed only by precipitation. A precipitation sensitivity study of the different types of peat-lands is carried out by modifying the precipitation according to different multiplicative factors.
We modelled ombrotrophic bogs, i.e. peatland fed only by rainfall that do not receive input from other soil columns, in two steps. First, we made a simulation switching off runoff transfer from other PFTs and defined the peatland fraction in a grid cell as ombrotrophic bogs if the water table in this grid cell was not deeper than 30 cm (in accordance with observa-tions; Booth et al., 2005) for at least 4 consecutive months in the mean year, for the 1990–2010 period. After that simu-lation, we continued to keep runoff transfer switched off for all ombrotrophic bogs, while the water balance of all other peat grid cells defined as minerotrophic fen is simulated with runoff transfer switched on. Usually the ombrotrophic bog condition tends to be fulfilled between January and April. By deduction, other peatlands present in the Yu et al. (2010) map are considered to be minerotrophic fens because they require additional water input to maintain a shallow WTD throughout the year. Then, the transfer of runoff occurs only for grid cells where the peatlands have been diagnosed as minerotrophic fens.
The ombrotrophic bogs are diagnosed as localized in ar-eas where peatlands are flooded during the summer. These bogs are located in north-eastern Canada, on the west coast of Canada, central Russia, United Kingdom, Norway and north-west Russia near the White Sea (represented in light blue in Fig. 6). The total area of these simulated ombrotrophic peat bogs represents more than 0.5×10⁶km2of the 3.8×10⁶km2 of the northern peatlands over 45◦N. However, the
large-scale climate forcing does not allow representing subgrid conditions (micro-climates, topographic setting, etc.) that oc-cur especially in mountain regions, and local sources of wa-ter from upslope areas. As a result, the regions which we identify, on large scales, as favourable for the occurrence of ombrotrophic bogs (regions in light blue in Fig. 6) can of course also contain minerotrophic fens. Moreover, the total area of ombrotrophic bogs can be underestimated due to the
lack of snowmelt runoff in the version of the model Wang et al. (2013).
On a regional scale, we carried out a sensitivity study of the simulated peatland hydrology to precipitation. The selected study area concerns western Siberia between 55– 75◦N and 64–90◦E (selected zoomed regions in Fig. 6). In parts of this region, large-scale conditions are favourable for the occurrence of ombrotrophic bogs, but in other parts of this region peatland occurrence requires complementary hor-izontal water input in addition to the large-scale climate forc-ing. In this region, the annual precipitation varies between 400 and 500 mm year−1 from 1990 to 2010. The forcing of the same year has been repeated for 5 consecutive years by varying the prescribed precipitation rate between 50 % and 150 % around the true value. We choose the year 2000, which is a year with an average precipitation of 450 mm year−1. The interannual variability in the precipitation is 12 % of the mean precipitation in this region.
Snowfall in these Siberian areas leads to persistent snow cover from December to April, while the averaged simu-lated WTD in summer reaches more than 1.5 m depth for ombrotrophic bogs soils that are not supplied with water by runoff (as shown in Fig. 7). In the case of ombrotrophic bogs, the 50 % precipitation reduction results in a summer WTD increase of 93 %. When precipitation is increased by 50 % the WTD in summer is reduced by 37% (Fig. 7).
The mean WTD of soil of minerotrophic fens reaches 14 cm in summer. The water supply from the runoff allows the fen soils to have a WTD closer to the surface than bog soils. When we reduce the precipitation by 50 %, the WTD of fen soils increases by 1 m, which corresponds to a relative increase of 7.19 (Fig. 8). The additional water supply makes minerotrophic peatlands (FENS) much more sensitive to pre-cipitation than ombrotrophic peatlands (BOGS) (as shown in Fig. 8). A 50 % precipitation increase leads to permanent flooding of these soils.
However, minerotrophic peatlands in this study are lo-cated south of 64◦N. In order to compare sensitivity to pre-cipitation of minerotrophic with ombrotrophic peatlands in the same weather conditions, it is advisable to consider also minerotrophic peatlands in areas where peatlands have been diagnosed as ombrotrophic. To make this comparison, a third simulation was carried out by feeding the peatlands in the ombrotrophic regions by runoff (“FENS in BOG areas” case in Fig. 8). The WTD of these soils are equivalent to other minerotrophic soils. The reduction of precipitation by 50 % results in a smaller increase in WTD than in the region of peatlands defined as minerotrophic, which reaches 55 cm depth in the summer instead of 12 cm.
To summarize, our simulations show that minerotrophic peatlands are more sensitive to precipitation than om-brotrophic peatlands. The reduction of the precipitation by a factor of 2 leads to a rise of the WTD by up to 8 times deeper for minerotrophic soils while this change does not exceed 2 times deeper for the ombrotrophic soils. This sensitivity is
55° N 75 ° N
65° E 90° E
Figure 6. Map of northern peatlands separating the type of bogs (light blue) from fens (dark blue) modelled peatlands based on conditions of the water table depth (WTD) fed by the precipitation only. The region of western Siberia (zoomed area) has been used for a sensitivity study of peatland to precipitation.
Figure 7. Seasonal cycle of WTD of minerotrophic (FENS), brotrophic (BOGS) and minerotrophic in regions localized as om-brotrophic (FENS in BOGS areas) with the standard precipitation (STD, full line), 50 % of the precipitation (50 % PRECIP, dashed line) and 150 % of the precipitation (150 % PRECIP, dotted line).
also seen when the runoff process is applied to areas defined as ombrotrophic (case “FENS in BOG areas”).
3.3 Large-scale hydrological impact
The inclusion of peatlands in the ORCHIDEE land surface model had to be assessed on a larger scale in order to de-termine the influence that peatlands have on large-scale hy-drology in northern latitudes. After evaluating the processes of simulated peatlands on measurement sites, this study eval-uates the impact of peatland implementation on the simu-lated river flow in boreal watersheds, and on the water mass changes of northern latitudes studied at different timescales.
Figure 8. Relative change of water table position of peatlands in August as a function of precipitation multiplication factor ranging from 0.5 to 1.5 depending on the type of peatlands: minerotrophic (FENS), ombrotrophic (BOGS) and minerotrophic in regions local-ized as ombrotrophic (FENS in BOGS areas).
3.3.1 Impact on the river discharge
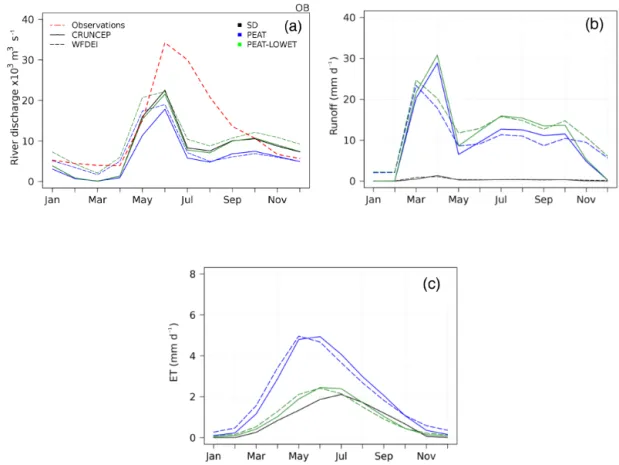
Implementing peatlands leads to the redirection of runoff from the other soil columns to the peat soils. Here, we eval-uate the impact of these changes on the simulated river dis-charge. We compare the modelled river discharge of the Ob basin in three different simulations. The standard simulation (STD) corresponds to the version of ORCHIDEE-HL which includes soil freezing (Gouttevin, 2012) and excludes the peatland scheme. In addition, two peatland configurations are shown: PEAT and PEAT-LOWET which represent the simu-lations where peatlands are activated with a standard and a modified evapotranspiration scheme, respectively, in which the evaporation is reduced by the R factor as in Eq. (4).
Figure 9. (a) Mean annual cycle of river discharge, (b) runoff of peat soils and (c) evapotranspiration of peatlands, for the Ob river basin. The observed river discharge is represented in red. The simulation are given with the standard version of ORCHIDEE-HL (STD, black), with peatlands scheme without (PEAT, blue) and with the reduced (PEAT-LOWET, green) evaporation, using the meteorological forcing CRUNCEP (full line) and WFDEI (dashed line).
The modelled river discharge with the original ORCHIDEE-HL version underestimated the river flow of watersheds located in boreal regions. This underestima-tion is known with the version of ORCHIDEE-HL that does not include the snow scheme by Wang et al. (2013) and Guimberteau et al. (2017), and comes from the overesti-mation of snow sublioveresti-mation (Ringeval et al., 2012; Wang et al., 2013). Here, the objective is to evaluate the impact of the inclusion of peatlands on the river flow compared to the same version of the model that does not include this scheme. The modelled mean seasonal cycle of the river discharge for the boreal Ob watershed is shown in Fig. 9a. The GRDC (Fekete et al., 1999) observed river discharge is shown as a dotted red line in Fig. 9a. The modelled river discharge PEAT with the peatland scheme results in a 20 % reduction in the maximum river discharge obtained by the standard ORCHIDEE-HL high-latitude version (STD, Fig. 9a). The reintroduction of runoff into peat soils allows for higher soil moisture resulting in an increased evapotranspiration (Fig. 9b and c), which can reach 4.9 mm day−1for the average month of June instead of 2.1 mm day−1 on average for the stan-dard version in the Ob watershed. The increase in
evapo-transpiration results in a reduction in river flow of more than 4600 m3s−1on average over the mean month of June.
The simulated river discharge PEAT-LOWET, which in-cludes the reduction of evapotranspiration as a function of the water supply (translated by the fraction of peatland in a grid cell), slightly reduces the underestimation of the river flow of the boreal basins. The average evapotranspiration of Ob basin peat soils reaches an average of 2.4 mm day−1in the June monthly mean, which approximately corresponds to the values obtained with the STD version (Fig. 9c).
The reduction of evaporation leads to an increase in sur-face runoff by 577 mm year−1on average of all peat soils in the Ob basin. The peatland scheme has a negligible impact on the river discharge when the reduction of evaporation is applied.
These results are not very sensitive to the meteorological forcing used. The seasonal peak of runoff from peat soils oc-curs one month earlier with the WFDEI than with the CRUN-CEP forcing. This results in a large river flow that occurs ear-lier in the season with the WFDEI forcing. The behaviour of the modelled river discharge of the Ob basin is similar for both meteorological forcings after the month of June.
In all cases, the introduction of the peatland scheme does not alleviate the underestimate of the spring peak and sum-mer discharge. This tends to confirm that this underestimate, at least the underestimate of the springtime maximum linked to snowmelt, is due to the known overestimate of snow evap-oration mentioned before. The new multi-layer snow scheme, not included in the model version used here, better represents snow depth and snow water equivalent, which were previ-ously both underestimated in ORCHIDEE. This corrects the underestimation of snowmelt runoff, and consequently im-proves the modelled river discharge in northern high latitudes (Guimberteau et al., 2017).
3.3.2 Impact on terrestrial water storage
We now compare the simulated total terrestrial water stor-age (TWS) variations north of 45◦N with (simulation PEAT)
and without (simulation STD) the peatland scheme with the satellite observations of the GRACE mission (Tapley et al., 2004) at different timescales (description in Sect. 2.3.2).
The observed TWSs are compared with the simulated to-tal water storage calculated from the water reservoirs repre-sented in ORCHIDEE: surface runoff (FAST), deep drainage (SLOW), lateral flux (STREAM), floodplains (FLOOD), snow mass (SNOW) and humidity of the soil (SOIL).
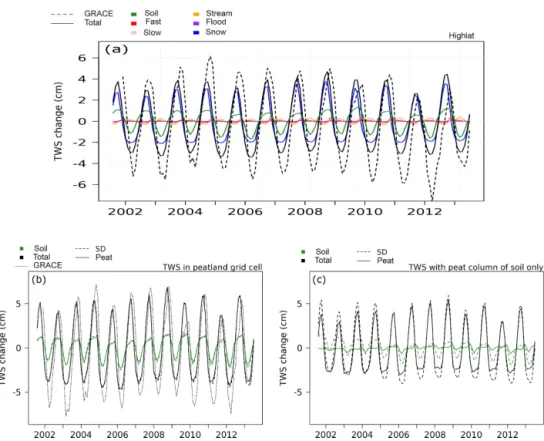
Figure 10a shows the simulated area-average TWS vari-ations by the STD version of the model between 2002 and 2013 and the contribution of each modelled water reservoir north of 40◦N. The modelled TWS variations represent only 73 % of the variation in TWS observed by satellites over all latitudes polewards of 40◦N. The mean amplitude of the
simulated TWS variation is 6.8 cm instead of the 9.4 cm ob-served with GRACE. Maximum TWS occurs during spring and rapidly decreases when the snow melts.
At a seasonal scale, the negative contribution of the mod-elled variation in TWS occurs too early compared to the ob-servations (figure not shown). This trend is due to the same shift of the contribution of the modelled TWS, linked to the snowmelt that occurs about one month too early (Wang et al., 2013). The interannual variability in the modelled TWS of all grid cells of the northern latitude is underestimated compared to the satellite observations (Fig. 10a).
The seasonal and interannual variation in TWS in boreal regions is mainly affected by the changes in snow mass and changes in water contained in soils. Changes in snow mass contribute alone to more than 5 cm of amplitude, which rep-resents more than 74 % of the TWS variations north of 40◦N.
The change of the water mass (liquid and ice) represents over 34 % of seasonal amplitude of total high latitude area-average TWS. The water reservoir from runoff (fast runoff and streams) contributes on average only 8 and 4 %, respec-tively, while the reservoirs related to floodplains and deep drainage are negligible (see Fig. 10a). Since the TWS varia-tions are mainly caused by snow mass changes and change of
humidity of the soil, the impact of the inclusion of peatland processes has to be studied.
Modelled TWS in Fig. 10a has the same phase as in the GRACE observation, but the annual amplitude is underes-timated by 27 % in the model. The simulation of TWS is improved by the soil freezing and snow parameterization in-troduced by Gouttevin et al. (2012) as shown by Largeron (2016). In the model, the accumulation of snow represents three-quarters of the total increase in TWS north of 45◦N between Autumn and Spring (blue curve in Fig. 10a). In ad-dition, the soil freezing parameterization keeps a mass of wa-ter stored as ice in the soil pores (green curve in Fig. 10a) in-stead, whereas in the absence of freezing, liquid water losses from runoff and drainage would decrease TWS. By contrast, the three free water reservoirs corresponding to water being routed to the ocean (red, orange and pink curves in Fig. 10a) have a small seasonal variation and thus do not contribute to the amplitude of TWS.
In our model, peatlands store a fraction of runoff water that is not transported to the ocean. To evaluate the impact of peatlands on the variation of TWS, we selected only the grid-cells containing some peat (non-zero peat fraction) and per-formed two simulations. We evaluated the contribution of the SOIL reservoir both for all soil columns (Fig. 10b) and for the peatland soil column only (Fig. 10c). The results shown in Fig. 10b indicate that the additional storage of water con-tributed by the peat fraction in the selected grid cells is negli-gible (the curves with and without peatlands are merely dis-tinguishable). In this case, the TWS changes are reduced by 0.10 cm due to the lower variation in soil humidity with the peatland scheme, where the interannual variations are low. Moreover, the interannual variability in TWS in the regions of northern peatlands only is better represented than for the whole boreal regions. However, the TWS change in northern peatlands is higher when only the soil column of peatland is considered (Fig. 10c) and reaches an increase in mass gain up to 2 cm in 2009. However, more water storage only occurs in the column of peat soil and not in the other column of soil of a grid cell. When the column of peat soil only is considered (Fig. 10c), the TWS change is higher and reaches an increase in mass gain up to 2 cm in 2009. This is the reason why we show in Fig. 10c simulated TWS averaged over the area cov-ered by peat only (column of peat soil) compared to a simu-lation where the same area is covered by grass. Local TWS remains lower in summer with peat than with grass, inducing a reduction of 65 % of the annual TWS change of these soils. The annual mean amplitude of the change of humidity of the peat soils only (Fig. 10c) has been reduced by 1.26 cm (from 1.94 to 0.68 cm with the peatland scheme). The TWS change of peat soils has a mean annual amplitude of 6.77 cm against 8.17 cm when the peatland scheme is not activated (STD).
In summary, the inclusion of the peatland hydrology leads to weaker water loss, which reduces the annual variation in the TWS of these soils. Since peatlands represent a small pro-portion of soils in northern latitudes, these changes do not
Figure 10. (a) Land surface above 45◦N terrestrial water storage (TWS) and the contribution of each reservoir in the model. TWS variations of latitudes over 45◦N (HIGHLAT) from GRACE (grey), the STD (black lines) and from the PEAT version (black dashed) for all peatlands grid cells with both peat and non-peat soil columns, (b) including the water reservoir variations in total soil moisture of the soil and (c) the variations in total soil moisture of the peat soil column only.
significantly affect the large-scale average TWS in northern latitudes.
3.4 Evaluation of modelled flooded peatland extents The hydrology of peatlands in northern latitudes is difficult to assess on a large scale since the measurements are scarce. One option is to compare flooded peatlands with satel-lite observations of flooded areas by Prigent et al. (2007). These data come from a multi-satellite method for calculat-ing flooded grid fractions at 0.25◦×0.25◦monthly resolution of free-surface waters for the period between 1993 and 2006, which have been interpolated on grid cells of 1◦×1◦ reso-lution. Here, we evaluate the location and the seasonality of flooded peatland using the CRUNCEP forcing of 1◦×1◦ res-olution and with monthly outputs covering the same period 1993–2006. The average seasonality of the simulated and ob-served flooded areas are compared with an average climate of the 1993–2006 period. Satellite observations cannot identify frozen flooded areas. Therefore the comparison with satellite flooded area was restricted to the thawing season. Since satel-lite observations account for all open-water surfaces, these data are counted only when the observed flooded areas co-exist with the grid points with a non-zero peatland fraction. Here, a peatland is considered flooded when the monthly
av-erage water table position is between the soil surface and 10 cm above the surface.
Figure 11 shows the observed and simulated flooded sur-face areas during the month of June, when the fraction of frozen soil is the lowest with a large extent of flooded area. The geographical distribution of flooded peatlands in the June monthly mean is mainly located in eastern Canada and central Russia. Satellite observations of Prigent et al. (2007) also show a large area of free-surface waters in these areas as shown in Fig. 11. The spatial variability is well represented with the exception of western Canada, eastern Russia and Finland, where the model does not simulate flooded areas in June. The flooded peatland areas coincide with the regions defined as ombrotrophic bogs (Fig. 6). This can be explained by the definition of the bogs we used, that is, areas where WTD does not exceed 30 cm depth for at least 4 consecutive months.
The flooded surfaces observed by satellite are present from April to August for Siberia and until September for Canada. Concerning modelled flooded peatlands, the seasonality is lower, especially in the northeastern region of Canada where peatlands are flooded throughout the year. Conversely, the extent of the modelled flooded peatlands is in sharp decline during the summer in western Siberia (not shown).
Areas (km2)
0 200 400 600 800 1000 (b) Modelled flooded peatland
(a) Satellite observed flooded areas (non frozen)
Figure 11. Extent of flooded areas (in km2) for each 0.5◦grid cell in the June monthly mean during the 1993–2006 period from satellite observations (a) and from simulated flooded peatlands (b).
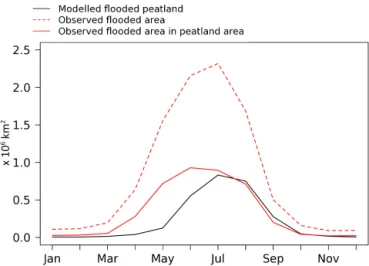
We compared the seasonality of flooded peatlands with satellite observation by considering only flooded peatlands when the soil is not frozen and in the absence of snow. Fig-ure 12 compares the observed seasonality among modelled peatland regions with the modelled flooded peatlands in the absence of snow or soil freezing. For each grid point, it is assumed that the observed flooded fraction corresponding to the peatlands cannot exceed the modelled fraction of peat-lands. The total area is based on the size of the grid cell and the corresponding peatland fraction obtained.
According to observations, the extent of flooded areas creases from April following the melting of snow. The in-crease in the modelled extent of flooded peatlands is less pronounced and occurs one month later. The simulated to-tal extent of flooded peatland reaches 0.55×10⁶km2in June, whereas the observed extent is 0.93×10⁶km2. The underes-timate of flooded peatlands can be explained by an overes-timate of snow sublimation, as well as an underesoveres-timate of the snow depth, which leads to insufficient runoff from snow melt (Gouttevin et al., 2012; Wang et al., 2013).
The observed area of flooded peatlands is maximum be-tween May and August. Precipitation amounts are also sig-nificant in summer in boreal flooded areas. As a result, the extent of flooded peatlands is well represented in July when summer precipitation occurs.
Underestimation of flooded peatlands in spring occurs in Canadian and Siberian regions with high peatland fractions. In Siberia, the observed flooded areas are more concentrated in the centre of the region, while the simulated flooded peat-lands are more uniformly distributed over the entire region. In western Siberia, the model underestimates the flooded peatlands by 0.04×10⁶km2in summer compared to obser-vations. This means that the model represents only 66 % of the observed extent of flooded peatlands in this region. In eastern Canada, the area of simulated flooded peatlands cor-responds to only 88 % of flooded areas observed in July–
Figure 12. Mean seasonal cycle of flooded land areas of 0.5◦grid cell for the 1993–2006 period from the modelled flooded peatland (black), observed flooded area above latitudes 45◦N (dashed red line) and from observed flooded area located in grid cells with non-zero fraction of peatlands (red line).
August. The model correctly simulates the flooded peatland areas near Hudson Bay and Quebec, but underestimates the flooded peatland areas to the south of Hudson Bay.
4 Discussion
This study has focused on northern peatlands since the ma-jority is located at these latitudes where the increase in tem-perature is the most important. These peatlands are also often located in permafrost regions that are particularly sensitive to climate warming. We aimed at a better representation of hy-drology of peatlands to account for their high carbon content in the soil and to include them in global climate models.
The developments related to the vegetation present in peat-lands, however, remain limited. In this study, we suppose a vegetation of peatlands close to the PFT grass already in-cluded in the model, with a lower root depth and a lower productivity. The thermal insulation of mosses which is par-ticularly present in peatland is not taken into account.
The hydrological processes of the peatlands were mainly based on the significant water supply of peatlands from runoff with negligible drainage and stagnant water on the soil surface. The hydraulic properties of peat differ greatly from those of mineral soils. Peat soils have a high soil poros-ity with an important hydraulic conductivporos-ity near the surface, which decreases much faster than mineral soils (Letts et al., 2000).
Although these parameters have been measured for peat and parameterized in the model from the studies of Letts et al. (2000); Dawson (2006) and Beringer et al. (2001), showing high variations between sites and between sapric and fibric peat, we did not implement peat-specific hydraulics due to the configuration of the model which used the dominant soil texture per grid cell. This approximation reduces infiltration compared to real-world peat, and underestimates the total water holding capacity of peat soil columns. One possible future improvement is to define these properties according to the different soil columns, in order to improve the hydrolog-ical scheme of peatland and other soils.
The water supply of peatlands that comes from the surface runoff of the other soils depends on their fraction within the grid cell. As a result, all other things being equal, the wa-ter supply increases as the fraction of peatland within a grid cell decreases. In an extreme case, in which peatlands would be spatially concentrated in a small area within a larger re-gion (because of topographic constraints, for example), this phenomenon would make the peatland hydrology resolution-dependent; however, the large-scale hydrology would cer-tainly also be resolution-dependant in such a case. On the scales of interest here, peatlands mostly represent a small fraction of the grid, and moderate resolution increases will not necessarily lead to very strong variations of the peatland fractions at the grid scale.
The site evaluation showed that the NEE is in agreement with observations and the internal hydrology of the model, with a negligible deep drainage and stagnant water above the surface, allows us to represent the water table profiles of peat-land sites when the local weather data are known. The dif-ferences in the water table profile between observations and simulations can come from the water supply of the runoff, which is not known and not represented in the simulations on site. The model underestimates the WTD in winter for the Siikaneva and Fajemyr sites. This can be explained by the overestimate of snow sublimation and the underestimate of the snowmelt runoff known in this version of the model (Wang et al., 2013).
The development of peatlands in the model does not dis-tinguish the different types of peatlands, since this informa-tion is not known on a large scale. In this peatland scheme, we have chosen to feed the peat soils by surface runoff in addition to precipitation in order to obtain shallow WTD, which corresponds to the type of minerotrophic peatlands. This limitation enhances an overestimation of the WTD of ombrotrophic peatlands, which are not represented in this study. However, we located areas where, according to OR-CHIDEE, peatlands could subsist as ombrotrophic bogs, in order to evaluate the sensitivity of these types of peat-lands to precipitation. The results showed that the WTD of minerotrophic peatlands are more sensitive to precipita-tion than ombrotrophic peatlands. Areas where ombrotrophic bogs may exist on large scales (that is, under the applied large-scale meteorological forcing) are also less sensitive to precipitation than other regions because the weather con-ditions are sufficient to supply wetlands with water. These results were obtained with runs at the typical resolution of a climate model. At much smaller scales, variability of to-pography, meteorological forcing, soil parameters, etc., will of course enable ombrotrophic peatlands to subsist in areas where the large-scale conditions appear unfavourable.
The evaluation of the inclusion of peatlands in the model was carried out at different spatial scales. We studied the im-pact of this implementation, which influences the routing of surface runoff, on the river discharge of the largest boreal watershed located in Siberia. We have found that hydrologi-cal processes of peatlands including the re-infiltration of sur-face runoff from other soils into peat soil induced a reduc-tion of 20 % of the river discharge of the Ob basin. However, the reduction of the evaporation from these soils counterbal-ances this process. The modelled river flow remains underes-timated compared to the GRDC observations (Fekete et al., 1999), because the snow scheme used here underestimates the snowmelt runoff in boreal regions (Wang et al., 2013). The new snow scheme in the more recent versions of the model makes it possible to improve the representation of the river flows of the boreal latitudes (Guimberteau et al., 2017). The hydrological impact of this inclusion has also been studied on a large scale and at different timescales. We have shown that this inclusion has a negligible impact on terres-trial water mass variations, since the fraction of peatlands remains sufficiently small compared to the area of high lati-tudes. The variations in water mass linked to soil moisture of all soils contribute to 34 % of the annual mean TWS. This is insufficient to influence the seasonal and interannual variations in the TWS in northern latitudes. However, the ORCHIDEE model in the standard version (STD) underes-timates the interannual variability in TWS compared to the observations. In boreal regions, the interannual variability in TWS is best explained by the change of precipitation or dis-charge (Landerer et al., 2010). A study with different meteo-rological forcing data could be made to better understand the bias due to the meteorological forcing used in this study.
The seasonal and interannual variations in water mass from the humidity of peat soils are reduced by 65 % when the hydrological processes of peatlands are activated. Changes in snow mass contribute to an average of 74 % of the total vari-ation in TWS. These simulated varivari-ations are underestimated compared to the observations of the GRACE satellite (Tapley et al., 2004), which may be caused by the overestimation of the simulated snow sublimation and the underestimation of the snow water equivalent in this version of the model (Wang et al., 2013; Gouttevin et al., 2012). However, the modelled interannual variations in TWS in peatland grid cells are in accordance with those of TWS from observations. The inter-annual variations of TWS are better represented in peatland grid cells than for all grid cells of northern latitudes above 40◦N (Fig. 10a and b).
At the northern latitude scale, the modelled hydrology of peatlands has been evaluated by comparing the area of mod-elled flooded peatland with the satellites observations from Prigent et al. (2007). This comparison showed that the areas where flooded peatlands are simulated corresponds well to the observations. In July, the extent of the observed flooded areas (0.89×10⁶km2) located in the grid points of the Yu et al. (2010) map and the simulated ones (0.83×10⁶km2) are similar. The snow scheme used in this version of the model causes or enhances a negative bias during the spring. The modelled extent of flooded areas is underestimated from March to June. However, since this study was carried out by comparing modelled peatland from observations only in the grid cells where the fraction of peatland is greater than zero, this study is dependent on the peatland map used.
We further showed that the peatland scheme is consistent with observations both on site (Baldocchi et al., 2001; Schu-bert et al., 2010; Rinne et al., 2007; Lund et al., 2009) and on a large scale (Prigent et al., 2007). These developments have no strong impact on continental hydrology.
These developments can be used to estimate current and future associated methane emissions and to understand the sensitivity of methane emissions to hydrological variations from these northern peatlands. For this, an adaptation of the CH4submodel for flooded wetlands by Ringeval et al. (2010)
and based on the methane flux density model of Walter et al. (2001) has been implemented taking into account WTD vari-ations of peatland soils (not shown in this paper) (Largeron, 2016).
This approach possibly may be used for tropical peatlands but its limitation is that runoff is only received from PFT in the same grid and this would need to be evaluated for trop-ical conditions. If a troptrop-ical peat system is connected to a large-scale hydrological network with water routing connect-ing grid-cells, then our approach cannot be used.
5 Conclusions
We have implemented peatlands in the high-latitude version of the land surface model ORCHIDEE, in order to take into account their important role in the carbon and hydrological cycle. We have represented peatlands as a new PFT based on a global inventory peatland map from Yu et al. (2010). This study focused on the evaluation of the hydrology of northern peatlands, which is crucial to represent the flux of carbon from these soils. The use of a fixed map makes it possible to follow the temporal evolution of the hydrological state of peatlands listed according to this map.
The hydrology of peatlands follows the internal hydrology of the model with a redistribution of the surface runoff from other soils, that is redirected into peat soils with a negligible deep drainage and a possible accumulation of water above the surface of these soils. These modifications are evaluated on site measurements that have shown the ability to represent the hydrological profile of peatlands.
We have shown that the reintroduction of the surface runoff of peatlands make these more vulnerable to changes in precipitation than peatlands fed only by precipitation. In this context, we considered that minerotrophic peatlands are more sensitive to precipitation than ombrotrophic peatlands. The location of ombrotrophic peatlands has a lower sensitiv-ity to precipitation than minerotrophic peatland areas.
The impact study of this implementation on the river flow and on the variation of terrestrial water storage showed that the incorporation of peatlands does not significantly affect the continental hydrology of the northern latitudes.
This study showed that the location and the seasonality of flooded peatlands are well represented, despite the low extent in early spring. The runoff of soils re-infiltrated into peat soils has resulted in a reduction of river flow of 20 % continuously for the growing season for the case of the Ob basin. This reduction becomes negligible when the corrected evaporation flux is activated.
At the interannual scale, the variations in the modelled ter-restrial water storage of northern latitudes is in accordance with the GRACE satellite observations. At these latitudes, the variations in mass of water from snow and soil moisture are the largest contributors, representing, on average from 2002 to 2014, 74 % and 36 % of the total variations in terrestrial water, respectively. The incorporation of peatlands induces a reduction of the variation in soil moisture of peat soils, both seasonally and interannually. This reduction enhances a total reduction of 6 % of the total variations in terrestrial water, which can be neglected at this large scale.
The new scheme represents peatland hydrology relatively well on a large scale, without disrupting the large-scale hy-drology of the surface model. The peatland hyhy-drology has only small effects on the simulation of northern river dis-charge. This implementation will be further used to estimate the future evolution of the hydrology of peatlands and their associated methane emissions at the end of the century.